 |
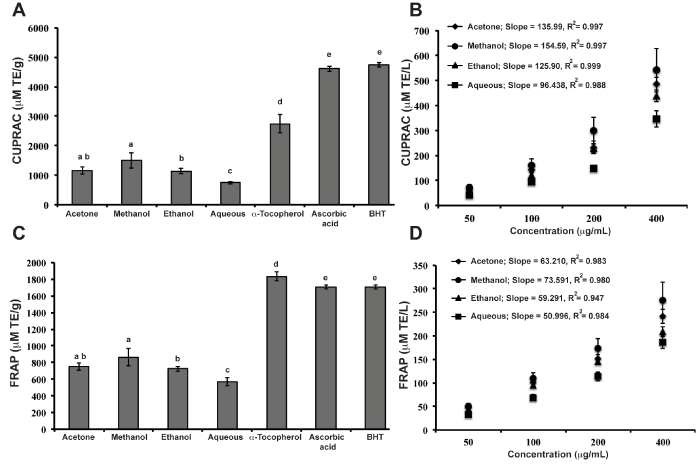
| Figure 5: Ion reducing capacity of the SC extracts using the CUPRAC (A, B) and FRAP (C, D) assays in comparison to α-tocopherol, ascorbic acid and BHT, at a concentration of 200 μg/mL. The values are mean ± standard deviations for triplicate experiments and those not sharing a letter on top of the columns are significantly different at p<0.05. |