 |
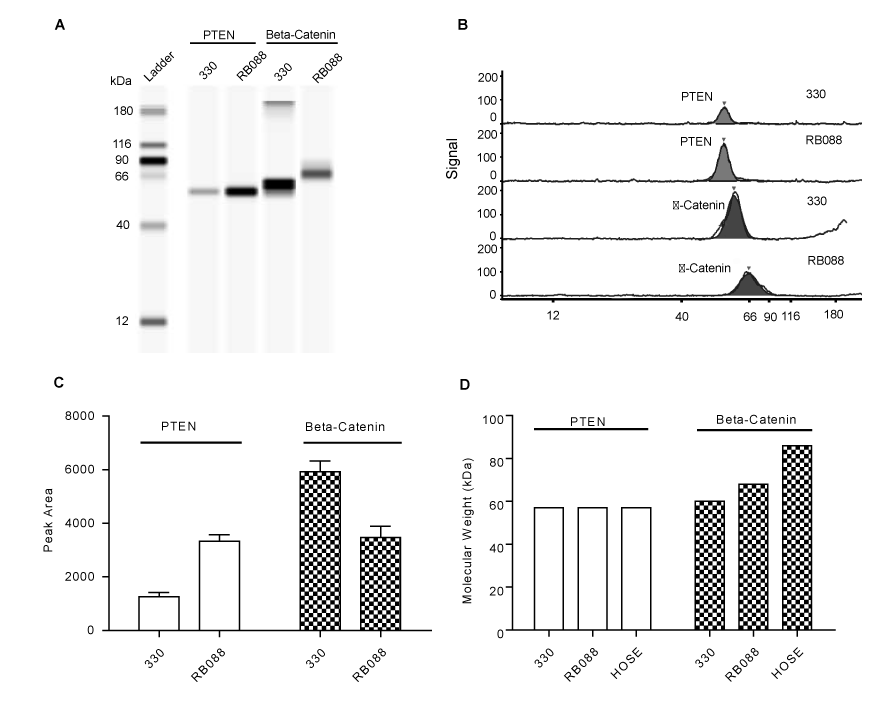
| Figure 6: The expression profiles of oncogenes β-catenin and PTEN in clinic ovarian cancer patient’s tissue determined by Simple Western size assay. The lane view (A) and system software generated electropherogram (B), expression peak area (C) and molecular weight (D) analysis for the oncogene expression pattern in clinic patient tissue lysates 330 and RB088. |