 |
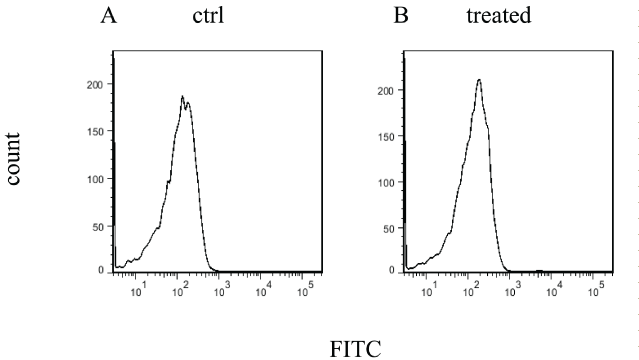
| Figure 4: Histograms are showing the comparison of antibodies present in the plasma of treated vs. control mice binding to the EMHVs as detected by flow cytometry, following incubation with anti-mouse FITC-conjugated secondary antibodies. Histograms are representative of results obtained with plasma of C57BL/6 mice that were not injected [untreated (A) (ctrl)] or injected with murine EMHVs [treated (B)]. |