 |
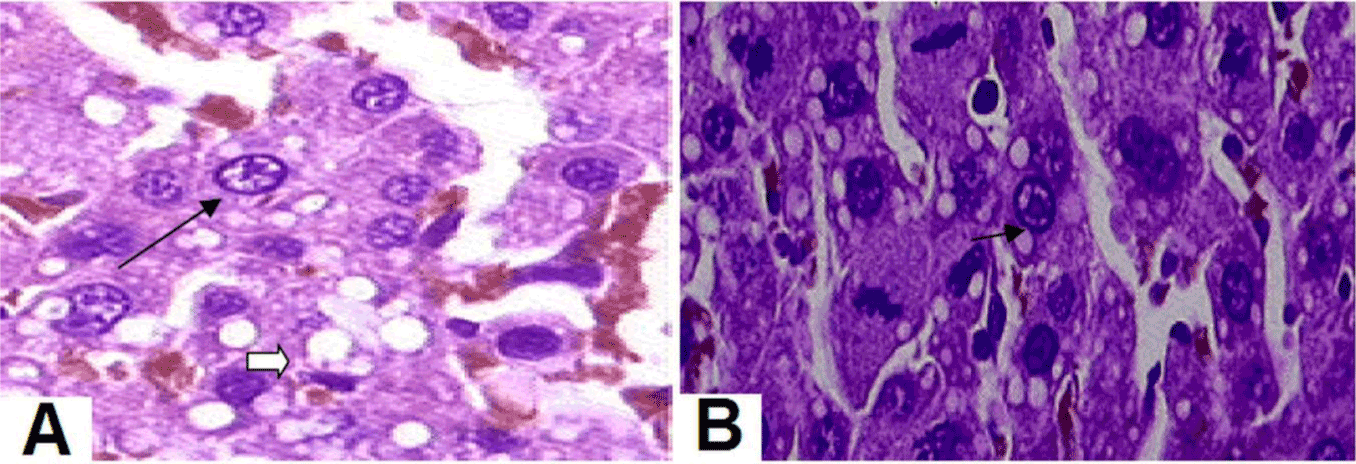
| Figure 2a: A) Hepatic cortex of control rat, the arrow indicates the nucleus of the cell and accumulation of light lipids in its neighborhood. B) Hepatic cortex of experimental rat treated with 800μg/ml of extract of Q. amara in drinking water after 90 days of exposure. The arrow indicates the comparison with the light accumulation of lipids near the normal control cell. No abnormality in the histoarchitecture of the liver tissue can be seen (H & E section 400x). |