 |
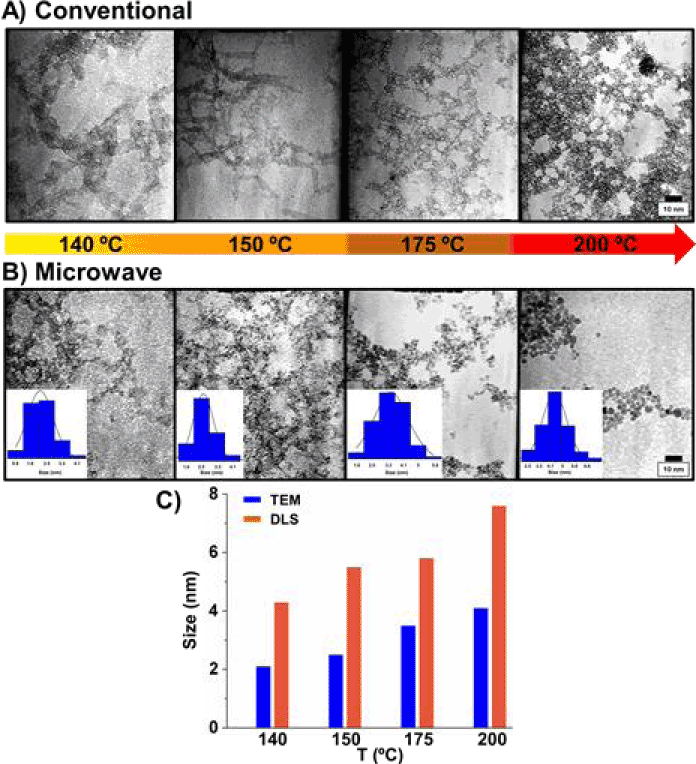
| Figure 1: TEM images of the products of reactions carried out at different temperatures for 15 minutes using A) conventional and B) microwave heating, C) TEM (blue) versus DLS (orange) size measurements of the microwaveproduced nanoparticles. B inset/size distribution of the particles produced under microwave heating at different temperature for 15 minutes. |