 |
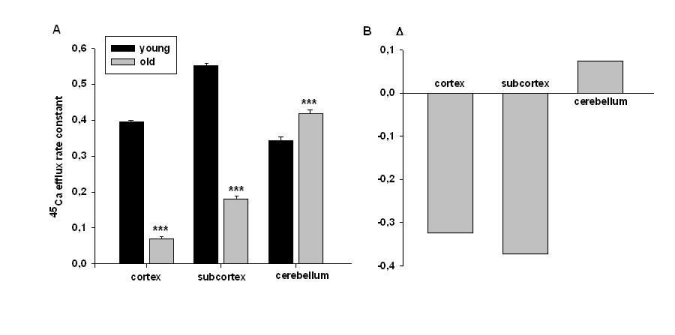
| Figure 6: Rate constant of 45Ca2+ efflux from cortex, subcortex and cerebellum tissues in young and old animals (A). On B the difference (Δ) between mean values of 45Ca2+ efflux in young and old animal groups is shown. Error bars indicate the standard error of the mean (SEM) for three independent experiments. The symbol (***) indicates P<0.001. |