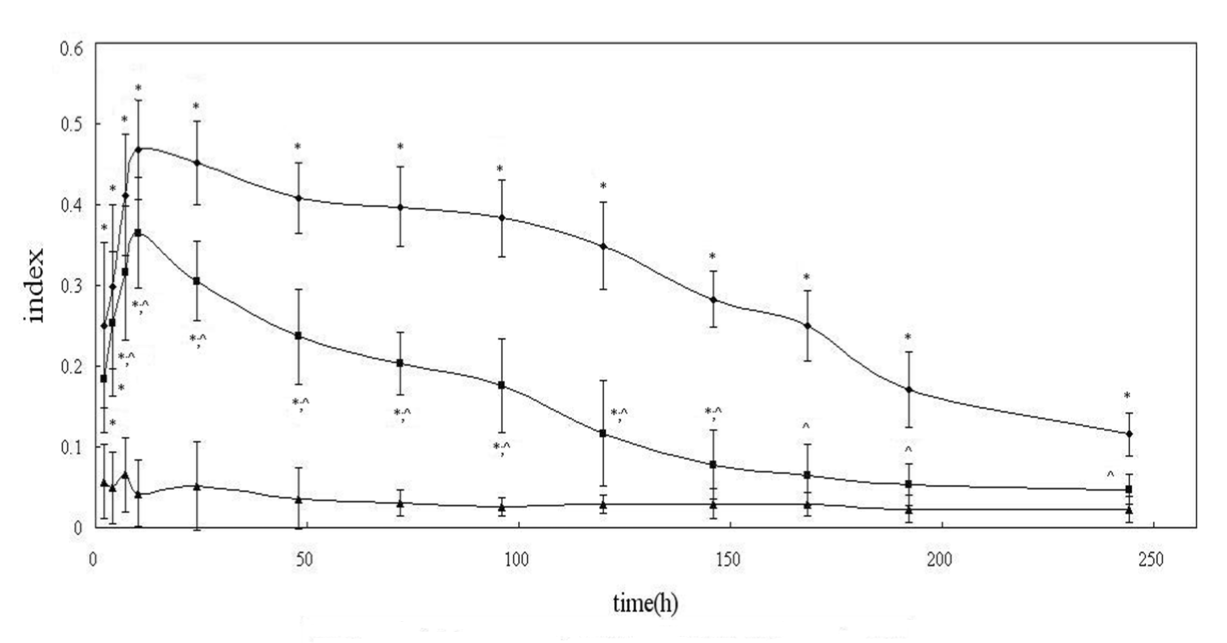
 |
| Figure 1: Effect of acupuncture on MSU crystal-induced ankle edema in rats. Group I: the model group; Group II: the acupuncture group; Group III: the control group. Values are expressed as mean ± SD (n=5). Symbols * and ^ represent statistical significance at: p<0.05. Comparisons are made with a: *, represent Group I vs. Groups III, b: *, represent Group II vs. Groups III, c: ^, represent Group II vs. Groups I. Statistical analysis was calculated by one way ANOVA followed by Student’s Newman–Keul’s test. |