 |
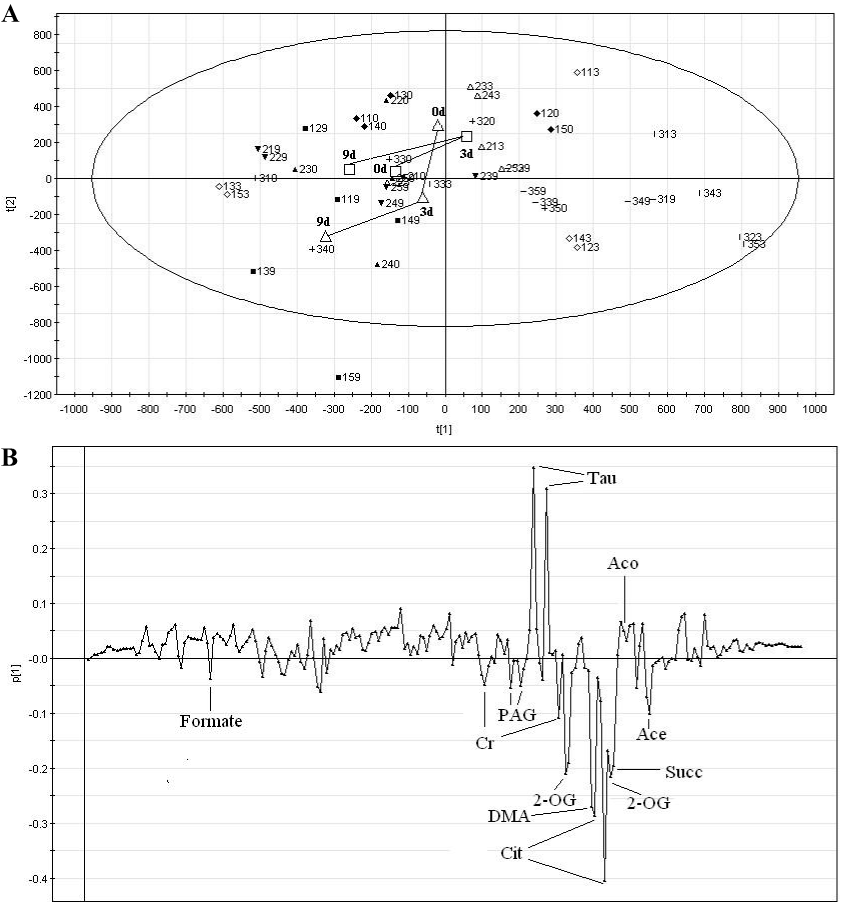
| Figure 3: OSC-PCA scores (A) and loadings (B) plots based on 1H NMR spectra of urine samples, before MSU injection (0d), 3 days after MSU injection (3d), and 9 days after MSU injection (9d), from the control group (0d, cross; 3d, vertical line; 9d, horizontal line; n=5) and the model group (0d, triangle; 3d, open triangle; 9d, inverted triangle; n=5), and the acupuncture group (0d, diamond; 3d, open diamond; 9d, box; n=5). First two PCs were calculated with explanation of 46.5% of total variances. Ellipses represent means ±SD for the various groups. −Δ−, metabolic trajectory from the model group, −□−, metabolic trajectory from the acupuncture group. Ace, acetate; Aco, acetoacetate; Cit, citrate; Cr, creatine; Lac, lactate; 2-OG, O-acetylcarnitine; Succ, succinate; PAG, phenylacetylglycine; Tau, taurine. |