| Research Article |
Open Access |
|
| Vandana Dhaka, Neelam Gulia and B. S. Khatkar* |
| Department of Food Technology, Guru Jambheshwar University of Science and Technology, Hisar-125001, India |
| *Corresponding authors: |
B. S. Khatkar
Professor, Department of Food Technology
G. J. University of Science and Technology
Hisar-125001, India
Tel: +91-1662- 263313
Fax: +91-1662-263313
E-mail: bhup2009@hotmail.com |
|
| |
| Received February 21, 2012; Published July 24, 2012 |
| |
| Citation: Dhaka V, Gulia N, Khatkar BS (2012) Application of Mixolab to Assess the Bread Making Quality of Wheat Varieties. 1: 183. doi:10.4172/scientificreports.183 |
| |
| Copyright: © 2012 Dhaka V, et al. This is an open-access article distributed under the terms of the Creative Commons Attribution License, which permits unrestricted use, distribution, and reproduction in any medium, provided the original author and source are credited. |
| |
| Abstract |
| |
| Wheat is the leading cereal produced, consumed and traded in the world. Various quality tests are carried out to evaluate the bread making potential of a wheat variety, but these tests are time consuming and/ or labour intensive. A new instrument mixolab has been developed which has the capability to measure the dough properties and the pasting behaviour of flour at the same time. Hence, in the present research mixolab was used to assess bread making potential of diverse wheat varieties. The specific loaf volume (SLV) was significantly correlated with mixolab dough development time (DDT) (r2=0.880), dough stability (r2=0.942), C2 (r2=0.890) and glutenin/ gliadin ratio (r2=0.802) indicating the dependence of SLV on protein quality. Stepwise multiple regression was used to find prediction equation for bread quality (SLV) in terms of dough stability and C2 which showed a high multiple correlation coefficient of 0.911 for SLV. With the help of prediction equation it was concluded that the dough stability and C2 are the promising parameters of mixolab to predict the bread making quality of wheat varieties. |
| |
| Keywords |
| |
| Rheological properties; Bread making quality; Mixolab; Specific loaf volume |
| |
| Introduction |
| |
| Various quality tests are carried out to evaluate the bread making potential of a wheat variety. Baking test has been found to be one of the most reliable methods for assessment of the bread making quality of wheat flour. However, this test is time consuming and labour intensive. Simpler and rapid indirect tests, such as the SDS sedimentation volume, have been devised and widely adopted, but it does not always differentiate effectively wheats of medium strong quality [1]. Hence, other methods are needed to test the suitability of flours in terms of bread making quality in a shorter period of time. The determination of rheological properties of wheat flour dough is essential for the successful manufacturing of bread because they affect the behaviour of dough during mechanical handling, thereby influencing the quality of the finished product [2,3]. |
| |
| Mixolab is a new instrument; the information related to its utilization on different aspects of wheat flour quality is quite limited. Angioloni and Collar [4] used mixolab to explore the significance of structuring/ prebiotic blends on bread dough rheological performance during various stages of bread making simulation. Abdel et al. [5], Huang et al. [6] and Jia et al. [7] also used mixolab to determine the effects of cumin and ginger as antioxidants on dough mixing properties and cookie quality, effect of transglutaminase on mixolab thermomechanical characteristics of oat dough and to study the effect of almond skin flour on dough rheology and texture of cookies, respectively. It was also used for the evaluation of pasta making quality of wheats [8] and to investigate the effects of hydrocolloids [9] and flax seed on the rheological properties of dough [10]. Kahraman et al. [11] and Ozturk et al. [12] tested the possibility of using mixolab to predict the cake baking and cookie quality of different wheat flours, respectively. Bonet et al. [13] investigated the effectiveness of transglutaminase for the formation of heteropolymers of wheat and wheat exogenous proteins using mixolab. Pena et al. [14] found that the mixolab dough development time, stability, and breakdown parameters showed high correlation with the dough strength parameters of the alveograph when testing the whole grain flour. However, there are limited numbers of studies related to the application of mixolab to evaluate the bread making quality of wheat varieties. |
| |
| In the present study, mixolab was used with baking test to evaluate the bread making potential of wheat flours obtained from diverse wheat varieties. Mixolab was selected for this study because while carrying out rheological tests, the dough can be heated up to 90°C, and then recooled if desired. This function makes the mixolab unique, by allowing through a single test to obtain information on water absorption capacity and kneading stability, as well as gelatinization temperature, amylase activity and starch retrogradation. This information can thus be used for a better understanding of the bread making potential of flours. |
| |
| Materials and Methods |
| |
| Raw material |
| |
| Grains of fifteen wheat varieties used in this study were obtained from different wheat research stations and agriculture universities. These varieties were selected mainly on the basis of their wide diversity for bread making performances. The grains were cleaned manually to remove soil particles, brokens and foreign seeds. Grain length and breadth was measured by using vernier calliper. Thousand Kernel Weight (TKW) was determined by measuring the weight of 100 seeds and multiplying the weight obtained by a factor of 10. Hectolitre weight (HLW) was determined using Aqua TR. Wheat varieties were tempered to 15.5% moisture content for 48 h. Extra moisture was added 30 min prior to milling. The grains of individual varieties were milled on a Chopin (Model, CD 1) laboratory mill into flour after tempering. |
| |
| Analyses of wheat flour |
| |
| The flour samples of all the wheat varieties were analysed for moisture, protein, ash, falling number, wet gluten (WG), dry gluten (DG) and gluten index (GI). These were determined according to standard AACC methods. The sodium dodecyl sulphate (SDS) sedimentation volumes of flour samples were estimated according to the method of Axford et al. [15] Damaged starch contents of the flour samples were determined using an amperometric method (SD-Matic, Chopin Technologies, Villeneuve la Garenne, France) which provides results in AACC units. Triplicate measurements were carried out for the chemical analysis and the results were averaged. |
| |
| Modified Osborne [16] method was used to separate gluten into gliadins and glutenin. Gluten was separated from the flours by hand kneading the dough in distilled water followed by manual washing at a temperature of 15ºC. The gluten was then freeze-dried and ground to a uniform powder. Freeze dried gluten powder (50 g) was suspended in 1 L of 70% (v/v) ethanol and stirred on magnetic stirrer for 3 h at room temperature (~22°C) followed by centrifugation at 1000x g for 30 min in cooling centrifuge at 4°C. The extraction was repeated. The precipitant was collected as glutenin and the supernatant was subjected to rotary evaporator at 30°C to remove ethanol to get the gliadins. |
| |
| Rheological Tests |
| |
| Mixolab determines a comprehensive qualitative profile of the wheat flour and plots, in real time, the torque (expressed in Nm) produced by the passage of the dough between two kneading arms when submitted to both shear stress and a temperature constraint. |
| |
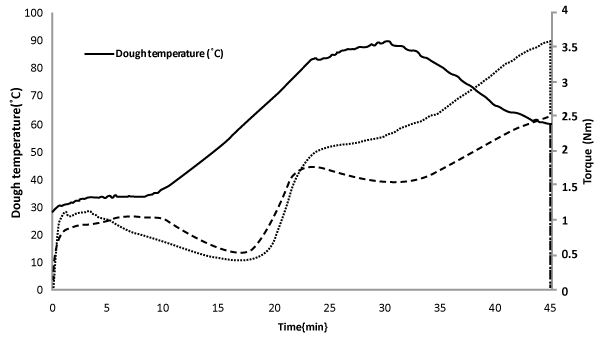
| Chopin+protocol. Mixolab curve of two wheat varieties are shown in (Figure 1). The parameters that are obtained from the curve are water absorption (%) or the percentage of water required for the dough to produce a torque of 1.1±0.05 Nm; dough development time (min) or the time to reach the maximum torque at 30°C; dough stability (min) or the elapsed time at which the torque produced is kept at 1.1 Nm; mechanical weakening (Nm) or the torque difference between the maximum torque at 30°C and the torque at the end of the holding time at 30 °C; minimum torque (Nm) or the minimum value of torque produced by dough passage while being subjected to mechanical and thermal constraints; thermal weakening (Nm) or the difference between the torque at the end of the holding time at 30°C and the minimum torque; peak torque (Nm) or the maximum torque produced during the heating stage; cooking stability (Nm), which is calculated as the ratio of the torque after the holding time at 90°C and the maximum torque during the heating period; and setback (Nm), which is defined as the difference between the torque produced after cooling at 50°C and the torque after the heating period [6]. |
| |
|
|
Figure 1: Mixolab curves of extra strong (---- HI 977) and weak (..... PBW 373) bread making wheat varieties. |
|
| |
| Key parameters derived from the mixolab curve are dough development (C1), protein weakening i.e. decrease in dough consistency due to excessive mixing (C2), starch gelatinization i.e. starch granules swell and absorb water and amylose molecules leach out resulting in an increase in the viscosity (C3), amylase activity (C4), and starch gelling (C5). |
| |
| Chopin S protocol. This protocol allows converting the mixolab data into farinograph data. Parameters concerned being capacity for absorption of water, the time of development, dough stability and softening. |
| |
| Deformation Mechanical Test |
| |
| Uniaxial extensibility of gluten of different wheat varieties was assessed by the Kieffer dough and gluten extensibility rig developed by Stable Micro Systems for the TA-XT plus Texture Analyser. Gluten was extracted from the standard procedure and was rolled into a cylindrical shape and placed over three or four channels of the Teflon coated block. Prior to the placement of gluten, the Teflon-coated block was prepared by placing non adhesive Teflon strips which were coated with silicon oil in the channels. Once the gluten was placed in the Teflon-coated block, the upper half of the block was placed in position and tightly clamped, which distributed the gluten over three to four channels, to yield gluten strips of uniform geometry. The gluten was rested for 40 min at 25°C prior to the test. The gluten strips were then separated from the Teflon strips, positioned across the Kieffer rig dough holder, and immediately tested on the TA.XT plus at a hook speed of 3.3 mm/s and a trigger force of 1g [17]. The resistance to extension (g) and extensibility (mm) were determined in tension mode by recording the peak force and the distance at the maximum and the extension limit. |
| |
| Bread Making and Quality Evaluation |
| |
| The bread making performances of wheat flours were determined using the procedure described by Finney [18] with little modifications. The baking formula was: flour (100 g, 14% moisture basis), compressed yeast (5.3g), salt (1.5g), sugar (6.0g), fat (3.0g), malted barley flour (0.075g) and ascorbic acid (100 ppm, flour basis). Salt, sugar, ascorbic acid and yeast were added in solution form. Yeast was added as a suspension, which was mixed well each time before dispensing. Doughs were mixed in farinograph (100 g capacity). Water absorption and the development time were determined using the Chopin S protocol of Mixolab. Additional 2 ml water was added and mixing time with 1 min longer than Chopin S peak dough development time was used for baking. |
| |
| After mixing, doughs were placed in bowls, and covered with a wet muslin cloth and fermented for 90 min at 35°C and 98% RH. Doughs were moulded after 52, 77 and 90 min in dough moulder. After the final moulding, the dough was divided into four equal proportion and placed in lightly greased tins (internal dimensions for 30 g bread pan: bottom, 24.6 x 52.8 mm; top, 32.1 x 61.2 mm; height, 23.5 mm) and proved for 36 min at 35 °C and 98% RH. After adequate proving, doughs were baked for 13 min at 232 °C. After removing from the oven, loaves were placed on a wire grid for about 2 h for cooling and then weight and volume were determined. Loaf volumes were measured by rapeseed displacement to calculate specific loaf volume by dividing volume of bread by its weight. |
| |
| Statistical Analyses |
| |
| All determinations were made at least in triplicate. Data were assessed by correlation and principal component analysis (PCA). Correlations between the mixolab parameters and flour quality characteristics (like protein, wet gluten content, dry gluten content, gluten index, damaged starch, falling no, sodium dodecyl sulphate (SDS) sedimentation volumes mixolab parameters as well as bread quality characteristics (specific volume, loaf volume and bread firmness) were determined. The PCA technique was included because of its ability to reduce the complexity of data sets to a small number of independent (orthogonal) principal components representing linear combinations of the original variables. This approach allows an assessment of the association between groups of variables and a more basic understanding of the primary components contributing to the underlying variability of a data set. |
| |
| Data was analysed using SPSS software and Microsoft Office Excel 2007. Means and standard error were derived with Microsoft Office Excel 2007 whereas correlation between various parameters were assessed by Pearson’s test (*,** significant levels at p<0.01 and p<0.05) in all cases using SPSS software. |
| |
| Results and Discussion |
| |
| Grain Quality |
| |
| Thousand kernel weight (TKW) of all the wheat varieties was recorded. TKW is a useful tool for the assessment of the potential milling yield. The kernel size contributes directly towards the improvement of grain yield as well as milling yield. The data shows that the variety PBW 443 had minimum TKW (26.3g), while the maximum value (49.67g) was observed for the variety HI 977. The present study suggests that the wheat varieties possessing better grain weight offers great potential for better milling yield and wide variation in grain weight can be exploited by the wheat breeders to improve this trait in the new genotypes. Hectolitre weight (HLW) depends on the shape, size and soundness of grains and should be more than 76 kg/l for industrial use. It represented a wide range from minimum 68.33 kg/l to maximum 85.37 kg/l with the average value of 77.9 kg/l (Table 1). The difference in the HLW may be attributed to the difference in climatic conditions, cropping practices and genetic makeup of the varieties. |
| |
|
|
Table 1: Grain and flour quality parameters of wheat varieties. |
|
| |
| Flour Quality |
| |
| The protein content of wheat varieties in this study ranged from 8.61 to 14.7% with an average value of 12.22% (Table 1). Flours suitable for bread making are those made from hard wheat and have high protein content in the range of 11 to 14% [17]. The highest protein content was noted in HI 977 and lowest in HW 2004. Protein content and composition of wheat is the most important criteria in determination of wheat quality [19]. Protein content is a character determining water absorbing ability, dough stability, dough resistance and elasticity. The importance of protein content also lies in the ability of gluten to produce dough with the desired rheological properties. Moreover, higher amount of good quality protein is required for gas retention and dough rise during fermentation or early stages of baking of bread. Protein content was significantly correlated with the SDS sedimentation value (r2=0.622). A similar correlation coefficient between protein content and SDS sedimentation value had been reported by Faergestad et al. [20] As expected, the flour protein content was found to be correlated with specific loaf volume of bread (r2=0.601). |
| |
| Highly significant differences were noticed in respect of SDS sedimentation volume in wheat varieties (Table 1). Sedimentation values varied from 31.3 to 62.0ml. Highest sedimentation volume was observed in wheat variety HI 977 (62.0ml), whereas wheat variety PBW 373 exhibited the lowest SDS sedimentation volume (31.3ml). SDS sedimentation volume is one of the most important test used to discriminate wheat genotypes based on their gluten quality and quantity [21]. On the basis of SDS sedimentation test, wheat variety HI 977 could be classified as very good bread making variety and the varieties PBW 373 and HW 2004 could be classified as being poor bread making quality, with the remaining varieties possessing good bread making quality. SDS sedimentation volume was significantly positively correlated (r2=0.829) with specific loaf volume of bread. Similar results were reported by other researchers [15,22-29]. There has been evidence to suggest that the SDS sedimentation test singularly gives the best prediction of bread baking potential and strength for hard wheat [28,30]. In the past few years the SDS sedimentation test has been investigated on different wheat types in numerous studies and countries [31-35]. It has gained wide acceptance as a useful, smallscale test in bread wheat breeding programs to give a good indication of differences in both protein content and gluten quality, the two most important factors influencing bread baking quality [15,21,23] especially in genotypes with a protein content up to approximately 13%, where high SDS sedimentation volume has been associated with stronger gluten and good quality [21]. The SDS sedimentation volume was also positively correlated with the gluten index and R/E ratio of gluten. |
| |
| The gluten proteins impart unique bread making properties to wheat. Wheat varieties varied significantly (P<0.05) for their wet and dry gluten contents as shown in (Table 1). The values for WG ranged from 21.6 to 35.5%. The highest amount of WG was found in straight grade flour of wheat variety WH 711, whereas the lowest was found in PBW 373. The mean values for dry gluten (DG) ranged from 8.4 to 12.4%.Wheat variety HW 2004 showed the lowest dry gluten content (DG) i.e. 8.37% whereas variety C 306 reported the highest 12.43%. A significant positive correlation (r2=0.948) was observed between wet gluten and dry gluten content. |
| |
| R/E ratio of gluten affects dough structure. During the proofing and baking stages, dough should be sufficiently extensible to enlarge in response to gas pressure, yet strong enough to resist collapse of gas cells to produce a loaf with large volume. R/E ratio of the gluten of different wheat varieties ranged from 0.41 and 1.49. Varieties HI 977 and DBW 16 exhibited the higher R/E ratio (1.5 each). The lower R/E ratio was recorded for varieties C 306 i.e 0.41. Several authors have also highlighted the need to assess dough extensibility when screening for end-use quality among wheat breeding lines [36-39]. |
| |
| The mixolab curves for two wheat varieties (extra strong and weak variety) are presented in (Figure 1) to illustrate the nature of the curves obtained, and all the mixolab results are summarised in Table 2. The strength of each wheat variety could be adjudged from the mixolab data on the basis of dough development time (DDT), dough stability and C2. Wheat varieties HI 977, DBW 16 and PBW 550 exhibited the characteristics of extra strong wheat varieties with longer DDT (8.47- 7.46 min), higher dough stability (10.7-9.5 min) and good quality proteins represented by C2 (0.6-0.5 Nm). In a study reported by Lundh and MacRitchie [40], differences in DDT between excellent bread making quality wheat and moderately good bread making quality wheat were attributed to difference in proportion of glutenin. Similarly in the present study the DDT showed a very strong relationship with glutenin/ gliadin ratio (r2=0.800). High dough stability values are usually related to the strength of flours [41]. Wheat varieties HW 2004 and PBW 373 in contrast, were weak as they developed quickly, with low dough stability (≤ 4 min) and C2 values less than 0.4 Nm, indicating that these dough’s were less tolerant to mixing as compared to the other wheat varieties. |
| |
| |
|
|
Table 2: Mixolab parameters of Chopin + protocol of flours of different wheat varieties. |
|
| |
| Bread Quality |
| |
| The wheat varieties used in this study varied in flour and dough mixolab properties, therefore, bread produced differed in the specific loaf volume (SLV) and bread firmness (Table 1). Wheat variety HI 977 yielded the highest SLV of bread compared with the others varieties. HI 977 had highest SDS volume and gluten index. Also, good SLV but significantly lower than that of variety HI 977 was obtained when bread was produced from DBW 16, WH 542 and PBW 550 wheat varieties. The poor SLV of bread was achieved when using flour from wheat variety C 306. It has long been known that the protein content of flour has a direct effect on the volume of bread produced with it, within wide protein range. However, when the protein range of samples is narrow, protein percentage does not clearly discriminate wheats for end use quality. |
| |
| Correlations were determined between mixolab parameters and bread quality parameters to identify the mixolab parameters which can demonstrate the suitability of mixolab for estimating bread making quality of the flour samples (Table 4). It is noteworthy that the specific loaf volume had highest correlation with C2 among the mixolab parameters followed by DDT and dough stability. R/E also exhibited a significant correlation with the specific loaf volume. The results were in concordance with Dobraszczyk and Salmanowicz [42] who reported that the resistance to extension measured with Kieffer Rig was highly correlated with loaf volume. Differences in glutenin/ gliadin ratio among wheat varieties have long been considered an important source of inter cultivar variation in physical properties and bread making quality [43,44]. Dynamic rheological study by Khatkar and Schofield [45] reported that gluten- water doughs from poor quality wheat varieties had lower elasticity, which is attributed to glutenins and greater viscosity than those from good quality wheat varieties. It was evident from the results obtained that glutenin/ gliadin ratio was highly correlated with SLV (r2=0.802), the mixolab DDT (r2=0.834), dough stability (r2=0.832), C2 (r2=0.735), and gluten strength parameters including SDS (r2=0.708), GI (r2=0.762), and R/E (r2=0.684). |
| |
| In this study, wheat varieties having subunits 2+12 at Glu- D1 had weaker doughs and lower SLV. However, some wheat varieties such as WH 283, WH 147 although having subunits 2+12 produced strong doughs with good SLV (Table 1). Another noteworthy observation was that wheat varieties PBW 343 and PBW 373 (Glu-1 score 9) both having same HMWGS composition 1, 7+9 and 5+10, but PBW 373 produced weaker dough (confirmed by mixolab as well as gluten quality parameters) and poor SLV, which may be attributed to its low glutenin/ gliadin ratio of 0.48 as compared to glutenin/ gliadin ratio of 0.79 in case of variety PBW 343. It was a general observation that varieties with higher Glu-1 score (Table 3) and having high molecular weight subunits (HMWGS) 5+10, 2*, 17+18 and 7+9 were found to have higher SLV while varieties with lower Glu-1 score having HMWGS 2+12, 6+8, 20 or null alleles had inferior bread making quality which is in agreement with the study of Khatkar et al. [46] Taking into consideration the subunit composition of these wheat varieties it was generally observed that the subunits 2*, 17+18, 7+8, 7+9 and 5+10 have a significant effect on the DDT and dough stability, whereas the subunits null, 2+12 and 20 were related to low values of DDT and dough stability which is in agreement with the previous studies reported by Khatkar et al.[1], Gupta and Mac Ritchie [47], Dong et al. [48]. |
| |
|
|
Table 3: High Molecular Weight Glutenin Subunit Composition and Glu- 1 scores of different wheat varieties. |
|
| |
|
|
Table 4: Correlation coefficient among Mixolab parameters and other quality attributes. |
|
| |
| As a conclusion, good bread making varieties should have higher values of DDT, dough stability, C2, R/E ratio and glutenin/ gliadin ratio which is logical since these parameters specify the importance of protein quality of the wheat flour. |
| |
| Principal Component Analysis |
| |
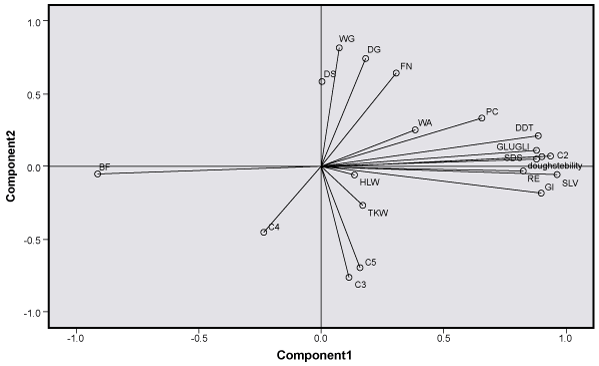
| The relationships among the quality parameters measured for 15 wheat samples were evaluated by PCA to determine the source of the underlying variability. For dough strength, the first four principal components accounted for 81.7% of the variability in terms of baking, and flour protein parameters (Table 5). PCA of quality attributes of wheat flour showed that 59.1% of the variations could be explained by the first two principal components (PCs). The loading plot of the PCs is shown in M (Figure 2). |
| |
|
|
Table 5: Principal component analysis of flour quality characteristicsa. |
|
| |
|
|
Figure 2: Principal component analysis of various physicochemical parameters of wheat varieties |
|
| |
| The first principal component, representing 41.7% of the variability, was positively related to the mixolab parameters, flour protein quality, SLV and negatively related with bread firmness, as indicated by loading factors of 0.80 or higher. This result is consistent with the highly significant correlations among baking parameters and their close relationship to protein quality discussed above. Protein content also contributed to the first principal component with loading factor of 0.600. Protein content was also found closely associated with glutenin/ gliadin ratio having correlation coefficients of 0.551 as shown in Table 4. The second principal component accounted for 17.4% of the variability. High loading factors were obtained for wet and dry gluten contents. The third principal component represented 13.6% of the variability. Very high loading factors were obtained for damaged starch and C3, which contributed to the third principal component. Fourth principal component explained 9.0% variability and the major contributing factor was HLW. |
| |
| Correlation of Mixolab Parameters with Other Quality Parameters |
| |
| Correlation coefficients among the mixolab parameters and other flour quality parameters such as protein content, SDS, gluten index etc are given in (Table 3). As expected protein content showed positive correlations with C2, dough stability and DDT indicating a strong influence of flour protein on the flour quality parameters. |
| |
| SDS sedimentation volume, which has previously been used to predict or assess dough strength and baking quality [2,49] gave significant positive correlations with mixolab dough stability and C2 which are indicative of dough strength or gluten strength [11,12,50]. The results obtained were also in agreement with the observations of Banu et al. [51] who had indicated a significant correlation between the SDS sedimentation volume and C1, C3, C4 and C5. From the correlation matrix it was also concluded that that GI had a very strong positive association with dough stability, C2 and DDT. These results are in agreement with Collar et al. [52] who also reported correlation between mixolab dough stability, C2 and gluten index. This implies that the varieties with higher values of SDS sedimentation volume and GI will also have higher dough stability, DDT and C2 values. R/E ratio of gluten also exhibited a good correlation with the above mentioned three mixolab parameters. Damaged starch was negatively correlated with peak viscosity C3 and C5 (retrogradation). The inverse relation of damaged starch with peak viscosity during pasting by using Rapid Visco Analyser and Differential Scanning Calorimetry (corresponding to C3 of mixolab) and with bread staling (C5 of mixolab) has also been demonstrated in previous studies [53]. This is presumably because of the differences in the protein composition in these varieties which could affect the pasting viscosity [54]. |
| |
| From the above discussion it can be concluded that several factors such as mixolab C2, dough stability, DDT values, protein, GI, SDS sedimentation value are predominantly linked to specific loaf volume of bread. For an assessment of the influence of mixolab factors on specific loaf volume stepwise multiple regression was used to find equation that better predicted the relationship between mixolab quality parameters and SLV. Specific loaf volume (SLV) = 2.37+1.87(C2) + 0.078 (Dough stability). |
| |
| Prediction equation of bread quality in terms of SLV, showed a high multiple correlation coefficient for SLV (r2=0.911) which seems to be highly useful to predict the bread making quality of wheat flours. From the above prediction equation it can be concluded that the dough stability and C2 parameters of mixolab have potential to predict the bread making quality of wheat varieties. Dough stability and C2 indirectly refer the protein quality of wheat flour which is in accordance with the other studies mentioned in this paper. |
| |
| Manthey et al. [8] evaluated the rheological and gelatinization properties of durum wheat’s grown in the United States with mixolab. Their results showed variability in terms of protein quality and starch pasting properties, which indicated that mixolab could be used to determine durum wheat quality. Pena et al. [14] found that the mixolab dough development time, dough stability, and breakdown parameters showed high correlation with the Alveograph W value when testing the whole grain flour. Kahraman et al. [11] and Ozturk et al. [12] also used mixolab to predict the cookie quality and cake quality, respectively. However, the studies related to the application of mixolab to predict the bread making quality of flours are limited. |
| |
| Overall results from this study suggest that mixolab has potential to be used for selection of superior bread wheats, based on higher dough stability, C2 and DDT values. This would favour genotypes with higher SDS sedimentation volume, GI and glutenin/ gliadin ratio. Further work is required to expand the information obtained in the present study by using different wheat varieties with a wider range of protein quality and quantity characteristics. |
| |
| Conclusions |
| |
| The mixolab, on the basis of the results depicted in this paper proved to be a simple and an effective instrument for evaluating flour and gluten protein quality thus enabling the wheat breeders to assess wheat quality more effectively and timely in the breeding programme. It was able to generate a correlation between SDS sedimentation volume, gluten index, gluten extensibility, glutenin/ gliadin ratio and specific loaf volume of bread. However, in this study, pasting properties had little relationship with baking quality parameters. With regard to bread making quality, mixolab C2, dough stability and DDT were found to be highly associated with specific loaf volume. The tests conceded with the help of mixolab are more rapid as the results can be obtained within 45 minutes explaining both, the protein as well as starch characteristics at the same time and with no shortcomings. It is alluring that, mixolab can be used as a substitute to other quality tests to envisage the protein and starch properties, as well as an efficient instrument to predict the bread making quality of wheat flours based on dough stability and C2 values. However, much more detailed work is required to expand the information obtained in the present study using a large number of wheat varieties grown in different locations as well as site to site variation within variety. |
| |
| Acknowledgements |
| |
| Authors Vandana Dhaka and Neelam Gulia are grateful for the award of Sir C.V Raman scholarship from the Department of Technical Education, Haryana, India. |
| |
| |
| References |
| |
- Khatkar BS, Bell AE, Schofield JD (1996) A comparative study of the inter- relationships between mixograph parameters and bread making qualities of wheat flours and glutens. J Sci Food Agric 72: 71-85.
- Khatkar BS, Fido RJ, Tatham AS, Schofield JD (2002) Functional Properties of Wheat Gliadins. I. Effects on Mixing Characteristics and Bread Making Quality. J Cereal Sci 35: 299-306.
- Khatkar BS, Fido RJ, Tatham AS, Schofield JD (2002) Functional properties of wheat gliadins. II. Effects on dynamic rheological properties of wheat gluten. J Cereal Sci 35: 307-313.
- Angioloni A, Collar C (2009) Significance of structuring/ prebiotic blends on bread dough thermo- mechanical profile. Eur Food Res Technol 229: 603-610.
- Abdel-Samie MA, Wan JJ, Huang WN, Chung KO, Xu BC (2010) Effects of cumin and ginger as antioxidants on dough mixing properties and cookie quality. Cereal Chem 87: 454-460.
- Huang WN, Li LL, Wang F, Wan JJ, Tilley M, et al. (2010) Effect of transglutaminase on rheological and mixolab thermomechanical characteristics of oat dough. Food Chem 121: 934-939.
- Jia C, Huang W, Samie MA, Huang G, Huang G (2011) Dough rheological, mixolab mixing, and nutritional characteristics of almond cookies with and without xylanase. J Food Eng 105: 227-232.
- Manthey F, Tulbek MC, Sorenson B (2006) durum wheat with mixolab. Proceedings of AACC International Annual Meeting: World Grain Summit: Foods and Beverages, St Paul, MN:336.
- Rosell CM, Collar C, Haros M (2007) Assessment of hydrocolloid effects on the thermo-mechanical properties of wheat using the mixolab. Food Hydrocolloid 21: 452-462.
- Tulbek MC, Hall C (2006) Mixolab as a tool to investigate the effects of flaxseed on the rheological properties of dough. in Proceedings of AACC International Annual Meeting: World Grain Summit: Foods and Beverages, St Paul, MN:140.
- Kahraman K, Sakiyan O, Ozturk S, Koksel H, Sumnu G, et al. (2008) Utilization of Mixolab to predict the suitability of flours in terms of cake quality. Eur Food Res Technol 227: 565-570.
- Ozturk S, Kahraman K, Tiftik B, Koksel H (2008) Predicting the cookie quality of flours by using Mixolab. Eur Food Res Technol 227: 1549-1554.
- Bonet A, Blaszczak W, Roseli CM (2006) Formation of homopolymers and heteropolymers between wheat flour and several protein sources by transglutaminase-catalyzed cross-linking. Cereal Chem 83: 655-662.
- Pena RJ, Cervantes-Espinoza MI, Ortiz-Monasterio JI, Dubat A (2006) Gluten composition, gluten quality, and dough mixing properties (National-Mixograph; Chopin- Mixolab) of high yielding wheats derived from crosses between common (Triticum aestivum) and synthetic (T. dicoccon × Aegilops tauschii) wheats. Proceedings of the Eucarpia Cereal Section Cereal Science and Technology for Feeding Ten Billion People: Genomics Era and Beyond, Lleida (Spain).
- Axford DWE, McDermott EE, Redman DG (1978) Small scale tests of bread making quality. Mill Feed Fertil 66:18-21.
- Osborne TB (1907) The proteins of the wheat kernel 84: 1-119.
- Ktenioudaki A, Butler F, Gallagher E (2010) Rheological properties and baking quality of wheat varieties from various geographical regions. J Cereal Sci 51: 402-408.
- Finney KF (1984) An optimized, straight dough, bread making method after 44 years. Cereal Chem 61: 20-27.
- Bilgin O, Korkut KZ (2005) Determination of some bread quality and grain yield characters in bread wheat (Triticum aestivum L.) Int J Agric Biol 7: 125-128.
- Faergestad EM, Molteberg EL, Magnus EM (2000) Interrelationships of protein composition, protein level, baking process and the characteristics of hearth bread and pan bread. J Cereal Sci 31: 309-320.
- Carter BP, Morris CF, Anderson JA (1999) Optimizing the SDS sedimentation test for end-use quality selection in a soft white and club wheat-breeding program. Cereal Chem 76: 907-911.
- Blackman JA, Gill AA (1980) A comparison of some small-scale tests for breadmaking quality used in wheat breeding. J Agric Food Chem 95: 29-34.
- De Villiers OT, Laubscher EW (1995) Use of the SDS test to predict the protein content and bread volume of wheat varieties. South African Journal of Plant and Soil 12: 140-142.
- Dexter JE, Matsuo RR, Kosmolak FG, Leisle D, Marchylo BA (1980) The suitability of the SDS-sedimentation test for assessing gluten strength in durum wheat. Can J Plant Sci 60: 25-29.
- Krattiger AF, Law CN (1991) The effects of adding NaCl and 2-mercaptoethanol and of other modifications to the SDS-sedimentation test. In: Bushuk W, Tkachuk R (eds) Gluten Proteins. AACC, St. Paul 156-159.
- Lorenzo A, Kronstad WE (1987) Reliability of two laboratory techniques to predict bread wheat protein quality in non traditional growing areas. Crop Sci 27: 247-252.
- McDermott EE, Redman DG (1977) Small-scale tests of bread making quality. Mill Baking Res Assoc 6: 200-213.
- Moonen JHE, Scheepstra A, Graveland A (1982) Use of the SDS-sedimentation tests and SDS- polyacrylamide gel electrophoresis for screening breeder’s samples of wheat for bread-making quality. Euphytica 31: 677-690.
- Pickney AJ, Greenaway WT, Zeleny L (1957) Further developments in the sedimentation test for wheat quality. Cereal Chem 34: 16-24.
- Greenaway WT, Hurst NS, Neustadt MH, Zeleny L (1966) Micro sedimentation test for wheat. Cereal Sci Today 11: 197-199.
- Axford DW, McDermott EE, Redman DG (1979) Note on the sodium dodecyl sulphate test of bread making quality: Comparison with Pelshenke and Zeleny tests. Cereal Chem 56: 582-584.
- Matuz J (1998) Inheritance of SDS sedimentation volume of flour in crosses of winter wheat (Triticum aestivum L.). Cereal Res Commun 26: 203-210.
- Morris CF, Paszczynska B, Bettge A, King GE (2007) A critical examination of sodium dodecyl sulfate (SDS) sedimentation test for wheat meals. J Sci Food Agric 87: 607-615.
- O'Brien L, Ronalds JA (1979) Heritabilities of small-scale and standard measures of wheat quality for early generation selection. Aust J Agric Res 38: 801-808.
- Takata K, Yamauchi H, Nishio Z, Kuwabara T (2001) Prediction of bread-making quality by prolonged swelling SDS-sedimentation test. Breeding Sci 49: 221-223.
- Anderssen RS, Bekes F, Gras PW, Nikolov A, Wood JT (2004) Wheat-flour dough extensibility as a discriminator for wheat varieties. J Cereal Sci 39: 195-203.
- Nash D, Lanning SP, Fox P, Martin JM, Blake NK, et al. (2006) Relationship of dough extensibility to dough strength in a spring wheat cross. Cereal Chem 83: 255-258.
- Suchy J, Lukow OM, Ingelin ME (2000) Dough microextensibility method using a 2-g mixograph and a texture analyzer. Cereal Chem 77: 39-43.
- Treml MC, Glover KD, Krishnan PG, Hareland GA, Bondalapati KD, et al. (2006) Effect of wheat genotype and environment on relationships between dough extensibility and breadmaking quality. Cereal Chem 88: 201-208.
- Lundh G, MacRitchie F (1989) Size exclusion HPLC characterisation of gluten protein fractions varying in bread making potential. J Cereal Sci 10: 247-253.
- Moreira R, Chenlo F, Torres MD (2011) Effect of sodium chloride, sucrose and chestnut starch on rheological properties of chestnut flour doughs. Food Hydrocolloid 25: 1041-1050.
- Dobraszczyk BJ, Salmanowicz BP (2011) Comparison of predictions of baking volume using large deformation rheological properties. J Cereal Sci 47: 292-301.
- Kasarda DD (1994) Glutenin structure in relation to wheat quality. In: Pomeranz Y (ed) Wheat is Unique. AACC, St. Paul, Manhatten 73-106.
- Schofield JD (1994) Wheat proteins: Structure and functionality in milling and bread making. In: Bushuk W, Rasper V (eds) Wheat: Production, Composition and Utilisation. Blackie Academic and Professional, Glasgow 73-106.
- Khatkar BS, Schofield JD (2002) Dynamic rheology of wheat flour dough. I. Non-linear viscoelastic behaviour. J Sci Food Agric 82: 827-829.
- Khatkar BS (2006) Effects of high Mr glutenin subunits on dynamic rheological properties and bread making qualities of wheat gluten. J Food Sci Technol 43: 382-387.
- Gupta RB, Paul JG, Cornish GB, Palmer GA, Bekes F, et al. (1994) Allelic variation at glutenin subunit and gliadin loci, Glu- 1, Glu- 3 and Gli- 1 of common wheats I. Its additive and interaction effects on dough properties. J Cereal Sci 19: 9-17.
- Dong H, Sears RG, Hoseney RC, Lookhart GI, Shogren MD (1992) Relationships between protein composition and mixograph and loaf characteristics in wheat. Cereal Chem 69: 132-136.
- Payne PI (1987) Genetics of wheat storage proteins and the effect of allelic variation on bread-making quality. Annu Rev Plant Physiol 38: 141-153.
- Koksel H, Kahraman K, Sanal T, Ozay DS, Dubat A (2009) Potential utilization of mixolab for quality evaluation of bread wheat genotypes. Cereal Chem 86: 522-526.
- Banu I, Stoenescu G, Ionescu V, Aprodu I (2011) Estimation of the baking quality of the wheat flours based on rheological parameters of the mixolab curve. Czech J Food Sci 29: 35-44.
- Collar C, Bollain C, Rosell CM (2007) Rheological behaviour of formulated bread doughs during mixing and heating. Food Sci Technol Int 13: 99-107.
- León A, Barrera G, Pérez G, Ribotta P, Rosell C (2006) Effect of damaged starch levels on flour-thermal behaviour and bread staling. Eur Food Res Technol 224: 187-192.
- Thomas DJ, Atwell WA (1999) Starches. In: Gelatinization, Pasting, and Retrogradation. AACC, St. Paul, Manhatten 25-30.
|
| |
| |