| Research Article |
Open Access |
|
| Oyedepo Sunday Olayinka |
| Mechanical Engineering Department, Covenant University, Ota, Nigeria |
| *Corresponding authors: |
Oyedepo Sunday Olayinka
Mechanical Engineering Department
Covenant University, Ota, Nigeria
E-mail: Sunday.oyedepo@covenantuniversity.edu.ng |
|
| |
| Received December 08, 2011; Published January 06, 2012 |
| |
| Citation: Olayinka OS (2012) Noise Map: Tool for Abating Noise Pollution in Urban Areas. 1: 185. doi:10.4172/scientificreports.185 |
| |
| Copyright: © 2012 Olayinka OS. This is an open-access article distributed under the terms of the Creative Commons Attribution License, which permits unrestricted use, distribution, and reproduction in any medium, provided the original author and source are credited. |
| |
| Abstract |
| |
| This paper presents the results obtained from environmental noise measurements at selected locations in Ilorin metropolis. Forty- two (42) different locations throughout Ilorin were selected to establish background noise level, peak noise level and dominant noise sources at these locations. Noise level measurements and analysis for the locations were based on the noise descriptors LAeq, LD, LN, LDN, TNI and LNP. Based on these noise descriptors, noise map is developed to identify locations with high noise exposure. The noise map developed reveals high noise exposure at the nucleus of the metropolis where commercial activities, high traffic volume and clustered buildings with high population exist. The result of this study shows that the major source of noise in Ilorin metropolis can be attributed to traffic noise. Other intrusive noise sources include noise from record player, electric generators, and hawking with loud speakers. Based on the recommendations of CEOH, WHO and HUD, only 6 locations out of 42 are under normally acceptable situation while the noise levels of other areas are not acceptable. Noting the noise emission standards, the noise map provides enough information for technical controls and interim legislation against environmental noise pollution in the metropolis. The result of this study is useful as reference and guideline for future regulations on noise limit to be implemented for urban areas in Nigeria. |
| |
| Keywords |
| |
| Noise map; Noise pollution; Environment; Traffic noise; Nigeria; Noise descriptors |
| |
| Introduction |
| |
| Noise pollution is a significant environmental problem in many urban areas. This problem has not been properly recognized despite the fact that it is steadily growing in developing countries. Davis and Masten [1] stated three valid reasons as to why widespread recognition of noise pollution problem has not materialized in a similar fashion as have air and water pollution problems. These reasons are summarized in the definition and perception of noise as a subjective experience, short decay time, and difficulty to associate cause with effect when it comes to health impacts. |
| |
| Noise pollution is recognized as a major problem for the quality of life in urban areas all over the world. Because of the increase in the number of cars and industrialization, noise pollution has also increased. Noise in cities, especially along main arteries, has reached up disturbing levels. Residences far from noise sources and near silent secondary roads are currently very popular. People prefer to live in places far from noisy urban areas [2]. |
| |
| In contrast to many other environmental problems, noise pollution continues to grow and is accompanied by an increasing number of complaints from people exposed to the noise. The growth in noise pollution is unsustainable because it involves direct, as well as cumulative, adverse health effects. It also adversely affects future generations, and has socio-cultural, aesthetic and economic effects [3]. The most important factors raising the noise pollution in urban areas include inter alia, vehicular traffic, neighbourhood, electrical appliances, TV and music systems, public address system, railway and air traffic, and generating sets. Even we fall prey to the noise generated by the household equipments used by us [4]. |
| |
| Many surveys addressing the problem of noise pollution in many cities throughout the world have been conducted [5-11], and have shown the scale of discomfort that noise causes in people’s lives [12,13]. Existing evidence indicating that noise pollution may have negative impacts on human health has justified research in order to provide better understanding of noise pollution problems and control [14]. |
| |
| Depending on its duration and volume, the effects of noise on human health and comfort are divided into four categories; physical effects, such as hearing defects; physiological effects, such as increased blood pressure, irregularity of heart rhythms and ulcers; psychological effects, such as disorders, sleeplessness and going to sleep late, irritability and stress; and finally effects on work performance, such as reduction of productivity and misunderstanding what is heard [13,15]. |
| |
| City noise levels can be investigated in three different ways as traffic and transportation; industrial activities; Sport, marketing and entertainment facilities [16]. In comparison to other pollutants, the control of environmental noise has been hampered by insufficient knowledge of its effects on human and lack of defined criteria. Noise pollution is a significant environmental problem in many rapidly urbanizing areas. This problem is properly not recognized despite the fact that it is steadily growing in developing countries. It is well established now that noise is a potential hazard to health, communication and enjoyment of social life. It is becoming an unjustifiable interference imposition upon human comfort, health and quality of life. |
| |
| In Nigeria, the problem of noise pollution is wide spread. Several studies report that noise level in metropolitan cities exceeds specified standard limits. A study by Ugwuanyi et al. [17] conducted in Makurdi, Nigeria found that the noise pollution level in the city was about 3 dB(A) to 10 dB(A) above the recommended upper limit of 82 dB(A). Anomohanran et al, [18] also found that the peak noise level at road junction in Abraka, Nigeria to be 100 dB(A). This noise level is higher than the recommended level of 60 dB(A) for commercial and residential areas. Ighoroje et al. [19] investigated the level of noise pollution in selected industrial locations in Benin City, Nigera. The average ambient noise level in Sawmills, Electro-acoustic market and food processing industrial areas was determined to be above 90 dB(A). This noise level is well above the healthy noise level of 60 dB (A). |
| |
| The noise pollution is not a unique problem for developing countries like Nigeria only. Many researchers have revealed that, more than 130 million people in Europe suffer from exposure to noise levels above 65 dB (A) [20]. Bond [21] reports that 16% of people in Europe are expose to 40 dB(A) or more of traffic noise in their bed rooms at night compare it with WHO’s average estimates of 30 to 35 dB(A) for undisrupted sleep. WHO has proposed the time base guideline for LAeq for 16 h daytime and 8 h night-time. The environmental noise level of 70 dB (A) LAeq, 24 h was recommended by WHO for industrial, commercial, shopping and traffic areas, indoors and outdoors areas to prevent impairments [22]. |
| |
| In Nigeria, there is no legal frame work upon which noise pollution can be abated. Federal Environmental Protection Agency (FEPA) in Nigeria only provided daily noise exposure limits for workers in industry (i.e 90 dB (A) for 8 h exposure).In short, the Nigerian Government and her citizenry appear not to be conscious of the present and future impacts of noise induced health hazards in their environment. Unless and until measures are taken to control the level of noise, the ongoing urbanization and industrialization may complicate the problem so much that it becomes incurable. |
| |
| Noise has always been a major environmental stressor in urban areas. The ability to measure ambient noise levels and represent them on a map should provide a powerful tool for spatially identifying noise sources, its spread, its impact and make decisions relating to its control and management. First step to decrease noise pollution is preparation of noise maps. It is possible to compare the highest noise levels and noise locations on the noise maps. Necessity of these maps is to see noise levels which people have been exposed to. An ideal noise pollution map can give basic information about city traffic plan, its development, investigation of noise removal research and noise polluted places that must be worked on. Furthermore, noise maps are the evaluation of experimental study on different noise sources (highway, airport, railway and industrial noise) and investigation of basic human problems [23, 24]. |
| |
| The noise pollution situation in Ilorin metropolis is similar to that in many urban areas. The city is relatively large, having rapid increase in population growth rate. The population has increased from 423,340 in 1980 to 902,131 in 2006 [25]. The city has expanded continuously in all directions in the past two decades. Many significant changes have been experienced in terms of urbanization, industrialization, expansion of road-network, and infrastructure. The city has been subjected to persistent road traffic and commercial activities due to overall increase in prosperity, fast development, and expansion of the economy. |
| |
| According to the Directive 2002/49/EC of the European Parliament and of the Council, of 25 June 2002 relating to the assessment and management of environmental noise imposes to its Member States the elaboration of noise maps for cities with more than 250,000 inhabitants, due no later than 30 June 2007 [26]. Based on this directive, Ilorin metropolis with population of over 902, 131 inhabitants is qualified to be presented with noise map. Hence, the prime objectives of this investigation are (1) to evaluate the noise levels in strategic locations (i.e., commercial centers, busy roads/road junctions, passenger loading parks, and residential areas) in the city, and (2) to develop the noise map of the city |
| |
| Materials and Methods |
| |
| Study area |
| |
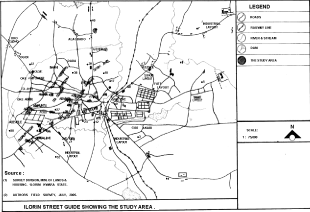
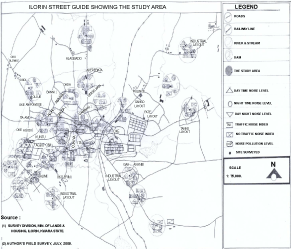
| This research is based on the results of outdoor sound level measurements carried out in July 2005 at 42 different locations ( 12 commercial centers, 12 road junctions & busy roads, 6 passengers loading parks, 6 high density areas and 6 low density areas) in Ilorin metropolis, the capital city of Kwara State. Table 1 shows the locations selected for the noise level measurements in Ilorin metropolis. Figures 1 and 2 shows an overview of Ilorin metropolis showing the locations of noise measurements for this study and the population growth of the city respectively. |
| |
|
|
Table 1: Locations selected for the Noise Level Measurements in Ilorin Metropolis |
|
| |
|
|
Figure 1: Overview of Ilorin metropolis showing the locations of noise measurements Throughout this study (Source: Survey Division, Min. of Lands & Housing, Ilorin, Kwara State) |
|
| |
|
|
Figure 2: The Increase in Population of IIorin |
|
| |
| Experimental procedure |
| |
| Instrumentation for the field measurements consisted of precision grade sound level meter (according to IEC 651, ANSI S1.4 type), ½- in. condenser microphone and ââ¦â- octave filter with frequency range and measuring level range of 31.5Hz – 8 KHz and 35-130dB respectively. The instruments were calibrated by the internal sound level calibrator before making measurements at each site. All the instruments comply with IEC standards. |
| |
| The measurements were made at street level (at road junctions, market centers, passengers loading parks and residential areas). The instrument was held comfortably in hand with the microphone pointed at the suspected noise source at a distance not less than 1 m away from any reflecting object. L Ai (A-weighted instantaneous Sound pressure level) measurements were recorded at intervals of 30 seconds for a period of 30 minutes, giving 60 meter readings per sampling location. This procedure was carried out for morning (7:30 -8:00 a.m), afternoon (1:00 – 1:30 p.m), evening (4:00-4:30 p.m) and night (8:30 -9:00 p.m) measurements. From these readings, commonly used community noise assessment quantities like the exceedence percentiles L10, and L90, the A-weighted equivalent sound pressure level, LAeq, the daytime average sound level, LD, the day-night average sound level, LDN, the noise pollution level, LNP and the traffic noise index, TNI were computed. |
| |
| These noise measures are defined as follows [27]: |
| |
 |
| |
 |
| |
 |
| |
 |
| |
 |
| |
 |
| |
| Where LAi is the ith A-weighted sound pressure level reading dB, N is the total number of readings, LAeq is the A-weighted equivalent sound pressure level, LAeqM is the equivalent sound pressure for the morning measurement, LAeqA is the equivalent sound pressure level for the afternoon measurement, LAeqE is the equivalent sound pressure level for the evening measurement, LAeqN is the equivalent sound pressure level for the night measurement, LN is night time noise level, LD is day time noise level, L10 is the noise level exceeded 10% of the time, L90 is the noise level exceeded 90% of the time, LNP. is noise pollution level, LDN is day-night noise level, TNI is the traffic noise index. |
| |
| Results and Discussion |
| |
| Assessment of noise descriptors |
| |
| Noise measurements were done when the effects on the noise sources of variable factors were at minimum. All the data were obtained on weekdays and under suitable meteorological conditions, i.e., no rain. Measurements were recorded at interval of 30 seconds for a period of 30 minutes, giving 60 meter readings per location. The data were used to evaluate noise descriptors in the form of LAeq, L10, L90, TNI, LNP, LD, LN and LDN. |
| |
| The average noise descriptors were determined per location. Table 2 shows the daily average values of noise descriptors for all the sites surveyed. The sites are designated with numbers 1 to 42. From Table 2, location 10 has the highest values of LAeq (86 dBA), L10 (92 dBA), LD (89 dBA), TNI (122 dBA), LNP(106 dBA), LDN (92 dBA) and second highest value of L90 (72 dBA) and LN (84 dBA). Location 15 has the second highest values of LAeq (84 dBA), L10 (87 dBA), TNI (112dBA) , LNP(102 dBA), LDN (91dBA) and highest value of LN (85 dBA). These two locations are road junction/busy roads in the city surveyed. In order of high noise descriptors, next to these two locations are sites 20 and 25. The average values of noise descriptors of these locations are: LAeq (82 dBA), L10 (86 dBA), L90 (73 dBA), TNI (98dBA), LNP (96dBA), LD(83 dBA), LN (83dBA) ,LDN(89dBA) and LAeq (82 dBA), L10 (86 dBA), L90 (74 dBA), TNI (92dBA), LNP (94dBA), LD(81 dBA), LN (82dBA) , and LDN(88dBA) respectively. |
| |
|
|
Table 2: Average Noise Descriptors at Study Locations |
|
| |
| Locations 20 and 25 are commercial centre and passengers loading park respectively. The background noise levels (L90) at these locations are higher than locations 10 and 15. This is due to intrusive noise sources from human conversation due to commercial activities, radio player, electric generator noise etc. The lowest noise descriptor values were recorded at location 34 and 6 with values LAeq (46 dBA), L10 (44 dBA), L90 (34 dBA), TNI (44dBA), LNP (56dBA), LD(49 dBA), LN(44dBA), LDN(52dBA) and LAeq(47 dBA), L10 (49 dBA), L90 (44 dBA), TNI (33dBA), LNP (52dBA), LD(43 dBA), LN(53dBA) ,LDN(59dBA) respectively. These locations are low density residential areas. Among the factors responsible for differences in noise levels in the centers surveyed include location site, presence of intrusive noise, traffic volume, commercial activities etc. |
| |
| The environmental sound levels measured at a given location depend on a number of specific variables. In particular, many authors have found that the observed sound levels are mainly related to road traffic characteristics, and especially traffic volume, vehicle horns, rolling stock and tires, unmuffled vehicles, etc. [28-30]. Several studies have demonstrated that the urban conditions of a given area are also a very important factor influencing the environmental noise levels. |
| |
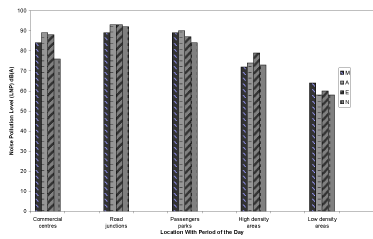
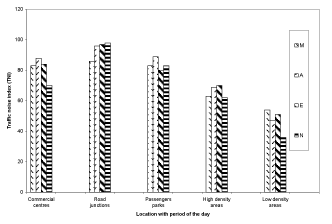
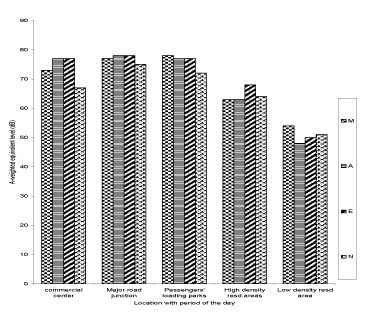
| There is variation in the noise levels with the period of the day and the nature of the location. In general, there are high noise pollution levels (LNP) in the daytime (7:30 am–2:30 pm) compared with the night-time (8:30 pm–9:00 pm), except in the residential areas where the majority of the residents are not always at home during the working days of the week; hence, the noise levels are low at residential areas (especially in low-density residential areas) in afternoon time. Figures 3 to 5 show the variations of noise pollution levels (LNP), traffic noise index (TNI) and equivalent pressure noise level (LAeq) with location and period of the day. At commercial centers, road junctions, passenger loading parks, and high-density areas, the noise descriptors: LNP,TNI and LAeq rise from morning and reach peak values in the afternoon and evening but descend in the night to low levels. |
| |
|
|
Figure 3: Variation of Noise Pollution Levels (LNP) with Location and Period of the day |
|
| |
|
|
Figure 4: Variation of the traffic noise index (TNI) with location and period of the day |
|
| |
|
|
Figure 5: Variation of the equivalent sound level LAeq with location and period of the day |
|
| |
| The high noise pollution levels in the morning and evening at these locations can be justified as a result of morning rushing hours of office workers and business men and women, to resume work at offices and open shop for customers. The noise pollution levels in the afternoon time (1:00 pm–2:30 pm) at low-density residential areas are generally low. This is because the majority of the residents are not always available at home in the afternoon. Some are in their offices, markets, or shops while children are in their schools by this time of the day. Moreover, most of the low-density residential areas are developing areas, while some are government-reserved areas. The numbers of vehicles that ply the roads in these areas are very minima, and of course, there is a speed limit (40 km/h) for every vehicle that passes through these areas. Blaring of horns and movement of unmuffled vehicles are prohibited in some of these areas. |
| |
| At the time of this measurement, the highest and lowest average noise pollution levels (LNP), traffic noise index (TNI) and equivalent pressure noise level (LAeq) were 106 dB (A), 122 dB (A), 86 dB(A) at location 10 (road junction) and 52 dB (A), 33 dB (A), 46dB(A) at locations 6 and 34(low-density residential area), respectively. |
| |
| Locations 10 and15 were found to be the noisiest sites with peak noise levels (L10) of 92 dB (A) and 94 dB (A), respectively, compared to the peak noise value of 91.5 dB (A) in Markurdi [17] and 100 dB (A) in Abraka [18]. The high noise pollution values of these sites may be as a result of the noise produced by music players and the proximity of these sites to the high traffic density of roads and presence of nearby rail stations. The high noise levels at road junctions confirm once more the previous findings of many authors pointing to the existence of a very close association between the sound levels measured at a given urban location and the road traffic volume flowing by that location [27,31]. |
| |
| High noise levels exposure in the city occurs in the day time at road junctions/ major roads. This is followed by passengers loading parks and commercial centers. In these locations, apart from traffic noise, other intrusive noise sources include noise from record players, loud speakers, hawking and human conversation contribute majorly to environmental noise pollution. |
| |
| In this study, some of the locations show a significant difference between L90 average and L90 maximum. Site 25 (a passenger loading park) illustrates the highest different with L90 (74 dBA) compared to L90 average (60 dBA). This means some of the stations around the location noted a much higher background noise level exposure. This indicates that people located around the location will experience much higher background noise level which could lead to human annoyance, reduce the life quality or might affect health and psychological well being. Site 20 (commercial center) and site 10 (road junction) also noted considerable difference in L90. They both have values of 73 dBA and 72 dBA respectively. The high background noise level at these locations may be a result of intrusive noise from unmuffled vehicles, blaring of horns, record players, hawking and human conversation. Sites 10 and 15 (road junctions) were found to be the noisiest sites with a peak noise level of 88 dBA and 84 dBA respectively. |
| |
| The U.S. Department of Housing and Urban Development (HUD) [32], recommends the following noise levels for residential areas, measured outdoors: |
| |
| LAeq ≤ 49 dBA —clearly acceptable |
| |
| 49 < LAeq ≤ 62 dBA (or LDN |
| |
| ≤65 dBA) —normally acceptable |
| |
| 62 < LAeq ≤ 76 dBA (or 65 < LDN |
| |
| ≤ 75 dBA) —normally unacceptable |
| |
| LAeq > 76 dBA (or 75 dBA |
| |
| |
| < LDN) —clearly unacceptable |
| |
| Considering the criteria from HUD, only 9 locations representing 21.4% out of the 42 locations surveyed, can be classified as normally acceptable, while 14 locations representing 33.3% can be classified as clearly unacceptable. A widely accepted scientific fact is that living in black acoustic zones, where the equivalent sound level is higher than 65 dBA put an urban population in a high risk status for numerous subjective effects of noise, including psychological, sleep and behavioural disorder. |
| |
| Most of the countries, keeping in view the alarming increase in environmental noise pollution, have come up with permissible noise standards. The US Federal Highway Administration (FHWA) in April 1972 published interim noise standards for various land use as shown in Table 3. The World Health Organization has suggested a standard guideline value for average outdoor noise levels of 55 dB(A), applied during normal daytime (16 hours) in order to prevent significant interference with the normal activities of local communities, and is considered as serious annoyance, while a value of 50 dB as moderate annoyance. Table 4 shows the WHO Guidelines values for Community Noise listing also critical health effects ranging from annoyance to hearing impairment. |
| |
|
|
Table 3: FHWA noise standards [30]. |
|
| |
|
|
Table 4: WHO guideline for community noise [16] |
|
| |
| The result of this study shows that noise levels (L10) in all the passenger loading parks surveyed (ranges from 72–86 dBA) are higher than the recommended values by FHWA (i.e., 60 dBA). In other locations, such as developed areas and residential areas the measured noise values (L10) can be classified as normally acceptable. Out of 12 developed areas (commercial centers) surveyed only 5 locations having noise level higher than 75 dBA, out of 6 high density residential areas, only 2 locations recorded noise levels higher than 70 dBA and out of 6 low density residential areas, only 1 location had noise levels higher than 55 dBA. |
| |
| Based on the National Guidelines for Environmental Noise Control by Federal-Provincial Advisory Committee on Environmental and Occupational Health, a generally acceptable road traffic noise level LD for residential areas should be less than 55 dBA and for night, LN should not be greater than 50 dBA. An area with environmental noise level less than 55 dBA is usually considered as a comfortable environment with little or no annoyance so that no negative physical and mental influence will be caused to essential activities such as working leisure and sleeping [33,34]. Among all the locations surveyed, only the low density residential areas like locations 1 and 34 are acceptable in terms of the noise levels per recommendations of CEOH and WHO. If the standard of HUD is considered, the dwelling areas like locations 1, 4, 5, 6, 30 and 34 are under normally acceptable situation and the noise levels of the other areas are still not acceptable. It may therefore be stated that the locations that fall under commercial centers, road junctions/ major roads, passenger loading parks and high density residential areas do not satisfy the recommended noise limit requirements according to these standards. |
| |
| To ascertain the significant difference in the noise level exposure in the sites surveyed throughout the daytime period (from morning to evening time), analysis of variance for two-factor experiment, using F-distribution was carried out on the noise descriptors (L10 and L90). At 90% confidence level, the mean square ratio (MSR) calculated for L10 is 38.23 while the tabulated value of mean square ratio is 2.36. Similarly, at the same confidence level, the MSR calculated for L90 is 167 and the tabulated value remain the same at 2.36. Since in the two cases, the mean square calculated is greater than the mean square tabulated, the noise levels exposure differ significantly from one location to another. |
| |
| Noise map for ilorin metropolis |
| |
| Noise maps describe spatial distributions of noise levels. They allow an efficient visualization of the noise distributions in areas where the land uses are sensitive to noise. Noise mapping is a very efficient noise assessment method in urban areas [35]. A noise map is considered as a tool to improve or to preserve the quality of the environment regarding noise pollution, allowing a comprehensive look at the problem of multiple sources and receivers. Noise map is also an excellent tool for urban planning. According to Santos [36], the use of noise maps techniques as a planning tool allows: |
| |
| Quantification of noise in the studied area; Evaluation of the population exposition; Creation of a database, for urban planning with localisation of noisy activities and mixed and sensible zones; Modelling of different scenarios of future evolution; Prediction of impact noise of projected infrastructure and industrial activities. |
| |
| In this work, noise mapping and, of course, noise abatement plans drawn for noisy areas (commercial centers, major road junctions, passenger loading parks, high-density residential areas) and low-noise areas (low density residential areas) are presented. All the data collected at the 42 sites were used to develop a noise map for Ilorin metropolis. A noise map based on daytime noise level (LD), night-time noise level (LN), day–night noise level (LDN), traffic noise index (TNI), average weighted equivalent noise level (LAeq)and noise pollution levels (LNP) has been developed. Figure 6 shows the noise map of Ilorin metropolis. The noise map reveals that the nucleus of the city is characterized by a high noise exposure level. The daytime noise level is 84 dB (A), the night-time noise level is 81 dB (A), the day–night time noise level is 91 dB (A), the TNI is in the range of 85–115 dB (A), and the noise pollution level is in the range of 90–105 dB (A). The outskirt area of the city is basically low-density residential areas and developing sites. The highest daytime noise level is 74 dB (A), the night-time noise level is 68 dB (A), the day–night noise level is 76 dB (A), traffic noise pollution is 80–95 dB (A), and noise pollution level is 90–100 dB (A). Generally, the suburbs of the city are characterized by low noise, but due to major roads that pass through some of these locations, traffic noise contributes as a major source of environmental noise pollution in some of the outskirt locations. In the center of the city, there are concentrations of shops, markets, and clustered buildings with high population and traffic volume. All these are responsible for high noise exposure levels; therefore, the residents living or trading in these areas are exposed to noise levels of 80–90 dB (A) or more every day. This is very dangerous to the health of the people in these areas. According to the World Health Organization, generally 60-dB (A) sounds can result in temporary hearing impairment and 100-dB (A) sounds can cause permanent impairment. The noise levels of Ilorin metropolis are similar to those reported for other cities around the world in Jordan, Spain, Brazil, Greece, and India [37,14,39, 38]. |
| |
|
|
Figure 6: Noise map for Ilorin metropolis |
|
| |
| This work is an eye-opener to see and understand the importance of noise map for Nigerian urban areas-as it enables one to know areas that are noisy and ones with low noise. Also, the category of people in the urban areas exposed to different noise sources and noise exposure dose based on their occupation is known with the help of the noise map. Furthermore, the noise map has the potential to enable data to be accessible to the general public in a way that is comprehensible. This could have the effect of raising people’s awareness of noise as a pollutant and, thus, creating the climate necessary for the implementation of a noise-reduction program. |
| |
| Conclusion |
| |
| Environmental noise analyses at selected locations were presented to represent typical equivalent noise level (LAeq), background noise level (L90), traffic noise index (TNI), noise pollution level (LNP), L10, LD, LN and LDN at 42-selected sites in Ilorin metropolis. It is interesting to see that where location of the monitoring stations are near the busy roads/ road junctions, commercial centers and passengers loading parks the equivalent noise level, background noise level and peak noise level are higher compared to monitoring station near residential areas. |
| |
| This investigation reveals that noise levels at 30 of 42 measurement points exceeded the recommended limit of 60dB (A) by values of 1–27 dB (A). Hence, the present status of noise pollution in Ilorin metropolis poses a severe health risk to the residents. Furthermore, discomfort and irritation being caused by the pollution can drastically reduce productivity, both in public service and private sectors. In addition, some areas may soon reach the threshold of pains and lead to permanent loss of hearing and death. |
| |
| Due to these possible adverse effects of noise pollution on the populace, a number of action plans can be taken to abate the environmental noise pollution in Nigeria. These include technical, planning, behavioural, and educational solutions. Since transport infrastructures can be recognized as major sources of noise, technical actions on the transport systems can produce interesting results. Possible technical controls include changes in road profiles; low-noise pavement (porous or porous elastic) types; effective repairs to the silencers and vehicle suspensions so as to reduce exhaust and rolling stock noise; reductions, limitations, or restrictions on traffic (types of vehicles, speed, hours of access, etc.); and building of acoustic barriers along the sides of heavily travelled highways running through residential areas. Transportation and land planning (private vs public transportation, bus lanes, parking areas, shuttle buses, and pedestrian areas) are important components of the plan. Since noise also results from the citizen’s behaviour (driver, music player, hawker, etc.), information and education campaigns usually produce good results in the long term. Information on the different actions and on the results should be well disseminated and should correspond to general aims and action plans. There is a need to establish environmental noise impact criteria levels for various land use purposes. These criteria levels would enable impacts to be determined. The authorities should pass laws to check excesses of the sources of high noise levels; other professionals, such as town planners, architects, and environmental engineers, should have the problems of environmental noise pollution in mind when setting new roads, shopping centers, schools, hospitals, and both commercial and residential houses in general. The most valuable step to decrease noise pollution in a big city like Ilorin is the preparation of noise maps. Noise maps are very powerful tools for communicating results of assessment of environmental noise to the general public and for the government (local and national) to devise noise correction measures. The noise map itself, with the values of noise descriptors, provides baseline data for town planners, engineers, and other professionals and researchers for the planning and execution of their projects. Most of the cities in Nigeria have not presented noise pollution maps. It is suggested that noise maps should be developed for every big city in Nigeria to serve as a noise control measure. |
| |
| |
| References |
| |
- Davis ML, Masten SJ (2004) Principle of environmental engineering and science. Mc Graw-Hill International.
- Ozer S, Yilmaz H, Yesil M, Yesil P (2009) Evaluation of noise pollution caused by vehicles in the city of Tokat, Turkey. Scientific Research and Essay 4: 1205-1212.
- Yilmaz H, Ozer S (2005) Evaluation and Analysis of Environmental Noise Pollution in the City of Erzurum, Turkey. Int J Environ Pollut23: 438-448.
- Singh N, Daver SC (2004) Noise pollution-sources, effects and control. Journal of Human Ecology(Delhi,India) 16: 181-187.
- Li B, Tao S, Dawson RW (2002) Evaluation and analysis of traffic noise from the main urban roads in Beijing. Appl Acoust 63: 1137- 1142.
- Morillas JMB, Escobar VG, Sierra JAM, Gómez RV, Carmona JT (2002) An environmental noise study in the city of Cáceres, Spain. Appl Acoust 63: 1061-1070.
- Zannin PHT, Diniz FB, Barbosa WA (2002) Environmental noise pollution in the city of Curitiba, Brazil. Appl Acoust 63: 351-358.
- Alberola J, Flindell H, Bullmore J (2005) Variability in road traffic noise levels. Appl Acoust 66: 1180-1195.
- Lebiedowska B (2005) Acoustic background and transport noise in urbanised areas: A note on the relative classification of the city soundscape. Trans Res Part D: transport and environment. 10: 341-345.
- Pucher J, Korattyswaropam N, Mittal N, Ittyerah N (2005) Urban transport crisis in India. Transp Policy 12: 185-198.
- Tansatcha M, Pamanikabud P, Brown AL, Affum JK (2005) Motorway noise modelling based on perpendicular propagation analysis of traffic noise. Appl Acoust 66: 1135-1150.
- Ali SA, Tamura A (2003) Road traffic noise levels: Restrictions and annoyance in greater Cario, Egypt. Appl Acoust 64: 815-823.
- Marius A, Tijunelis MD, Fitzsullivan BA, Sean O, Henderson MD (2005) Noise in the ED. Am J Emerg Med 23: 332-335.
- Georgiadou E, Kourfidis K, Ziomas I (2004) Exploratory traffic noise measurements at five main streets of Thessaloniki, Greece. Global NEST: Int J 6: 53-61.
- Quis D (2001) Annoyance from road traffic noise: a review. J Environ Psychol 21: 101-120.
- Dursun S, Ozdemir C, Karabörk H, Koçak S (2006) Noise pollution and map of Konya city in Turkey. J Int Environmental Application & Science 1: 63-72.
- Ugwuanyi JU, Ahemen I, Agbendeh AA (2004) Assessment of Environmental Noise Pollution in Markurdi Metropolis, Nigeria.J Pure Appl Sci6:134-138.
- Anomohanran O, Iwegbue CMA, Oghenerhoro IO, Egbai IJC (2008) Investigation of Environmental Noise Pollution Level of Abraka in Delta State, Nigeria. Trends in Applied Sciences Research 3: 292-297.
- Ighoroje ADA, Marchie C, Nwobodo ED (2004) Noise Induced Hearing Impairment as an Occupational Risk Factor among Nigerian Traders. Nigeria J of Physiological Sciences9: 14-19.
- Commission of the European Communities (2000) Directive of the European Parliament and of the Council Relating to the Assessment and Management of Environmental Noise, COM 468 Final.
- Bond M (1996) Plague by noise. New Scientist 16: 14-15.
- Birgitta B, Thomas L, Dietrich H (1999) Guidelines for Community Noise.
- Stansfeld S, Haines M, Brown B (2000) Noise and health in the urban environment. Rev Environ Health 15: 43-82.
- Leth S (2003) Train noise reduction scenarios for compliance with future noise legislation. J Sound Vib 267: 675-687.
- Nigeria Population Census (NPC) 2006
- EC (2002) Directive 2002/49/EC of the European parliament and of the council of 25 June 2002 relating to the assessment and management of environmental noise. Official Journal of the European Communities 189: 12-26.
- Saadu AA, Onyeonwu RO, Ayorinde EO, FO Ogisi (1998) Road Traffic Noise Survey and Analysis in Some Major Urban Centers in Nigeria. Noise Control Eng J46: 146–158.
- Oyedepo SO, Saadu AA (2008) Changing Noise Climate of Ilorin Metropolis. Environmental Engineering Science26: 797-808.
- Oyedepo SO, Saadu AA (2010) Evaluation and analysis of noise levels in Ilorin metropolis, Nigeria. Environ Monit Asses160: 563-577.
- Mansouri N, Pourmahabadian M, Ghasenkhani M (2006) Road Traffic Noise in Downtown Area of Tehran. Iran J Environ Health, Sci Eng3: 267-272.
- Garcia G, Garrigues J (1998) 24-hour Continuous Sound-level Measurement Conducted in Spanish Urban Areas. Noise Control Eng J 46: 159-166.
- Bruel, Kjaer (1998) Technical Documentation 2238 and 2260 Integrating and Logging Sound Level Meter.
- Dai L, Cao J, Fan L, Mobed N (2005) Traffic Noise Evaluation and Analysis in Residential Areas of Regina. J Environmental Informatics5: 17-25.
- Dhananjay KP, Prashant BN (2007) Assessment and ANN Modeling of Noise Levels at Major Road Intersections in an Indian Intermediate City. J of Research in Science, Computing,and Engineering4: 39-49.
- Coelho JLB, Alarcao D (2005) On Noise Mapping and Noise Action Plans for Large Urban Areas. Forum Acoustica.
- Santos LC, Valado F (2004) The municipal noise map as planning tool, Acústica, Guimarães, Portugal, Paper ID: 162.
- Ahamad J, Abbas A, Reem S (2006) Evaluation of Traffic Noise Pollution in Amman, Jordan. J of Environmental Monitoring and Assessment120: 499-525.
- Panadya GH (2003) Assessment of traffic noise and its impact on community. International Journal of Environmental Studies60: 595-602.
- Zannin PHT, Calixto A, Diniz F, Ferreira JAC (2003) Survey of urban noise annoyance in a large Brazilian city: The importance of subjective analysis in conjunction with objective analysis. Environmental Impact Assessment Review22: 245-255.
|
| |
| |