| Research Article |
Open Access |
|
| Pipat Chiewvit1*, Mattana Torwarapanit1, Jitladda Wasinrat1, Areesak Chotivichit2, Thanet Watthanaapisith2and Sanyapong Sanpakit2 |
| 1Department of Diagnostic Radiology, Faculty of Medicine Siriraj Hospital, Mahidol University, Thailand |
| 2Department of Orthopaedic Surgery, Faculty of Medicine Siriraj Hospital, Mahidol University, Thailand |
| *Corresponding authors: |
Pipat Chiewvit
Department of Diagnostic Radiology
Faculty of Medicine Siriraj Hospital
Mahidol University, Thailand
E-mail: pipat8999@yahoo.com |
|
| |
| Received November 25, 2012; Published August 02, 2012 |
| |
| Citation: Chiewvit P, Torwarapanit M, Wasinrat J, Chotivichit A, et al. (2012) Diagnostic Values of Magnetic Resonance Imaging in the Diagnosis of Lumbar Foraminal Stenosis Compared with Surgical Findings. 1: 240. doi:10.4172/scientificreports.240 |
| |
| Copyright: © 2012 Chiewvit P, et al. This is an open-access article distributed under the terms of the Creative Commons Attribution License, which permits unrestricted use, distribution, and reproduction in any medium, provided the original author and source are credited. |
| |
| Abstract |
| |
| Objective: To measure the diagnostic values of preoperative Magnetic Resonance Imaging (MRI) for diagnosis of lumbar foraminal stenosis in the symptomatic lumbar spinal stenosis patients who need surgery. |
| |
| Materials and Methods: Thirty-two lumbar spinal stenosis patients with indication for surgical treatment were included. Two radiologists independently interpreted foraminal narrowing on sagittal T2W image by means of quantitative measurements including posterior disc height, foraminal height, cross-sectional area and qualitative MRI grading system. Using surgical findings as standard reference that was performed by routinely intraoperative probing. |
| |
| Results: The sensitivity, specificity, PPV and NPV of critical posterior disc height of 4 mm or less for diagnosis of foraminal stenosis were 40.5%, 96.8%, 93.8% and 57.7%, respectively, and using critical foraminal height of 15 mm or less were 97.3%, 72.6%, 80.9% and 95.7%, respectively. The corresponding values for MRI grading system were 83.8%, 90.3%, 91.2% and 82.4%, respectively. |
| |
| Conclusion: Both of quantitative measurements and qualitative MRI grading system assessing on sagittal MR image are helpful for preoperative diagnosis of foraminal stenosis and have correlated well with the surgical findings. Among of these variables, critical posterior disc height demonstrated highest specificity and PPV. In addition, MRI grade 2 and 3 might be clinically significance and be the indicator for judgment of additional foraminotomy in lumbar spinal stenosis patients. |
| |
| Introduction |
| |
| Lumbar Spinal Stenosis (LSS) usually presents in the fifth or sixth decade [1]. The patients classically present with back pain, unilateral or bilateral neurogenic claudication, weakness, numbness/tingling and radicular pain [2]. Clinical findings include various combinations of sensory disturbances and weakness [1]. Based on the anatomical classification, LSS can be subdivided into central canal stenosis, lateral recess stenosis and foraminal stenosis. These commonly occur in various combinations in the same individual [1]. |
| |
| Lumbar foraminal stenosis is a common etiology of lumbar radicular symptomatology [3]. An 8% to 11% incidence of lateral root entrapment has been reported [4-6]. Foraminal stenosis occurs when a hypertrophic facet, vertebral-body osteophyte, or bulging disk narrows the neural foramen and encroaches on the nerve roots [7]. |
| |
| The role of imaging is to confirm the presence of stenosis and accurately identify the site of any neural compression to ensure that the extent of surgical decompression is appropriate. There is general consensus that MRI alone is sufficient in the vast majority of cases. Foraminal stenosis is an important condition to recognize2. Morphologic changes in foramen are well demonstrated on sagittal MRI [8]. |
| |
| Unfortunately, unrecognized foraminal stenosis may be associated with failed back surgery syndrome8, residual symptoms following decompression of the central canal [2]. Because the surgical treatment for foraminal stenosis differs greatly from that for lateral recess stenosis [3,4]. Burton et al [9] in their review of failed back surgery syndrome, attributed it to the lack of recognition or inadequate treatment of foraminal stenosis and considered it to be the cause of pain in nearly 60% of patients with continued postoperative symptoms. Therefore, lumbar foraminal stenosis is an important pathologic entity to identify in the patient being treated for radicular symptoms [3]. |
| |
| Previous radiologic reports regarding foramen or nerve root morphology focus only on changes at the affected level [10] or evaluate by using only qualitative scoring system [11,12] or are limited to the occurrence of abnormalities in asymptomatic volunteers [13,14]. Hasegawa et al. [15], in a cadaveric study, showed that significant nerve root compression is commonly associated with a foraminal height of 15 mm or less and a posterior disc height of 4 mm or less. They concluded that these critical dimensions might be indicators of lumbar foraminal stenosis. |
| |
| The present study was undertaken prospectively to assess the diagnostic values of preoperative conventional MRI in detecting lumbar foraminal stenosis in symptomatic lumbar spinal stenosis patients who are indicated for surgery, by using the quantitative parameters and the qualitative scoring system. |
| |
| Materials and Methods |
| |
| This study was a prospective study approved by our institutional review board. |
| |
| Patients |
| |
| From April to October, 2009, a total of 60 consecutive patients, who had scheduled for surgical decompression for treatment of lumbar spinal stenosis with one or more indication(s) including significant impaired quality of life, failure of non-operative treatment to relieve symptoms, presence of significant or progressive neurologic dysfunction [16] were included in this study. All of these patients already performed preoperative MRI of lumbosacral spine in our institute. The patient exclusion criteria were as follows: 1) those who had prolonged duration between date of preoperative MRI from date of operation, more than 6 months (n = 18); 2) those who had previous lumbar spine surgery (n=9); 3) those who had peri-operative hemodynamic instability (n=1). Finally, 32 patients were enrolled in this study. The informed consents were obtained from all patients. |
| |
| The radiology-training resident recorded clinical background including patient age, sex, clinical sign(s), indication(s) for surgical treatment, and the duration between MRI and operation. |
| |
| Operative procedures and findings |
| |
| All standard surgical procedures were selected and performed by the orthopeadic surgeons with experience in spine surgery. All of them completed a spine fellowship. After decompressive laminectomy was carried out, foraminal stenosis was routinely assessed by gentle probing. Lumbar foraminal stenosis was surgically defined as feeling tight by probing. When probing revealed an associated foraminal stenosis, additional foraminotomy was performed. However, if the nerve root(s) was apparently severe entrapped within the neural foramen(s) by adjacent tissue, we also accounted that was foraminal stenosis without probing which may produce more injury to the affected nerve root. These surgical findings served as the standard reference to assess preoperative MRI diagnosis for lumbar foraminal stenosis. The numbers and level(s) of surgical examination were recorded. |
| |
| MR Imaging |
| |
| MRI of the lumbosacral spine was obtained on sagittal Spin-Echo (SE) T1- and T2-weighted images and axial SE T2-weighted or axial balanced Gradient-Echo (GRE) images using one of 1.5 or 3 Tesla Philips system with a sense spine coil. The parameters of MR imaging protocol used in our study were shown in (Table 1). The scan was performed in the standard supine position. |
| |
|
|
Table 1: MR imaging protocol using in our study. |
|
| |
| Analysis of MR images |
| |
| The MR images were independently reviewed by a board-certified neuroradiologist with 15 years experience (reader 1) and a boardcertified diagnostic radiologist with 5 years experience (reader 2). They were blinded to the clinical and surgical information. |
| |
| In the review of Jenis and An [3], in sixty-five surgical cases with lumbar foraminal stenosis, the most common roots involved were the fifth lumbar root (75%), followed by the fourth root (15%), the third root (5.3%), and the second root (4.0%). Accordingly, disease prevalence among foramens was estimated to be 0.2% at L2–L3, 0.3% at L3–L4, 0.8% at L4–L5, and 3.8% at L5–S1. Because of higher incidence of foraminal stenosis was found in the lower lumbar segments. Therefore, in this study we considered to evaluate neural foramens of L3–L4, L4-L5 and L5–S1 levels. |
| |
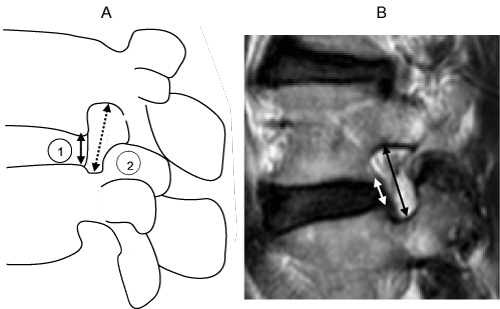
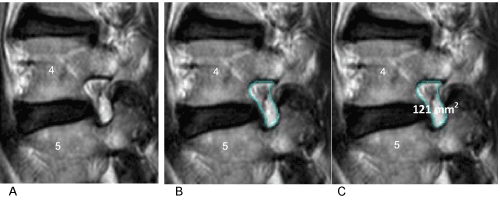
| The radiologists reviewed the MR images on the PACS, bilateral neural foramens from L3–L4 to L5–S1 levels were assessed for potential foraminal stenosis. The anatomic boundaries of neural foramen were defined according to Jenis and An3, including the adjacent vertebral pedicles superiorly and inferiorly, the posteroinferior margin of the superior vertebral body, the posterior intervertebral disc, and the posterosuperior margin of the inferior vertebral body as anterior boundaries, the ligamentum flavum, superior and inferior articular facets as posterior boundaries. They independently identified the slice that showed the maximum stenosis on sagittal T2W sections. The window width and level were set individually for each patient to optimize contrast between the nerve roots and surrounding tissue. Then, radiologists measured posterior disc height (mm.) and foraminal height (mm.) using an electronic cursor on the PACS. Then, cross-sectional area of neural foramens were also measured using an electronic cursor on the commercial available software. These measurement parameters were illustrated as in (Figure1 and 2) |
| |
|
|
Figure 1: A. The diagram shows sagittal measurement of posterior disc height (1): the shortest distances between posterior aspect of the adjacent superior and inferior end plates (mm.) And the foraminal height (2): the maximum distances between the inferior margin of pedicle of the superior vertebra and the superior margin of pedicle of the inferior vertebra (mm). B. The sagittal T2W image shows measurement of posterior disc height (white arrow) and foraminal height (black arrow). |
|
| |
|
|
Figure 2 A-C: Demonstrate cross-sectional area (mm2) measurement of neural foramen by using an electronic cursor on the ViewForum2 (Philips) in sagittal T2W image. This patient has 121 mm2 cross-sectional area on the right L4-L5 level. |
|
| |
| Afterward, radiologists assessed severity of foraminal stenosis, based on qualitative grading system introduced by Wildermuth et al. [12] (Table 2). Interpretation disagreements were resolved by means of consensus review. |
| |
|
|
Table 2: MR criteria for grading foraminal size. |
|
| |
| Statistical Analysis |
| |
| All quantitative data, including the patient age, duration between preoperative MRI to operation, posterior disc height, foraminal height and cross-sectional area of neural foramen were reported as the mean±SD. Comparison of quantitative data and whether there are stenosis or no stenosis evaluated by the surgical findings was achieved by two-samples t-test. Intraclass Correlation Coefficient (ICC) was used to assess the degree of observer agreement in quantitative variables (i.e, posterior disc height, foraminal height, cross-sectional area) between the two radiologists. The scale of the ICC for interobserver agreement was <0.40, poor; 0.40-0.75, fair-good; >0.75, excellent [17]. |
| |
| To assess the association between quantitative MRI grading score and surgical findings, Fisher’s Exact test was performed. Cohen kappa coefficient was employed to assess the degree of interobserver agreement of MRI grading score. The scale for the kappa coefficients was K < 0.20, poor; 0.21–0.40, fair; 0.41–0.60, moderate; 0.61–0.80, substantial; and 0.81–1.00, almost perfect [18,19]. |
| |
| Sensitivity, specificity, accuracy, Positive Predictive Value (PPV) and Negative Predictive Value (NPV) of posterior disc height (≤4, >4 mm), foraminal height (≤15, >15 mm) and MRI grading score (0-1, 2-3) compared to surgical findings were also calculated. One-way ANOVA was utilised to compare the mean of each of three MRI measurement parameters between four MRI grading scores. |
| |
| |
| P value of less than 0.05 was considered statistical significance. Statistical analysis was completed using statistical software package (SPSS, version 13.0). |
| |
| Results |
| |
| Thirty-two patients were included into this study which are composed of 16 men and 16 women. The age of patients ranged between 49-78 years and the mean age was 63.6±8.2 years. The clinical presentation of these patients included radiculopathy (n=25, 78%), neurogenic claudication (n=24, 75%), low back pain (n=18, 56%), motor weakness (n=9, 28%) and numbness (n=7, 22%). Duration between preoperative MRI and operation varied from 5-127 days, the mean and SD was 59 ± 27.8 days. Indication(s) for surgical treatment included significant impaired quality of life (n=22, 68%), failure of nonoperative treatment to relieve symptoms (n=19, 59%), and presence of significant or progressive neurologic dysfunction (n=3, 9%). |
| |
| The surgical methods were performed in our study including decompressive laminectomy and posterolateral fusion using local bone graft with or without instrumentation. The numbers of neural foramen and also lumbar level(s) that were evaluated by surgical probing differently in each patient, depending on the preoperative diagnosis, surgical approach and field of surgery. Single lumbar level (2 neural foramens), two lumbar levels (4 neural foramens) and three lumbar levels (6 neural foramens) were evaluated in 6, 16 and 10 patients, respectively. Total 136 neural foramens from all 32 patients were studied. Twenty-four patients (75%) with 74 foraminal stenosis (54.4%) were surgically demonstrated. Only six neural foramens from three patients were concluded having stenosis by direct visualization without surgical probing. The most common level of foraminal stenosis was L4-L5 (23.5%), followed by L3-L4 (17.6%) and L5-S1 (13.3%), respectively. The surgical findings showed in (Table 3). |
| |
|
|
Table 3: Surgical findings for lumbar foraminal stenosis in 32 patients. |
|
| |
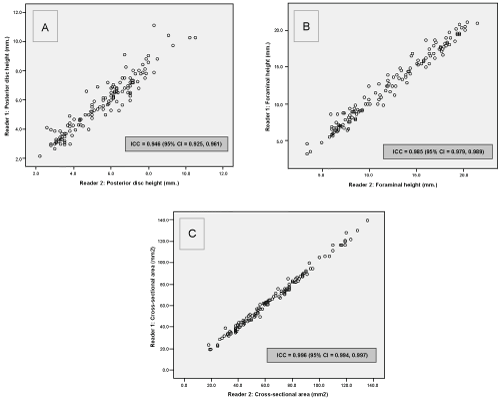
| For the quantitative MRI measurement data including posterior disc height, foraminal height and cross-sectional area of neural foramen, there were excellent agreement between two radiologists by means of the Intraclass Correlation Coefficients (ICC) which were 0.946, 0.985 and 0.996, respectively (Figure 3). When compared to the surgical findings, there were statistical significant (p<0.001) of all MRI measurement parameters including posterior disc height, foraminal height and cross-sectional area of neural foramen as shown in (Table 4 and Figure 4). |
| |
|
|
Figure 3 A-C: These dot graphs demonstrated excellent agreement between both radiologists in measurement of three parameters including posterior disc height (A), foraminal height (B) and cross-sectional area (C). Also showed the Intraclass Correlation Coefficients (ICC) and 95% confidence interval (95%CI) of each parameters. |
|
| |
|
|
Figure 4 A-C: These graphs demonstrated correlation of MRI measurement parameters including posterior disc height (A), foraminal height (B) and cross-sectional area (C) to surgical probing results which were devided in each lumbar level. There were statistical significant (p<0.001) in all of these MRI parameters. |
|
| |
|
|
Table 4: Comparative MRI measurement parameters and surgical findings (n=136). |
|
| |
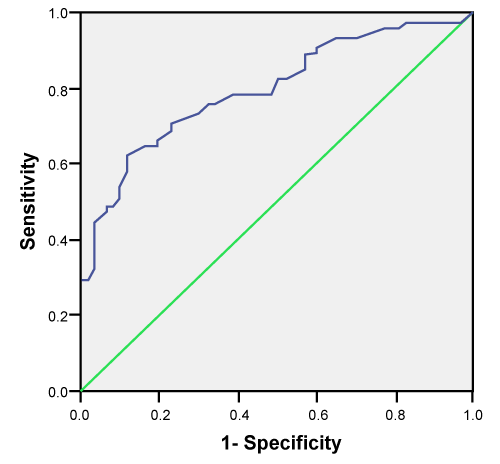
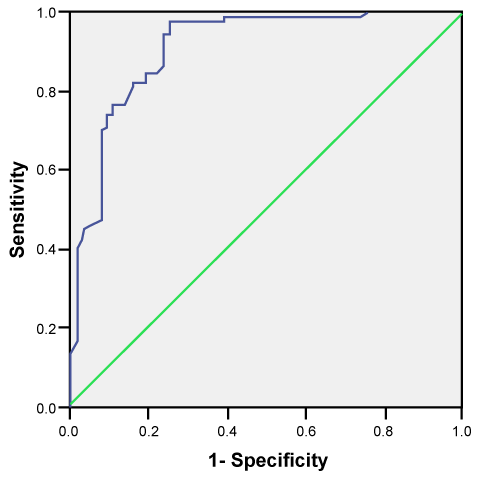
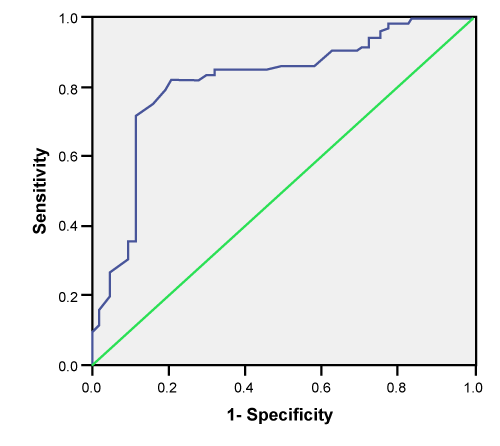
| Using the critical posterior disc height of 4 mm or less for diagnosis foraminal stenosis [15], the sensitivity, specificity, accuracy, PPV and NPV were 40.5%, 96.8%, 66.2%, 93.8% and 57.7%, respectively (Table 5). The corresponding values using critical foraminal height of 15 mm or less were 97.3%, 72.6%, 86%, 80.9% and 95.7%, respectively (Table 6). The ROC curves of posterior disc height (Figure 5), foraminal height (Figure 6) and cross-sectional area (Figure 7) for diagnosis of foraminal stenosis were also obtained. |
| |
|
|
Figure 5: The ROC curve of posterior disc height measurement in diagnosis of foraminal stenosis by using surgical findings as standard reference. The area under curve = 0.799 (95% CI = 0.726, 0.873). |
|
| |
|
|
Figure 6: The ROC curve of foraminal height measurement in diagnosis of foraminal stenosis by using surgical findings as standard reference. The area under curve = 0.909 (95% CI = 0.859, 0.960). |
|
| |
|
|
Figure 7: The ROC curve of cross-sectional area measurement in diagnosis of foraminal stenosis by using surgical findings as standard reference. The area under curve = 0.818 (95% CI = 0.743, 0.893). |
|
| |
|
|
Table 5: Comparative critical posterior disc height with surgical findings (n=136). |
|
| |
|
|
Table 6: Comparative critical foraminal height with surgical findings (n=136). |
|
| |
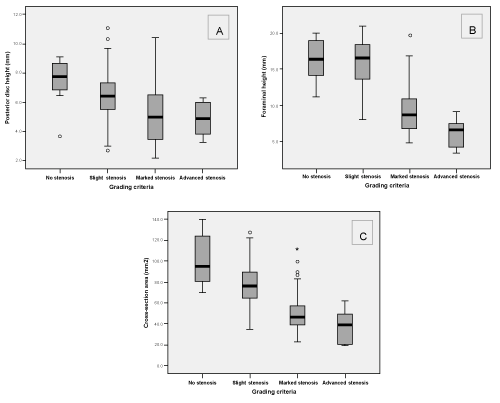
| Almost perfect interobserver agreement for MRI grading score of foraminal stenosis by two radiologists, K = 0.87 (95% CI = 0.81, 0.93). The consensus grading score were used to compare with the surgical findings and also to correlate with MRI measurement parameters. Significant difference between each grading score to diagnose lumbar foraminal stenosis was shown (Table 7). Significant difference of each MRI measurement parameters when correlated to the MRI grading scale was also established (Table 8 and Figure 8). |
| |
|
|
Figure 8 A-C: Demonstrated correlation of each MRI measurement parameters including posterior disc height (A), foraminal height (B) and cross-sectional area (C) to the MRI grading score (0-3) that represented no stenosis, slight, marked and advanced foraminal stenosis, respectively. There were statistical significant (p<0.001) in all of these MRI parameters. |
|
| |
|
|
Table 7: Comparative each MRI grading score and surgical findings (n=136). |
|
| |
|
|
Table 8: Comparative each MRI grading score and measurement parameters. |
|
| |
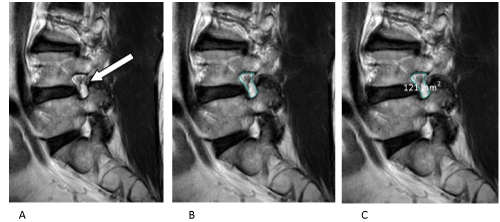
| If subdivided the MRI grading scores into two subgroups and correlated these to the surgical findings, the first subgroup (MRI grade 0-1) possibly represented intraoperative non-stenosis and the latter (MRI grade 2-3) may be corresponded to surgically proved foraminal stenosis. The sensitivity, specificity, accuracy, PPV and NPV were 83.8%, 90.3%, 86.8%, 91.2% and 82.4%, respectively. Representative cases of each MRI grading score are shown in (Figure 9-12). |
| |
|
|
Figure 9 A-C: A 58-year-old man presenting with radiculopathy and neurogenic claudication over 1 years ago. Sagittal SE T2-weighted (A) image (3.0 Tesla) showed normal dorsolateral border of the intervertebral disc and normal form at the foraminal epidural fat of right L4-L5 level, compatible with grade 0 or normal foramen. Posterior disc height and foraminal height were measured about 5.3 mm and 20.1 mm, respectively. Cross-sectional area (B, C) was measured about 121 mm2. Surgical findings suggested no foraminal stenosis at this level. |
|
| |
|
|
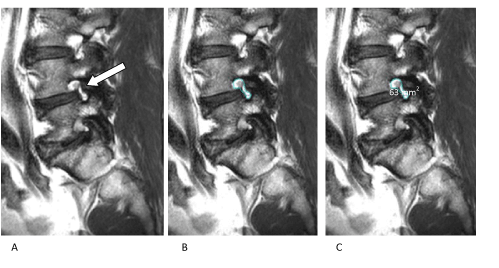
Figure 10 A-C: A 54-year-old man presenting with radiculopathy and numbness over 2 years ago. Sagittal SE T2-weighted (A) image (3.0 Tesla) showed slight foraminal stenosis and deformity of the epidural fat at right L4-L5 level (arrow), with the remaining fat still completely surrounding the exiting nerve root, compatible with grade 1 or slight foraminal stenosis. Posterior disc height and foraminal height were measured about 6.6 mm and 14.4 mm, respectively. Cross-sectional area (B, C) was measured about 63 mm2. Surgical findings suggested no foraminal stenosis at this level. |
|
| |
|
|
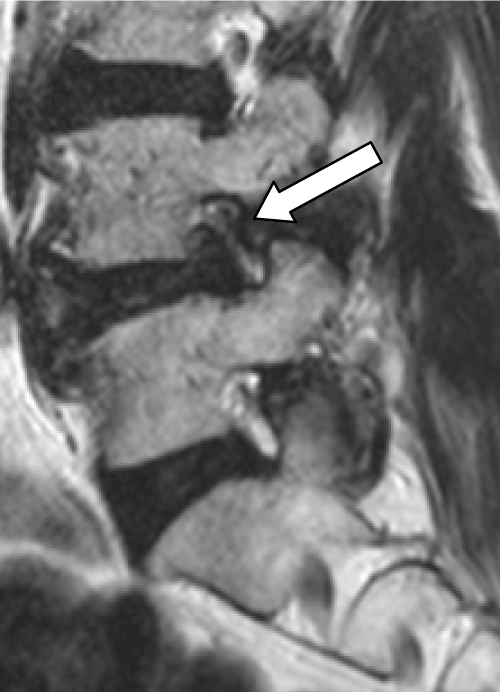
Figure 11: A 60-year-old woman presenting with chronic low back pain, radiculopathy and neurogenic claudication over 3 years ago. Sagittal SE T2- weighted image (3.0 Tesla) showed marked foraminal stenosis, with epidural fat only partially surrounding the nerve root at right L4-L5 level (arrow), compatible with grade 2 or marked foraminal stenosis. Posterior disc height and foraminal height were measured about 6.3 mm and 15.5 mm, respectively. Cross-sectional area was measured about 54 mm2. Surgical findings suggested foraminal stenosis at this level. |
|
| |
|
|
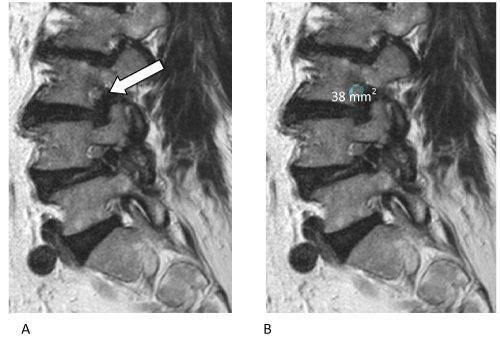
Figure 12: A 58-year-old man presenting with radiculopathy and numbness over 2 years ago. Sagittal SE T2-weighted (A) image (1.5 Tesla) showed obliteration of the epidural fat at left L3-L4 level (arrow), compatible with grade 3 or advanced foraminal stenosis. Posterior disc height and foraminal height were measured about 6.3 mm and 7.9 mm, respectively. Cross-sectional area (B) was measured about 38 mm2. Surgical findings suggested foraminal stenosis at this level. |
|
| |
| Discussion |
| |
| Lumbar foraminal stenosis often accompanies central canal stenosis. Failure to recognize the foraminal component may result in residual symptoms following decompression of the central canal [2] or failed back surgery syndrome and because the surgical treatment for foraminal stenosis differs greatly from that for lateral recess stenosis [3,4]. Therefore, preoperative identification of foraminal stenosis is important. Although MRI is widely used in lumbar spinal stenosis patients, there are not much previous radiologic studies reported about the presurgical MRI diagnosis of foraminal stenosis, and most are cadaveric studies or are performed in asymptomatic volunteers. |
| |
| Hasegawa et al. [15], cryomicrotome study in eighteen fresh cadavera, had been reported that the critical dimensions of a posterior disc height of 4 mm. or less and a foraminal height of 15 mm. or less were associated with foraminal stenosis in the lumbar spine. By correlation to the evidence of nerve root compression on the specimens that was identified by inspection. |
| |
| Naftaly et al. [11], cadaveric study, assessment of three fresh human lumbar spines which were examined using 3 different MRI scanners. They reported poor interobserver reliability by using the Wildermuth classification system and significant differences between foraminal measurement carried out on MRI and on the specimens. |
| |
| In our study, prospective study is conducted to assess preoperative MRI diagnosis of foraminal stenosis in the symptomatic lumbar spinal stenosis patients in whom need surgical treatment, by means of quantitative MRI parameters and qualitative grading system. Using the operative findings as the standard reference. Total 32 patients, equally men and women, are enrolled into this study, mean age about 63.6 years. The mean duration between MRI and operation is 59 days. Most common clinical manifestation are radiculopathy and neurogenic claudication which could be represented as significant clinical symptoms. The most indication for surgical treatment is significant impaired quality of life (68%). |
| |
| Total 136 neural foramens of L3-L4, L4-L5 and L5-S1 levels are surgically evaluated. Exception for 6 foraminal stenosis from 3 patients are diagnosed by direct inspection without probing because of severe entrapment by surrounding tissue. The disease prevalence among patients is 75% (24 of 32 patients). The disease prevalence among foramens is 54.4% (74 of 136 foramens). These are much higher than prior study of Aota et al. [8] that are 26% (23 of 90 patients) and 3% (25 of 936 foramens), respectively. These could be presumed that most of patients in this studied population may have longer period of symptoms. |
| |
| Foraminal stenosis is most commonly identified at L4-L5 level, followed by L3-L4 level which are unlike the previous report by Jenis et al. [3] found that most common involved at L5-S1 level, followed by L4-L5 level. |
| |
| Between two radiologists, there are excellent interobserver agreement in quantitative MRI measurement of the posterior disc height, foraminal height, and cross-sectional area. Almost perfect interobserver agreement for qualitative MRI grading score for evaluation the severity of foraminal stenosis. |
| |
| Regarding to each of three quantitative MRI measurements using in the present study, there are significant statistical difference between surgically proved non-stenotic group and another foraminal stenotic group. In the non-stenotic group, the mean of posterior disc height, foraminal height, and cross-sectional are 6.81±1.51 mm, 16.24±3.56 mm and 80.92±25.05 mm2, respectively. But the mean of posterior disc height, foraminal height, and cross-sectional area in the foraminal stenosis group are 4.92±1.75 mm, 9.32±3.17 mm and 51.91±19.84 mm2, respectively. By means of the critical posterior disc height of 4 mm or less for diagnosis foraminal stenosis show higher specificity (96.8%) and PPV (93.8%) when compare to the critical foraminal height of 15 mm or less, specificity (72.6%) and PPV (80.9%). However, relatively lower sensitivity of critical posterior disc height (40.5%) is established. Subsequent to the report by Hasegawa et al. [15] performing in cadavers, there is no the published data reported about using these critical heights for diagnosis of foraminal stenosis in the living patient. Accordingly, the critical posterior disc height of 4 mm or less could be valuable supported in presurgical diagnosis of foraminal stenosis. |
| |
| Regarding to the qualitative MRI grading system ranging from grade 0 to grade 3, there are statistical significant when correlate to the surgical findings. There are statistical significant between each of three quantitative MRI parameters and the qualitative MRI grading system. When subdivide all four MRI grading scores into two subgroups, the first one (MRI grade 0-1) that possibly correlates to intraoperative nonstenosis and the latter (MRI grade 2-3) that may be corresponded to surgically proved foraminal stenosis, there are statistical significance. The sensitivity, specificity, accuracy, PPV and NPV were 83.8%, 90.3%, 86.8%, 91.2% and 82.4%, respectively. From that reason, MRI grade 2 and 3 may be represented clinically significance and may be the strong indicator for judgment of additional foraminotomy in symptomatic lumbar spinal stenosis patients. |
| |
| Limitation of this study, one is different patients’ position during the MRI scan in supine compared to prone position in the operative room. This may give some different in size of neural foramen. Second, the MRI are obtained in static supine position which is non-axial loading and may not show the actual foraminal size when standing or walking. Because lumbar spinal stenosis is a dynamic phenomenon that typically worsens in the upright, weight bearing and extended position [20-22]. Third in our study, the intraoperative probing is performed after the laminectomy. This method may not correlated with the symptom of the patients. Therefore, some of an overdiagnosis could be occurred in this study. The ideal method to confirm the diagnosis of foraminal stenosis is selective decompression of that affected foramen with significant clinical improvement after interval follow up. Nevertheless, in generally, there is relative small patient population with having only foraminal stenosis who present with leg pain without neurogenic claudication or back pain. On the other hand, the larger patient population are combination of central canal stenosis with lateral recess stenosis and/or foraminal stenosis [1] that are considered to achieve decompressive laminectomy with or without foraminotomy in the same operative setting. |
| |
| Further prospective study with dynamic MRI scan and using clinical follow up may offer more definite results to confirm these findings. |
| |
| Conclusion |
| |
| Both of quantitative measurement parameters including posterior disc height, foraminal height, cross-sectional area and qualitative MRI grading system assessing on sagittal MR image are helpful for preoperative diagnosis of foraminal stenosis and have correlated well with the surgical findings. Among of these variables, by means of critical posterior disc height of 4 mm or less demonstrated highest specificity and positive predictive value. In addition, MRI grade 2 and 3 might be clinically significance and be the indicator for judgment of additional foraminotomy in symptomatic lumbar spinal stenosis patients. |
| |
| Acknowledgement |
| |
| The authors want to express their gratitude to the statistician, Chulaluck Komoltri for assisting the statistical analysis. |
| |
| |
| References |
| |
- Saifuddin A (2000) The imaging of lumbar spinal stenosis. Clin Radiol 55: 581-594.
- Ostlere S, Javid M (2005) Radiculopathy. Imaging 17: 208-25.
- Jenis LG, An HS (2000) Spine update. Lumbar foraminal stenosis. Spine (Phila Pa 1976) 25: 389-394.
- Kunogi J, Hasue M (1991) Diagnosis and operative treatment of intraforaminal and extraforaminal nerve root compression. Spine (Phila Pa 1976) 16: 1312-1320.
- Porter RW, Hibbert C, Evans C (1984) The natural history of root entrapment syndrome. Spine (Phila Pa 1976) 9: 418-421.
- Vanderlinden RG (1984) Subarticular entrapment of the dorsal root ganglion as a cause of sciatic pain. Spine (Phila Pa 1976) 9: 19-22.
- Weishaupt D, McCall I (2005) Degenerative Diseases of the Spine, IDKD; 132-37.
- Aota Y, Niwa T, Yoshikawa K, Fujiwara A, Asada T, et al. (2007) Magnetic resonance imaging and magnetic resonance myelography in the presurgical diagnosis of lumbar foraminal stenosis. Spine (Phila Pa 1976) 32: 896-903.
- Burton CV, Kirkaldy-Willis WH, Yong-Hing K, Heithoff KB (1981) Causes of failure of surgery on the lumbar spine. Clin Orthop Relat Res : 191-199.
- Annertz M, Holtås S, Cronqvist S, Jönsson B, Strömqvist B (1990) Isthmic lumbar spondylolisthesis with sciatica. MR imaging vs myelography. Acta Radiol 31: 449-453.
- Attias N, Hayman A, Hipp JA, Noble P, Esses SI (2006) Assessment of magnetic resonance imaging in the diagnosis of lumbar spine foraminal stenosis--a surgeon's perspective. J Spinal Disord Tech 19: 249-256.
- Wildermuth S, Zanetti M, Duewell S, Schmid MR, Romanowski B, et al. (1998) Lumbar spine: quantitative and qualitative assessment of positional (upright flexion and extension) MR imaging and myelography. Radiology 207: 391-398.
- Cramer GD, Cantu JA, Dorsett RD, Greenstein JS, McGregor M, et al. (2003) Dimensions of the lumbar intervertebral foramina as determined from the sagittal plane magnetic resonance imaging scans of 95 normal subjects. J Manipulative Physiol Ther 26: 160-170.
- Hasegawa T, Mikawa Y, Watanabe R, An HS (1996) Morphometric analysis of the lumbosacral nerve roots and dorsal root ganglia by magnetic resonance imaging. Spine (Phila Pa 1976) 21: 1005-1009.
- Hasegawa T, An HS, Haughton VM, Nowicki BH (1995) Lumbar foraminal stenosis: critical heights of the intervertebral discs and foramina. A cryomicrotome study in cadavera. J Bone Joint Surg Am 77: 32-38.
- Patrick M (2008) Other disorders of the spine. In: Canale T and Beaty J, editors. Campbell’s operative orthopaedics. 11th ed. Mosby, Elsevier; p.2274-84.
- Rosner B (1995)editor. Fundamentals of biostatistics. 4th ed. Belmont, CA: Duxbury Press;. p. 518–21.
- Landis JR, Koch GG (1977) The measurement of observer agreement for categorical data. Biometrics 33: 159-174.
- Svanholm H, Starklint H, Gundersen HJ, Fabricius J, Barlebo H, et al. (1989) Reproducibility of histomorphologic diagnoses with special reference to the kappa statistic. APMIS 97: 689-698.
- Inufusa A, An HS, Lim TH, Hasegawa T, Haughton VM, et al. (1996) Anatomic changes of the spinal canal and intervertebral foramen associated with flexion-extension movement. Spine (Phila Pa 1976) 21: 2412-2420.
- Schmid MR, Stucki G, Duewell S, Wildermuth S, Romanowski B, et al. (1999) Changes in cross-sectional measurements of the spinal canal and intervertebral foramina as a function of body position: in vivo studies on an open-configuration MR system. AJR Am J Roentgenol 172: 1095-1102.
- Weishaupt D, Schmid MR, Zanetti M, Boos N, Romanowski B, et al. (2000) Positional MR imaging of the lumbar spine: does it demonstrate nerve root compromise not visible at conventional MR imaging? Radiology 215: 247-253.
|
| |
| |