| Research Article |
Open Access |
|
| Salah AH Saleh* |
| Salah AH Saleh, College of Science, Al-Nahrain University, Baghdad-IRAQ |
| *Corresponding author: |
Salah AH Saleh
Al-Nahrain University, Iraq
E-mail: salah_astro_2005@yahoo.com |
|
| |
| Received September 12, 2012; Published September 27, 2012 |
| |
| Citation: Saleh SAH (2012) Temporal Change Detection of AL-Hammar Marsh– IRAQ Using Remote Sensing Techniques. 1:333. doi:10.4172/scientificreports.333 |
| |
| Copyright: © 2012 Saleh SAH. This is an open-access article distributed under the terms of the Creative Commons Attribution License, which permits unrestricted use, distribution, and reproduction in any medium, provided the original author and source are credited. |
| |
| Abstract |
| |
| The Mesopotamian marshlands, the largest wetland in the Middle East and one of the most outstanding in the world have been lost mainly as a result of drainage and damming. The cause of the decline is mainly as a result of damming upstream as well as drainage schemes since the 1970s. The Tigris and the Euphrates are amongst the most intensively dammed rivers in the world. In the past 40 years, the two rivers have been fragmented by the construction of more than 30 large dams, whose storage capacity is several times greater than the volume of both rivers. |
| |
| The immediate cause of marshland loss, however, has been the massive drainage works implemented in southern Iraq in the early 1990s, following the second Gulf War. Satellite images provide hard evidence that the once extensive marshlands have dried-up and regressed into desert, with vast stretches salt encrusted. Recent satellite imagery shows only limited areas of the marshlands have been reclaimed. |
| |
| The objective of this study was to develop a land cover change detection methodology through digital analysis of satellite data. Two Landsat Images, MSS and TM of AL-Hammarmarsh south of Iraq acquired in 1975 and 2002 respectively were selected to demonstrate their usefulness for surface temporal change detection in the Mesopotamian marshlands south of IRAQ. |
| |
| Keywords |
| |
| Mesopotamian marshlands; land cover; Landsat images; Digital analysis; Temporal change detection |
| |
| Introduction |
| |
| In recent years there has been a significant amount of research put forth in the development of change detection methods using remotely sensed data. Scientists studying global change may find the ability to monitor land-surface changes over time the most important use of satellite image data. The repetitive coverage, consistent data characteristics, and digital format of the image data provided by several satellite systems makes their respective data readily conducive to the production of a digital "change" database in which the spatial and temporal dimensions of land-use and land-cover change can be detected and evaluated. |
| |
| Current change detection systems use a variety of image processing tools to make changes visible, but typically rely on manual interpretation by expert analysts to delineate the change areas. Most systems look for changes between only two images: one "before" and one "after". Change-detection techniques in common use include: subtracting spectral bands between the images, subtracting a feature space, principal components analysis, and change vector analysis. |
| |
| Satellite remote sensing is widely accepted as a technique to study land use and land cover change Dynamics. The use of satellite data for compiling land use change area is becoming substitute for data derived from time consuming satellite images interpretation. Better assessment of land use land cover change using digital analysis of remotely sensed satellite data can help decision maker to develop effective plans for the management of land. |
| |
| Numbers of researchers have used remotely sensed satellite data for change detection, and a number of approaches and techniques have been developed. Locating and characterizing areas of significant change using remotely sensed data is important for many applications. These include: resource management, urban planning and impacts of human activities on the environment Landsat satellite imagery reveals that in the last 10 years, wetlands that once covered as much as 20,000 square km (7,700 square miles) in parts of Iraq and Iran have been reduced to about 15 percent of their original size. The ecosystem has been damaged and, as a result, a number of plant and animal species face possible extinction. (UNEP) [1] |
| |
| Two main approaches to digital change detection have been reported. Both involve multi-temporal images and can be categorized as separate data set or single data set analysis. Separate data set analysis involves classification of each-date imagery separately into land cover classes. The results were subsequently compared. Single data set analysis involves co-registering and re-sampling multi-temporal images into the same dataset and matamatical transformation, mainly image differencing and rationing, is then applied to the raw coregistered images to produce a residual image indicating the relative change in reflectance between the two dates. This technique is gives slightly more accurate result (See, for example, Nelson [2], Jenson and Toll [3], Woodwell et al. [4], Singh [5], Quarmby et al.[6]). |
| |
| Digital change detection techniques |
| |
| Change detection is the process of identifying differences in the state of an object or phenomenon by observing it at different times. Change detection generally operates by detecting numerical differences in corresponding pixel values between dates. Many digital algorithms have been applied for change detection purposes [7]. |
| |
| The basic reason in using remote sensing data for change detection is that changes in the object of interest will result in changes in radiance values or local texture that are separable from changes caused by other factors, such as differences in atmospheric conditions, illumination and viewing angle, soil moisture etc. It may further be necessary to require that changes of interest be separable from expected or uninteresting events, such as seasonal, weather, tidal or diurnal effects. |
| |
| Digital change detection techniques may be categorized into two basic approaches: the comparative analysis of independently produced thematic labeling or classifications of imagery from different dates; or simultaneous analysis of multi-temporal data sets. Within these two approaches, there are a number of methods and techniques such as post classification comparison, image rationing and principle components analysis (this list is not exhaustive). |
| |
| Methodology |
| |
| Landsat Multispectral data provide the longest duration archive of moderately high spatial resolution satellite image data for monitoring the types and rates of land-surface change imposed by human activity. The derivation of change information from Landsat data generally consists of co-registering the data of two or more images of the same area acquired at different time; adjusting the radiometric properties of the data to normalize for varying observation and atmospheric conditions; implementing a change detection method on the combined data sets; and producing an output product that can effectively convey land-surface change on an image or in statistical basis. Although the consistent data characteristics of Landsat data enable ready production of change images, the procedures of change image production can also be implemented on multiple data sets of non-similar data characteristics, allowing combination of Landsat MSS data with data from other sensors, such as Landast Thematic Mapper (TM) and SPOT Satellite. |
| |
| The study area covers part of Al Hammar Marshes and Shatt Al- Arab. Two Landsat images of different dates, Landsat MSS 1975 in three bands 4,2,1(near IR-0.8-1.1, red-0.6-0.7 , green-0.50-0.60 micron ) with 80 meters resolution andLandsat TM2002, in three bands 4,3,2 (near IR-0.76-0.90, red-0.63-0.69 , green-0.52-0.60 micron) with 30 meters resolution were used in this work. |
| |
| Used images were preliminarily geometrically corrected. Then, image to image registration was done in order to register the 2002 image with image 1975 (master image). Keeping the root mean square error (RMSE) less than 0.5 pixels, an image to image transformation model (third order polynomial) and nearest neighbor re sampling was calculated. |
| |
| Post-classification comparison as change detection technique is used in this study to compare temporal land cover/land use change in study area. Post classification Involves the classification of each of the images independently, followed by a comparison of the corresponding pixel (thematic) labels to identify areas where change has occurred. There are two general approaches to multispectral classification: supervised classification in which an analyst selects sites of known cover type; and unsupervised (clustering) classification, in which clusters of pixels are generated based on spectral similarities. Both supervised and unsupervised classification requires human expertise to generate the classified imagery. The comparison of separately classified images can be carried out visually, or by computer. Computers are better at quantitative analysis, but humans are able to discern patterns and shape much better, and the effect of mis-registrations may be much reduced. The advantages of post-classification comparison are that it minimizes the search space and the effects of seasonal and atmospheric differences between the scenes. The main problem of this approach is that classification errors, which are usually common, may introduce spurious change detections. Post-classification comparison has been used, e.g., to detect: non-urban to urban or forest to cropland conversion, and changes in general land use, wetlands and forests. |
| |
| Temporal comparison results |
| |
| The change detection procedure used has involved a classified images derived for each date. This approach as described above was performed on un-supervised and supervised classifications of Landsat data from 2 dates and subsequently compares the classified images. Hence the output image was greatly dependent upon the accuracy of the classified images. (Figures 3a, 3b, 3c, 3d) and (Table 1) summarizes the area occupied (number of pixels) by each class of the images (MSS- 1975 and TM-2002) by unsupervised classification methods (K-mean and Iso-data methods). |
| |
|
|
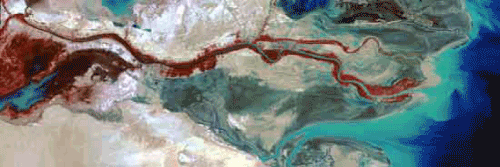
Figure 1a: False-color composite of Landsat 1975 MSS bands 4,2,1. |
|
| |
|
|
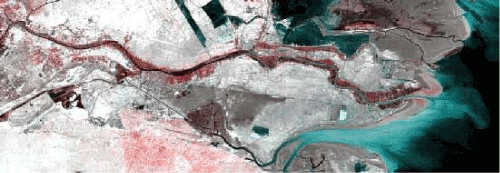
Figure 1b: False-color composite of Landsat 2002 TM bands 4,3,2. |
|
| |
|
|
Figure 2: Resample of Landsat 2002 image. |
|
| |
|
|
Table 1: Unsupervised classification statistics summary report for MSS-1975 and TM-2002 images |
|
| |
| Supervised classification for the images of each date was carried out using minim distance method. The training samples selected were based on land cover and terrain. Six different land cover classes were selected including deep water, shallow water, date palms and weeds, wet land1, wet land2, and dry land. (Figure 4a, b) and (Table 2) summarizes the area occupied (number of pixels) by each class of the images (MSS-1975 and TM-2002) by supervised classification methods (Minim distance method ). |
| |
|
|
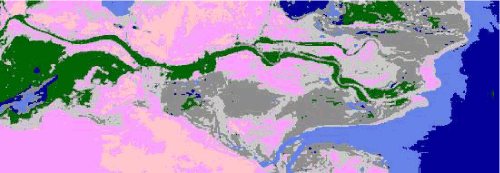
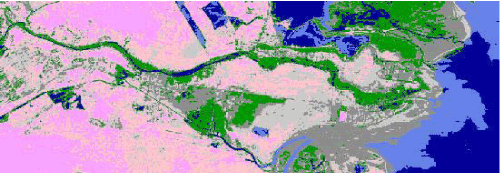
Figure 3a: Unsupervised classification by k -mean and isodata methods for 1975 and 2002 images. (A) Unsupervised classification of 1975-MSS image by isodata method. |
|
| |
|
|
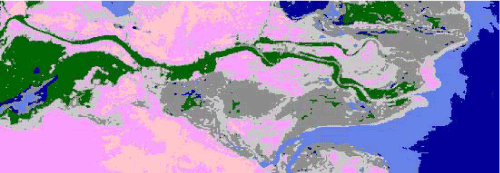
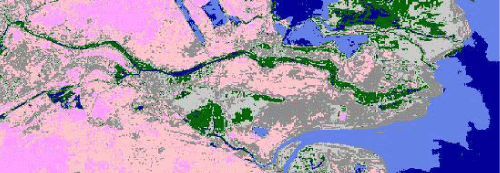
Figure 3b: Unsupervised classification of 1975-MSS image by k-mean method. |
|
| |
|
|
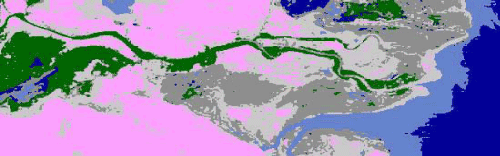
Figure 3c: Unsupervised classification of 2002-TM image by isodata method. |
|
| |
|
|
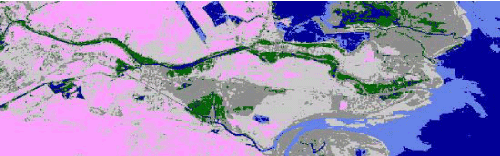
Figure 3d: Unsupervised classification of 2002-TM image by k-mean method. |
|
| |
|
|
Table 2: Supervised classification statistics summary report for MSS-1975 and TM-2002 images. |
|
| |
| (Table 3) shows the result of qualitative evaluation as well as the rate of land use and cover changes carried out through the analysis of unsupervised and supervised classification statistics summary reports. |
| |
|
|
Table 3: Qualitative evaluation of classification statistics summary report. |
|
| |
| Results and Discussion |
| |
| By visual interpretation of landast MSS (1975) and TM (2002) false-color composite images, dense marsh vegetation (marsh grass) appears as dark red patches in 1975 image (Figure 1a). But in 2002 TM image (Figure 1b) most of the Marsh lands had dried out. It appear as olive to grayish-brown patches indicating low vegetation cover on moist to dry ground. The very light to grey patches are an area of expose ground with no vegetation, which may be salt flats where before there were lakes. |
| |
|
|
Figure 4a: Supervised classification by minim distance method for mss-1975 and TM-2002 image. (A) Supervised classification by minim distance method for MSS-1975 image. |
|
| |
|
|
Figure 4b: Supervised classification by minim distance method for TM-2002 image. |
|
| |
| The elongated red patches along the banks of the Shatt Al-Arab River are Date Palm groves. The date palm belt long Shatt Al-Arab appears as a dark red hue in 1975. Healthy vegetation is characterized by a distinctively strong reflectance in the near infrared represented by red tones in these satellite images. In 2002 image, the intensity of infrared reflectance in the date belt had considerably diminished denoted by red brown indicating stressed and dead vegetation, and the replacement of palms by reeds and desert scrub. |
| |
| By applying change detection and considering the output figures and tables, we can find there are noticeable changes in land use/land cover class’s area between 1975 and 2002 images. There are increasing trends to dry land and deep water and decline trends to wet land and shallow water. |
| |
| |
| Statistical analyses of supervised and unsupervised classification results shows that in 2002 an increasing trend in dry land (3.52%) and deep water (1.16%) and decreasing in wet land (1.26%) and shallow water (0.43%) than 1975. There are decline trends in spatial extent of date palm and marsh vegetation areas (3.43%) in 2002 than 1975. |
| |
| These changes caused by IRAQ-IRAN war, and as a result of damming upstream as well as drainage schemes since the 1970s and due to massive drainage works implemented in southern Iraq in the early 1990s, following the second Gulf war. |
| |
| Conclusion |
| |
| The obtained results from temporal classification change detection method showed that there are noticeable and clear changes in the land use and land cover in the area for the period 1972-2002. There are no much differences in classification results for supervised and unsupervised techniques. |
| |
| There are increasing in dry land and deep water areas and decreasing in the wet land and shallow water areas. Also there is decline in spatial extent of date palm and marsh shrubs. These changes caused by IRAQ-IRAN war and as a result of damming upstream as well as drainage schemes since the 1970s. |
| |
| Change detection has become a useful tool for detecting land cover changes from remotely sensed imagery. It has enabled resource managers to observe changes over large areas and provided longterm monitoring capabilities. Generally we can conclude that digital change detection techniques using temporal remote sensing data are useful to assist human analysts of remote sensing data, and provide detailed information for detecting and assessing land cover and land use dynamics. |
| |
| |
| References |
| |
- UNEP (2004) Early Warning and Assessment Technical Report, the Mesopotamian Marshlands: Demise of an Ecosystem, Switzerland.
- Nelson RE (1982) Detecting forest canopy change using Landsat. AgRISTARS Report.
- Jenson JR, Toll DR (1982) Detecting residential Land use development at the Urban fringe, Photogrammetric Engineering and Remote Sensing 48: 629-643.
- Woodwell GH, Hobbie JE, Houghton RA, Mellio JH, peterson BJ, et al. (1983) Deforestation measured by landsat: Steps toward a method DOE/EV 10468 NTTS. spring field .
- Singh A (1986) Change detection in the tropical environment of northeastern India using Landsat remote sensing and tropical Land Management, edited by Eden H.J. Parry J.T. John wiley and sons 36: 365.
- Quarmby AA, Townshend JRG, Cushine JL (1987) Monitoring urban land cover changes at the urban fringe from SPOT HRV imagery in South-east England SPOTI image utilization Assessments results, Centre National D" etudes Spatituble.
- Kwarteng AY, Chavez jr PS (1998) Change detection study of kuwait city and environs using multi–temporal landsat thematic mapper data. International journal of remote sensing 19: 9.
|
| |
| |