Research Article Open Access
Development and Validation of Spectrophotometric and HPLC Method for the Simultaneous Estimation of Salbutamol Sulphate and Prednisolone in Tablet Dosage Form
Sohan S. Chitlange*, Kaushalendra K. Chaturvedi and Sagar B. WankhedePadmashri Dr. D.Y. Patil Institute of Pharmaceutical sciences and Research, Sant Tukaram Nagar, Pimpri, Pune-411018, Maharashtra, India
- *Corresponding Author:
- Dr. Sohan S. Chitlange
Padmashri Dr. D.Y. Patil Institute of Pharmaceutical sciences and Research, Sant Tukaram Nagar
Pimpri, Pune-411018, Maharashtra, India
Tel: +91-9922904305
E-mail: sohanchitlange@rediffmail.com
Received date: December 27, 2010; Accepted date: February 11, 2011; Published date: March 02, 2011
Citation: Chitlange SS, Chaturvedi KK, Wankhede SB (2011) Development and Validation of Spectrophotometric and HPLC Method for the Simultaneous Estimation of Salbutamol Sulphate and Prednisolone in Tablet Dosage Form. J Anal Bioanal Tech 2:117. doi: 10.4172/2155-9872.1000117
Copyright: © 2011 Chitlange SS, et al. This is an open-access article distributed under the terms of the Creative Commons Attribution License, which permits unrestricted use, distribution, and reproduction in any medium, provided the original author and source are credited.
Visit for more related articles at Journal of Analytical & Bioanalytical Techniques
Abstract
Simple, accurate, and reproducible UV spectrophotometric and HPLC method for simultaneous estimation of salbutamol (SAL) and prednisolone (PRE) was developed in the present work. The first developed method was Simultaneous equation method, wavelength selected are 227 nm for salbutamol and 244 nm for prednisolone respectively. Linearity was observed in concentration range of 6-20μg/ml for salbutamol as well as for prednisolone. Second developed method was RP-HPLC method using Thermo C18 column (4.6 mm i.d × 250 mm) and acetonitrile: 0.025M potassium dihydrogen orthophosphate buffer (pH adjusted to 3.5 with orthophosphoric acid) in the ratio of 30:70% v/v as mobile phase. For HPLC method, linearity was observed in the concentration range of 20-100μg/ml for salbutamol as well as for prednisolone and drugs was subjected to oxidation, hydrolysis, and heat to apply stress condition for degradation studies. Results of analysis were validated stastically and by recovery studies.
Keywords
Salbutamol; Prednisolone; Simultaneous equation method; RP-HPLC method
Non-Standard Abbreviations
SAL: Salbutamol sulphate; PRE: Prednisolone
Introduction
Salbutamol sulphate (SAL), chemically known as bis [(1RS)- 2-[(1,1-dimethylethyl) amino]-1-[4-hydroxy-3-(hydroxymethyl) phenyl] ethanol] sulphate, is beta-adrenocepter agonist used for the relief of Broncho-spasm in conditions such as asthma and chronic obstructive pulmonary disease and it is official in Indian pharmacopoeia [1,2]. Chemically Prednisolone(PRE) is a glucocorticoid and its IUPAC name is (8S,9S,10R,11S,13S,14S,17R)-11,17-dihydroxy-17- (2-hydroxyacetyl)-10,13-dimethyl7,8,9,11,12,14,15,16-octahydro-6H cyclopenta[a]phenanthren-3-one. Prednisolone is used as anti-inflammatory or immunesuppressive agent and it is official in India pharmacopoeia [3]. Both the drugs alone or in combination with other drugs are reported to be estimated but do not involve simultaneous determination of SAL and PRE. Detailed survey of literature for SAL revealed several methods based on different techniques such as UV spectrophotometry [4-8], RP-HPLC [9], and TLC [10] for its determination from pharmaceuticals. Similarly survey of literature for PRE alone or in combination with other drugs is reported to be estimated by UV spectrophotometry [11], RP-HPLC [12], matrix solid phase dispersion liquid chromatography [13], and LC-MS [14] for its determination from pharmaceuticals. But no methods have been reported for simultaneous determination of SAL and PRE. Hence in the present work a successful attempt has been made to estimate both these drugs simultaneously by UV spectrophotometric method (Simultaneous equation method [15,16] and HPLC method. To establish stability indicating nature [17] of the LC method, forced degradation of drug substances was performed under stress conditions (thermal, oxidation, acid and base hydrolysis). The proposed methods were optimized and validated as per ICH guidelines.
Experimental
Chemicals
Gift samples of Salbutamol sulphate and Prednisolone were provided by Macleods Pharmaceutical Pvt.Ltd Mumbai (Maharastra) and Lupin laboratories Ltd. Pune (Maharastra) respectively. Acetonitrile and Methanol for chromatography (Qualigens laboratory, Mumbai), Doubled distilled water was used to prepare phosphate buffer solutions for HPLC method. All solutions were prepared daily.
Instrumentation and analytical conditions
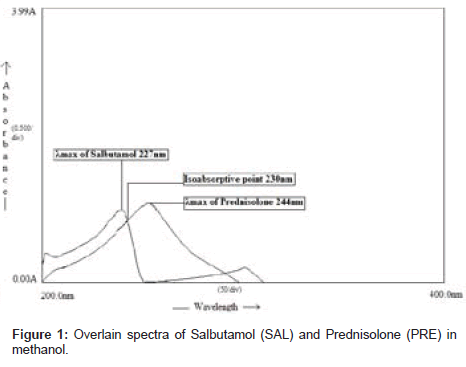
The UV method was performed on a Double-beam Shimadzu UVVisible spectrophotometer, 1700, with spectral bandwidth of 2 nm, wavelength accuracy ± 0.5 nm and a pair of 1-cm matched quartz cells was used to measure absorbance of solution. Working wavelength for UV method was 227nm (λmax of SAL) and 244nm (λmax of PRE).
HPLC method was performed on HPLC system (Merck Hitachi) consisting of quaternary gradient pump, column oven, and UV detector (L-7400) was employed for analysis. Chromatographic data was acquired using Winchrome software. Thermo C18 column (4.6 mm i.d × 250 mm) was used as stationary phase. SAL and PRE was eluted isocratically with a flow rate 1.0 ml/min using a mobile phase consisting of 0.025M phosphate buffer (pH was adjusted to 3.5 using orthophosphoric acid) and acetonitrile in a proportion of 70:30 v/v respectively. The wavelength of UV detector was set to 207nm. The mobile phase was prepared daily, filtered through 0.45µm membrane filter (Milipore) and sonicated before use. The HPLC system was operated at 25± 1°C.
Preparation of standard solutions
UV method: Standard stock solution containing SAL and PRE were prepared by dissolving quantity of Salbutamol sulphate equivalent to SAL base 2.5mg and 2.5mg of PRE separately in 20ml of methanol in separate 25ml volumetric flask and final volume of both solutions were made up to 25ml with methanol to get stock solution containing each of 100µg/ml of SAL and PRE. From these solutions, concentrations of 6-20 µg /ml were made in 10.0ml volumetric flasks.
HPLC method: Standard stock solution of SAL and PRE were prepared by dissolving quantity of Salbutamol sulphate equivalent to SAL base 4.0mg and 4.0mg of PRE separately in 20ml of mobile phase in separate 25ml volumetric flask and final volume of both solutions were made up to 25ml with the same mobile phase and further dilution was made to get 20-100 µg /ml in 10.0ml volumetric flasks.
Preparation of the sample solutions
UV method: Twenty tablets were weighed and average weight was calculated. The tablets were crushed to obtain fine powder. Tablet powder equivalent to 2.0 mg of PRE and 1.6mg of SAL was transferred to 10.0 ml volumetric flask; 5 ml methanol was added and sonicated for 10 min. The volume was then made up to the mark with methanol. The resulting solution was filtered through Whatmann filter paper and filtrate was appropriately diluted to get approximate concentration of 8µg/ml of PRE and 6.4µg/ml of SAL.
HPLC method: Twenty tablets were weighed and average weight was calculated. The tablets were crushed to obtain fine powder. Tablet powder equivalent to 4.0mg SAL and 5.0mg of PRE was taken and dissolved in mobile phase and sonicated for 20min. and then volume was made up to the mark with mobile phase. The resulting solution was mixed and filtered through Whatmann filter paper and filtrate was appropriately diluted to get approximate concentration of 32µg/ml of SAL and 40µg/ml of PRE. The diluted solutions were filtered through 0.20µm membrane filter to get clear solutions.
Procedure for forced degradation study
Degradation studies were performed in solutions containing drug at a concentration of 20µg/ml for SAL and 40µg/ml for PRE. Samples were withdrawn and subjected to HPLC analysis, after suitable dilution. The stress conditions were as follows:
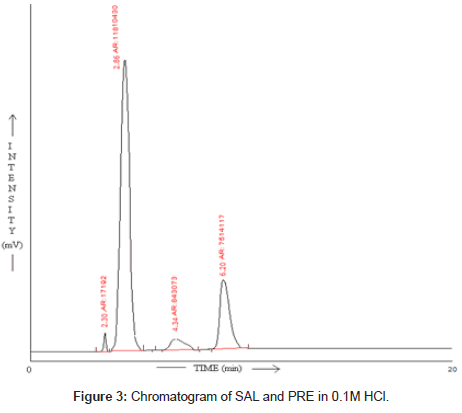
Stress degradation by hydrolysis under acidic conditions: For acid degradation study 1ml of 0.1M HCl was added to final drug solution. And it was refluxed for 2hr at 80° C. After 2hr this solution was injected in stabilized chromatographic condition.
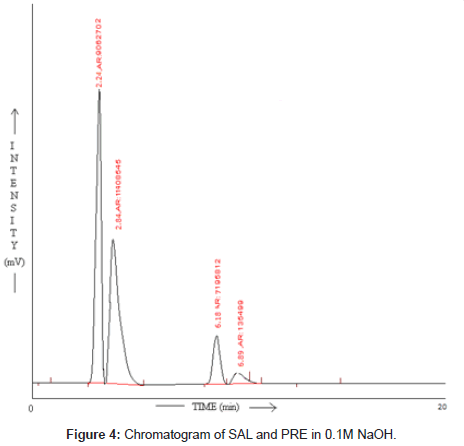
Stress degradation by hydrolysis under alkaline conditions: For alkali degradation study 1ml of 0.1M NaOH was added to final drug solution. And it was refluxed for 2hr at 80° C. After 2hr this solution was injected in stabilized chromatographic condition.
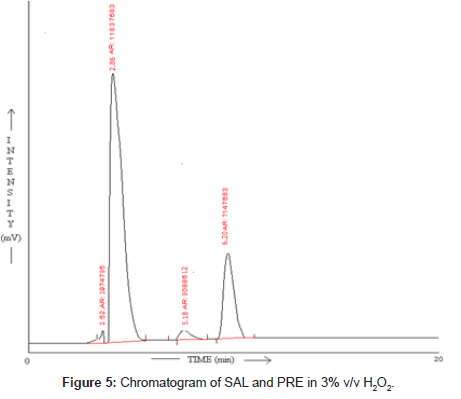
Oxidative degradation: For oxidation study 1ml of 3% v/v H2O2 was added to final drug solution. And it was refluxed for 2hr at 80° C. After 2hr this solution was injected in stabilized chromatographic condition.
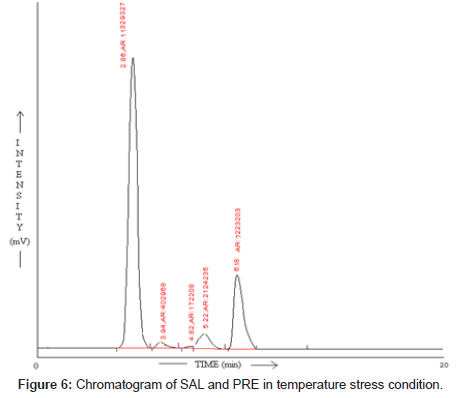
Temperature stress studies: For temperature stress studies final drug solution was refluxed for 2hr at 80°C. And then after 2hr this solution was injected in stabilized chromatographic condition.
Method validation
The methods were validated according to International Conference on Harmonization guidelines for validation of analytical procedures [18].
Linearity: The calibration curve was obtained with concentrations of the standard solutions (6-20µg /ml) for UV method and 20-100µg /ml for HPLC method). The solutions were prepared in triplicate. The linearity was evaluated by regression analysis, which was calculated by the least square regression method.
Precision: Precision of these methods was checked by analyzing the samples at three different time intervals of the same day (intraday precision) as well as on different days (interday precision).
Accuracy: The accuracy of proposed method was determined by recovery studies. It was determined by recovery of known amounts of SAL and PRE reference standard added to the sample at the beginning of the process and all solutions were prepared in triplicate. For recovery studies proportion of SAL and PRE in in-house preparation was made 1:1 by adding reference standard SAL in to tablet powder.
Robustness: Robustness for HPLC method was determined by analysis of samples under deliberately changed chromatographic conditions. The flow rate of the mobile phase was changed from 1ml/min to 0.9ml/min and 1.1ml/min while the ratio of the mobile phase was changed by ± 2%. The effect on retention time and peak parameter were studied.
Limit of detection and limit of quantitation: LOD and LOQ are calculated by using the values of slopes and intercepts of the calibration curves for both the drugs.
Results and Discussion
UV method
The proposed UV method allows a rapid and accurate quantitation of SAL and PRE in in-house tablet preparation without any time-consuming sample preparation. Moreover, the spectrophotometric methods involve simple instrumentation compared with other instrumental techniques. The absorption spectra of SAL and PRE in methanol are shown in Figure 1. Wavelengths selected for analysis are 227nm (λmax of SAL) and 244nm (λmax of PRE). Calibration curves were constructed in the concentration range of (6-20 µg/ml). Beer's law was obeyed over this concentration range, and the coefficient of regression for both the drugs was found to be nearer to 1 (Table 1). Precision was calculated as interday and intraday variations for both the drugs. Percent relative standard deviations for estimation of SAL and PRE under intraday and interday variations were found to be less than 1. Two simultaneous equations (in two variables CSAL and CPRE) were formed using absorptivity coefficient values and these are as follows.
| Drug | Stastical parameters | UV method | HPLC method |
|---|---|---|---|
| SAL | Concentration range (µg/ml) | 6-20 | 20-100 |
| Regression equation | Y=0.038x-0.025 | Y=66370x-46973 | |
| Correlation coefficient | 0.9940 | 0.9980 | |
| PRE | Regression equation | Y=0.046x-0.002 | Y=22501x-18806 |
| Correlation coefficient | 0.9940 | 0.9980 |
Table 1: Results of regression analysis of data for the quantitation of salbutamol(SAL) and prednisolone(PRE) by he proposed methods.
A1(Absorbance at 227nm) = CX (0.03542) + CY (0.0296) (I)
A2 (Absorbance at 244nm) = CX (0.0007) + CY (0.0457) (II)
By solving above simultaneous equation the concentration CSAL (Salbutamol) and CPRE (Prednisolone) was calculated. Table 2 shows the experimental values obtained for the determination of SAL and PRE in samples. A good accuracy of the method was verified with a mean percent recovery in the range of 98.18-99.63% (Table 3).
| Methods | Tablet content | Label claim(mg/tab) | Amount found* | ± RSD* | |
|---|---|---|---|---|---|
| (mg) | (%) | ||||
| UV method | SAL | 4.0 | 3.974 | 99.35 | 0.6694 |
| PRE | 5.0 | 4.943 | 98.86 | 0.5527 | |
| HPLC method | SAL | 4.0 | 4.009 | 100.13 | 0.1474 |
| PRE | 5.0 | 5.072 | 100.43 | 0.0689 | |
* Mean of six estimation.SAL = Salbutamol, PRE= Prednisolone
Table 2: Results of the determination of SAL and PRE in formulation by the proposed methods.
| Level of recovery |
Drug | UV method% Recovery±RSD* |
HPLC method % Recovery±RSD* |
|---|---|---|---|
| 80 | SAL | 98.70 ± 0.6405 | 99.59 ± 0.3567 |
| PRE | 98.61 ± 0.4611 | 100.74 ± 0.5389 | |
| 100 | SAL | 99.02 ± 0.2740 | 98.80 ± 0.1115 |
| PRE | 98.99 ± 0.3952 | 101.43 ± 0.0796 | |
| 120 | SAL | 99.63 ± 0.6404 | 98.66 ± 0.0154 |
| PRE | 98.18 ± 0.3341 | 101.56 ± 0.1413 |
*Mean of three estimations. SAL= Salbutamol, PRE= Prednisolone
Table 3: Experimental values obtained in the recovery test for SAL and PRE in formulation by proposed methods.
HPLC method
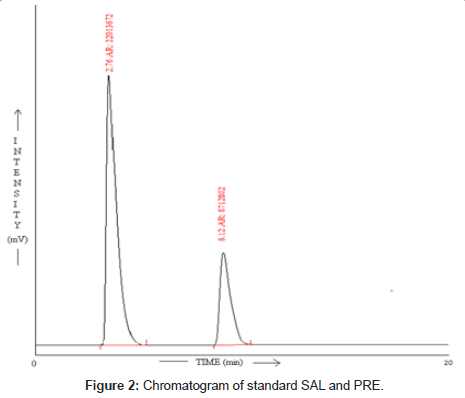
Different proportions of acetonitrile and 0.025M phosphate buffer (pH was adjusted to 3.5 using orthophosphoric acid) was tried for selection of mobile phase. Ultimately, 0.025M phosphate buffer (pH was adjusted to 3.5 using orthophosphoric acid) and acetonitrile in a proportion of 70:30 v/v respectively was finalized as the mobile phase. Figure 2 shows typical chromatogram obtained from the analysis of standard solution of SAL and PRE using the proposed method. The elution order was SAL (Rt = 2.76 min) and PRE (Rt = 6.12), at a flow rate of 1.0 ml/min. The chromatogram was recorded at 207nm as the overlain UV spectra of SAL and PRE showed maximum response at this wavelength.
The calibration curves for SAL and PRE were constructed by plotting concentration versus peak area and showed good linearity in the 20-100 µg/ml, and the coefficient of regression for both the drugs was found to be nearer to 1 (Table 1). The accuracy of proposed method was determined and the mean percent recovery was found in the range of 98.66-101.56% (Table 3) indicating an agreement between the true value and found value. Precision was calculated as interday and intraday variations for both the drugs. Percent relative standard deviations for estimation of SAL and PRE under intraday and interday variations were found to be less than 2. And for robustness studies in all deliberately varied conditions, the RSD were found to be less than 2%. The experimental values obtained for the determination of SAL and PRE in samples are showed in (Table 2).
SAL and PRE was underwent acid hydrolysis, but the rate of hydrolysis was slower as compared to that in alkali. It was depicted in Figure 3. The degradation reaction was more intense and quicker in alkaline condition. And decrease in peak area of both the drug was observed and it was shown in Figure 4. The drug showed lability to hydrogen peroxide. SAL was decomposed to an extent of 13.97% while PRE was decomposed to an extent of 16.72% Additional peak was observed and it was shown in Figure 5. Upon refluxing the drug for 2hr at 80°C fall in the original peak area of both the drugs and additional peaks was observed and it was shown in Figure 6. The percent amount of drug degraded after degradation studies are given in (Table 4).
| Component | % Acid degradation |
% Alkali degradation |
% Oxidative degradation |
% Thermal degradation |
|---|---|---|---|---|
| SAL | 14.16 | 17.09 | 13.97 | 17.66 |
| PRE | 12.45 | 16.16 | 16.72 | 15.84 |
Table 4: Result of stress degradation studies of SAL and PRE.
Conclusion
The two proposed methods based on the spectrophotometry and HPLC were developed and validated as per ICH guidelines. The standard deviation and % RSD calculated for the proposed methods are low, indicating high degree of precision of the methods. The results of the recovery studies performed show the high degree of accuracy for the proposed methods. Hence, it can be concluded that the developed spectrophotometric and chromatographic methods are accurate, pre- cise and selective and can be employed successfully for the estimation of SAL and PRE in bulk and formulation.
Acknowledgement
The authors gratefully acknowledge Dr. P. D. Patil, Chairman, Dr. D. Y. Patil Vidya Pratishthan Society and Dr. A. D. Deshpande, Director of Pharmacy for providing excellent infrastructure facility to carryout this research work. Thanks also go to Macleods Pharmaceutical Pvt. Ltd. Mumbai and Lupin Laboratories Ltd. Pune for providing pure drug samples.
References
- Prabhakaran D, Singh P, Knauja P, Jagnathan K. S, Rawat A, et al. (2004) Modified push-pull osmotic system for simultaneous delivery of theophylline and salbutamol: development and in-vitro characterization. International Journal of Pharmaceutics 284: 95-108.
- Tripathi K D (2008) Drugs for cough and bronchial asthma. Essentials of medical pharmacology, 6th edn Jaypee Brothers Medical Publishers Ltd P: 217-218.
- Tripathi K D (2008) Drugs for cough and bronchial asthma. Essentials of medical pharmacology, 6th edn Jaypee Brothers Medical Publishers Ltd P: 281.
- Dave H N, Mashru R.C, Thakkar A.R (2007) Simultaneous determination of salbutamol sulphate, bromhexine hydrochloride and etofylline in pharmaceutical formulations with the use of four rapid derivative spectrophotometric methods. Analytica Chimica Acta 597: 113-120.
- Mukherji G, Aggarwal N (1991) Derivative UV spectroscopic determination of salbutamol sulphate in the presence of gelatin. International journal of pharmaceutics 71: 187-191.
- Mukherji G. Aggarwal N (1992) Quantitative estimation of salbutamol sulphate by derivative UV spectroscopy in the presence of albumin. International journal of pharmaceutics 86: 153-158.
- Mishra A K, Kumar M, Mishra A, Verma A, Chattopadhyay P (2010) Validated UV spectroscopic method for estimation of salbutamol from tablet formulation. Archives of Apllied Science Research 2: 207-211.
- Parimoo P, Umapathi P, Ilango K (1993) Simultaneous quantitative determination of salbutamol sulphate and bromhexine hydrochloride in drug preparations by difference spectrophotometry. International journal of pharmaceutics 100: 227-231.
- Kasawar Gajanan B, Mazahar Farooqui (2010) Development and validation of stability indicating RP-HPLC method for the simultaneous determination of related substances of albuterol sulphate and ipratropium bromide in nasal solution. Journal of Pharmaceutical and Biomedical Analysis 52: 19-29.
- Dave H N, Mashru R C, Patel A K (2010) Thin layer chromatographic method for the determination of ternary mixture containing salbutamol sulphate, ambroxol hydrochloride and theophylline. International Journal of Pharmaceutical Sciences 2: 390-394.
- Mohamed AEMI, Hesham S, Eman M (2006) Spectrophotometric determination of binary mixtures of prednisolone with some antibiotics. Thai Journal Pharmaceutical Science 30: 63-81.
- AbuRuz S, Millership J, Heaney L, McElnay J (2003) Simple liquid chromatography method for rapid simultaneous determination of prednisolone and cortisol in plasma and urine using hydrophilic, lipophillic balanced solid phase extraction cartridges. Journal of Chromatography B 798: 193-201.
- Desi E, Agnes K, Zoltan P, Aniko K (2008) Analysis of dexamethasone and prednisolone residues in bovine milk using matrix solid phase dispersion liquid chromatography with ultraviolet detection. Microchemical Journal 89: 77-81.
- Frerichs V A, Tornatore K M (2004) Determination of the glucocoticoids prednisone, prednisolone, dexamethasone, and cortisol in human serum usingliquid chromatography coupled to tandem mass spectrometry. Journal of Chromatography B 802: 329-338.
- Chitlange S S, Mulla A I, Pawbake G R, Wankhede S B (2010) Simultaneous spectrophotometric estimation of dexrabeprazole and domperidone in capsule dosage form. International Journal of Pharmaceutical Quality Assurance 2: 31- 34.
- Chitlange S S, Mulla A I, Pawbake G R, Wankhede S B (2010) Simultaneous spectrophotometric estimation of diacerein and aceclofenac in tablet dosage form. Der Pharma Chemica 2: 335-341.
- International Conference on Harmonization (ICH) (2003) Harmonised Tripartite Guideline on, Topic Q1A, Notes for Guidance on stability testing: Stability testing of new drug substances and new drug products. Pub by The European Agency for the Evaluation of Medicinal Products, Human medicine evaluation Unit.
- International Conference on Harmonization (ICH) (1996) Harmonised Tripartite Guideline on, Topic Q2B, Notes for Guidelines for Validation of Analytical Procedures: Methodology: Pub by The European Agency for the Evaluation of Medicinal Products, Human medicine evaluation Unit.
Relevant Topics
Recommended Journals
Article Tools
Article Usage
- Total views: 17636
- [From(publication date):
January-2011 - May 18, 2024] - Breakdown by view type
- HTML page views : 12876
- PDF downloads : 4760

