Research Article Open Access
Medroxyprogesterone Acetate and Progesterone Measurement in Human Serum: Assessments of Contraceptive Efficacy
Molly S Augustine, Andrea E Bonny and Lynette K Rogers*Centers for Perinatal and Clinical and Translational Research, The Research Institute at Nationwide Children’s Hospital, Department of Pediatrics, The Ohio State University, USA
- *Corresponding Author:
- Lynette K Rogers, Ph.D.
Center for Perinatal Research
The Research Institute at Nationwide Children’s Hospital
575 Children’s Cross Road, Columbus, Ohio
Department of Pediatrics, The Ohio State University, USA
Tel: 614-355-6715
Fax: 614-355-6675
E-mail: Lynette.Rogers@NationwideChildrens.org
Received date: December 03, 2013; Accepted date: January 10, 2014; Published date: January 13, 2014
Citation: Augustine MS, Bonny AE, Rogers LK (2014) Medroxyprogesterone Acetate and Progesterone Measurement in Human Serum: Assessments of Contraceptive Efficacy. J Anal Bioanal Tech S5:005. doi: 10.4172/2155-9872.S5-005
Copyright: © 2014 Augustine MS, et al. This is an open-access article distributed under the terms of the Creative Commons Attribution License, which permits unrestricted use, distribution, and reproduction in any medium, provided the original author and source are credited.
Visit for more related articles at Journal of Analytical & Bioanalytical Techniques
Abstract
Medroxyprogesterone (MPA) is widely used as a contraceptive or for hormone replacement therapy after menopause. The use of MPA, specifically in adolescent girls, is linked to excess weight gain and decreases in bone mineral density. Metabolism and clearance of MPA is highly variable making this agent a candidate for individualized dosing strategies which could possibly decrease unwanted side effects. MPA has been measured in animal tissues and fluids for many years as a contaminant resulting from the use of growth hormones in food animals.
MPA has been measured by radioimmunoassay, gas chromatography-mass spectrometry (GC-MS) and liquid chromatography-mass spectrometry (LC-MS/MS). LC-MS/MS techniques have proven to be both more specific than radioimmunoassay and required much simpler sample preparation techniques than GC-MS. Here we describe an LC-MS/MS method specifically designed for monitoring MPA and progesterone levels in human serum. The technique in this report involves minimal sample preparation and yields results with precision and accuracy suitable for clinical use
Keywords
Medroxyprogesterone; LC-MS/MS; Measurement; Human serum
Introduction
Medroxyprogesterone acetate (MPA) is widely used as an injectable contraceptive or as hormone replacement therapy. MPA has also been used to enhance growth in food animals. As such, it provides a significant risk for the population consuming the treated meats [1]. Over the years, multiple methods and techniques have been developed for measuring the levels of hormones such as MPA in animal fat, tissues, plasma, and urine [2-5]. The older techniques included enzyme immune assay [6] and gas chromatography–mass spectrometry [7] but more recently liquid chromatograph-mass spectrometry (LC-MS/MS) techniques have been developed.
In humans, MPA is administered as 150 mg intramuscularly or 104 mg subcutaneously at 3-month intervals as a contraceptive [8,9]. As with many drugs, the prescribed dosages are often higher than necessary for adequate contraceptive efficacy. Although ovulation is reported to resume when MPA serum concentrations decline to <0.1 ng/ml [10,11], several studies have demonstrated serum concentrations at the end of the 3-month dosing interval ranging from <0.04 ng/ml to 2.6 ng/ml with current MPA doses [9,10,12-14]. Moreover, single MPA doses of 25, 50, and 100 mg have been documented to inhibit ovulation for at least 3 months in several clinical studies [15-17]. Therefore, it appears that contraceptive doses of MPA could be lowered at least in certain populations without compromising efficacy.
Side effects of MPA administration can be significant and include decreases in bone mineral density (BMD) and increases in adiposity. In 2004, the FDA issued a black-box warning suggesting a 2-year limit on the use of MPA due to concerns about its effects on BMD [18]. In addition, studies have demonstrated increases in adiposity among adolescent and adult women while on MPA [19,20]. Consequently, personalizing the doses of MPA prescribed to achieve the necessary contraceptive action yet minimize the dose that the patient receives could be of vital importance to mitigate side effects.
Currently, few methods exist that allow for accurate analysis of MPA concentrations in humans to facilitate the physician in optimizing or personalizing doses. The method described in this report offers a reliable, reproducible method for measurement of MPA as well as progesterone (P4) in a single serum sample and could be used to personalize the dosing regimen for individual patients.
Materials and Methods
Materials and chemicals
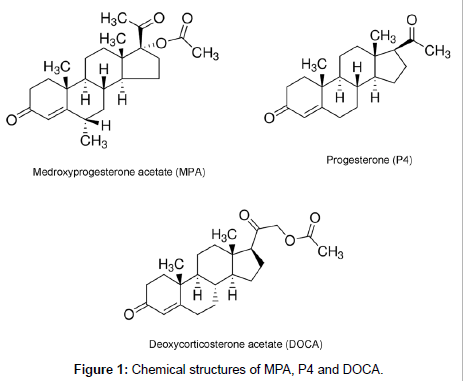
Medroxyprogesterone 17-acetate (MPA), progesterone (P4) and deoxycorticosterone acetate (DOCA) were purchased from Sigma- Aldrich (St. Louis, MO) (Figure 1). The following chemicals were purchased from Fisher Scientific (Pittsburgh, PA): water (HPLC), potassium phosphate dibasic, pentane (HPLC), o-phosphoric acid, potassium hydroxide, methanol (optima LCMS), and formic acid. HPLC grade water was vital to our method as the in-house water (deionized biological grade type 1, 18 mOhm resistivity) contained a contaminant that co-eluted with MPA at its MRM transition.
Stock solutions and standards
Individual stock solutions for MPA and progesterone (P4) were made at a concentration of 1 mg/mL in methanol. Subsequent dilutions were made to yield mixed standards of 500 ng/mL, 50 ng/mL, and 5 ng/ mL in methanol. The internal standard was deoxycorticosterone acetate (DOCA). The DOCA solution was made at 50 ng/mL in methanol. All standards were stored at -20°C. Stock solutions were stable for at least 3 months, dilutions were made monthly. Six calibration standards were prepared daily in extracted control serum matrix at concentrations of 0, 0.05, 0.1, 0.5, 1, 5, and 10 ng/mL with a fixed DOCA concentration at 5 ng/mL (Table 1).
| Q1 | Q3 | Dwell Time | DP | EP | CE | CXP | |
|---|---|---|---|---|---|---|---|
| (amu) | (amu) | (msec) | |||||
| MPA | 387.234 | 327.100 | 100 | 46 | 10 | 19 | 8 |
| MPA | 387.234 | 387.234 | 100 | 46 | 10 | 5 | 2 |
| P4 | 315.246 | 315.246 | 100 | 91 | 10 | 5 | 2 |
| P4 | 315.246 | 297.200 | 100 | 91 | 10 | 23 | 6 |
| DOCA | 373.184 | 373.184 | 100 | 76 | 10 | 5 | 2 |
| DOCA | 373.184 | 331.200 | 100 | 76 | 10 | 25 | 8 |
Bold type indicates transition used for quantitation
Table 1: Precursor and product ions of each analyte and the settings used to generate ion pairs for multiple reaction monitoring.
HPLC mobile phases were as follows: Mobile phase A was 0.1% formic acid in HPLC grade water (Fisher). Mobile phase B was 100% Methanol (Optima Grade, Fisher).
Sample preparation
Blood samples were drawn from patients into serum tubes containing no anti-coagulant and allowed to clot at room temperature for 30 minutes. Serum was separated by centrifugation and samples were stored at -80°C until analysis. Serum samples were thawed on ice and 0.5 mL of serum was transferred into a 10 mL glass centrifuge tube. Samples were run in triplicate which required 1.5 mL of serum per analysis. Each serum sample was spiked with 10 μL of internal standard, 1 mL 100 mM potassium phosphate, pH 9, and 4 mL pentane was added. The mixtures were vortexed thoroughly to mix, shaken for 15 minutes at room temperature, and centrifuged at 1250×g for 5 minutes at 20°C. Occasionally a gel interface formed between the aqueous and organic layers. This was observed more often if the samples were placed on ice or refrigerated for an extended period of time. When this occurred, the samples were vortexed thoroughly and centrifuged at a higher rate to obtain a clean solvent phase separation (approximately 1800-3000×g).
After centrifugation, the organic phase was collected into a separate 10 mL glass centrifuge tube and the extraction was repeated as above with 2 mL pentane. The organic phases from the first and second extraction were combined and subsequently dried under a stream of nitrogen gas. The dried samples were reconstituted in 100 μL HPLC water/methanol (50/50) being cautious to wash down the sides of the tube and mix thoroughly. A brief centrifugation at 1250×g, 2 minutes, 20°C was performed to concentrate the sample in the base of the centrifuge tube. The samples were then transferred into injection vials for analysis by LC/MS/MS.
LC-MS/MS system
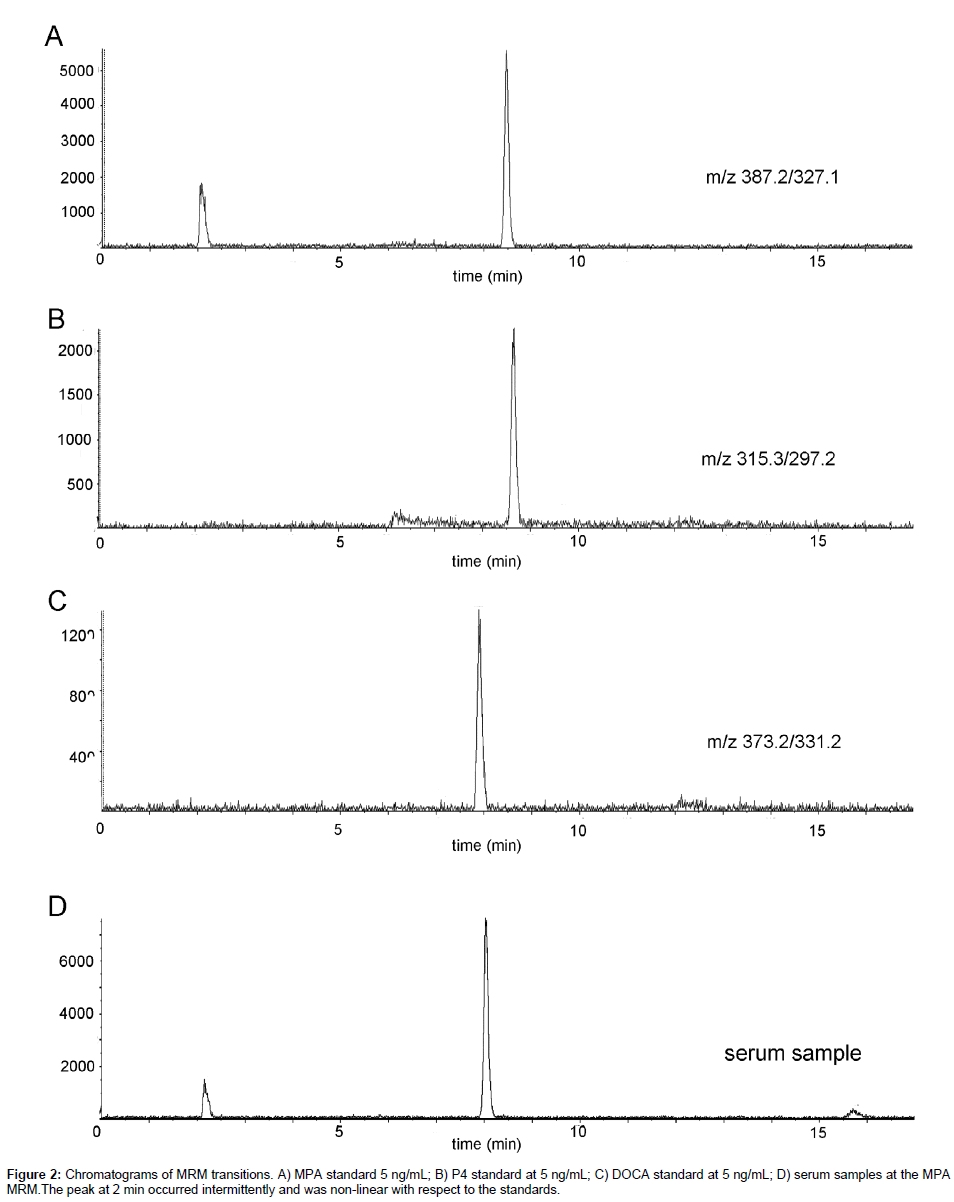
Analyses were performed on an ABI/Sciex 4000 QTrap coupled with a Shimadzu 20 Series HPLC. MPA and P4 were separated using a Zorbax XDB-C8, 4.6 × 150 mm, 5 μm column (Agilent) paired with a matching guard column. Mobile phase A was 0.1% formic acid in HPLC water and mobile phase B was methanol, with the gradient as follows: 60% B for 1 minute, linear to 90% B over 8 minutes, column wash at 90% B for 4 minutes, column re-equilibration at 60% B for 4 minutes resulting in a total run time of 17 minutes. The flow rate of 0.8 mL/min was held constant throughout the method. The column oven was maintained at 32°C throughout the method. The sample injection volume was 25 μL. Ions were generated in positive mode using atmospheric chemical ionization (APCI). The settings were as follows: CUR = 10; CAD = Medium; NC = 3; Temp = 360; GS1 = 30; Q1 and Q3 = Unit. The MRM pairs monitored are indicated in Table 1 (bold type indicates the transition used for quantification) and spectra of the specified transitions are presented in Figure 2.
Results
The standards and samples were analyzed using the MRM transitions noted in Table 1. The method was assessed for recoveries, range and limits of detection, precision, and accuracy.
Range and limits of detection
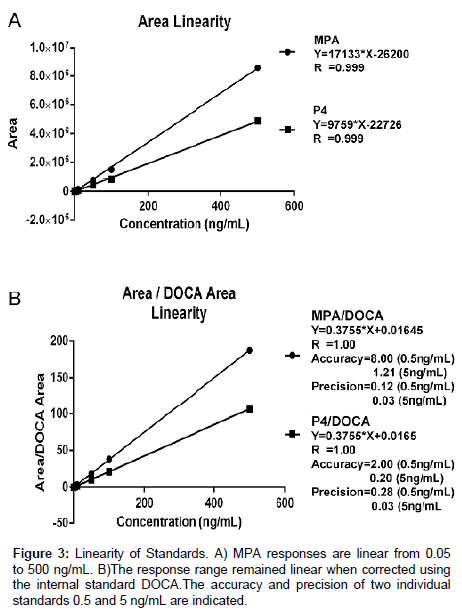
Standards were analyzed with concentrations from 0.005 to 5 ng/ mL to determine the lower limits of detection (LOD). Using a signal to noise ratio of 3:1, concentrations below 0.05 ng/mL were not accurately detectable or in the linear response range. Consequently, the LOD was determined to be 0.05 ng/mL. Subsequently, standards were analyzed with concentrations from 0.05 to 500 ng/mL to determine the range of linear responses. Areas obtained from the MS analyses were plotted against the concentrations injected (Figure 3). Responses to all concentrations tested were linear. However, because ranges higher than 10 ng/mL would not be clinically relevant, higher concentrations were not explored further. The precisions and accuracies of two individual standards (10x) are also indicated on Figure 3.
Reproducibility and recovery
Quality controls were prepared by pooling serum from study participants receiving the currently approved MPA dose of 150mg. The serum from three participants 10 to 11 weeks post-treatment were pooled together for a lower concentration control, while alternatively the serum from three participants 1 to 2 weeks post-treatment were pooled together for a high concentration control. These were stored at -80°C and used for method validation. Data reported in Table 2 indicates the %CV for interday and intraday values for quality control serum. Recovery was calculated from the recovery of the internal standard from the samples after extraction. The mean recovery for all samples was 71.2% (± 12.5%). Individual recoveries of quality control samples are listed on Table 2.
| Mean(SD) ng/mL | Intra-assay CV (%) | Inter-assay CV (%) | Recovery(SD) (%) | |
|---|---|---|---|---|
| MPA | ||||
| Serum, low | 1.06(0.31) | 32.83 | 29.41 | 65.86(12.16) |
| Serum, high | 4.42(1.20) | 10.98 | 27.28 | 61.11(14.22) |
| P4 | ||||
| Serum, low | 0.18(0.08) | 23.59 | 42.18 | * |
| Serum, high | 0.42(0.12) | 14.47 | 27.50 | * |
*Both analytes were measured on a single sample so the recoveries were the same for both
Table 2: Biological sample reproducibility.
Conclusion
Our data demonstrate a robust method for measuring medroxyprogesterone and progesterone in human serum samples. MPA is a potential contaminant in human food with undesirable side effects and the presence of MPA and other gestagens are extensively screened in meat products. For these reasons, MPA has been measured in animal tissues and fluids for many years using a variety of different techniques [2,6,7,21]. The LC-MS/MS techniques have proven to be far less labor intensive than the GC-MS methods used earlier and more specific than the EIA methods.
There is variety among the LC-MS/MS methods including different ionization techniques (electrospray (ESI) [2,22], atmospheric chemical ionization (APCI) [4,5,23] and detectors (ion trap, triple quadrapole) [2,4,21]. Furthermore, these techniques have been optimized for a variety of sample types which include animal fat, muscle, blood, and plasma. For these reasons it is difficult to compare actual analytical parameters. Only a few others have reported LC-MS/MS methods optimized for human serum and/or plasma [21,22].
The analytical method described here is straightforward, the sample preparation is minimal and the quantification provides sufficient sensitivity for clinical application.
This method could be easily translated into clinical practice for personalizing dosing and time interval to optimize contraceptive efficacy while minimizing unwanted side effects.
References
- Andersson AM, Skakkebaek NE (1999) Exposure to exogenous estrogens in food: possible impact on human development and health. Eur J Endocrinol 140: 477-485.
- Malone EM, Elliott CT, Kennedy DG, Regan L (2009) Development of a rapid method for the analysis of synthetic growth promoters in bovine muscle using liquid chromatography tandem mass spectrometry. Anal ChimActa 637: 112-120.
- Rejtharová M, Rejthar L (2013) Development and validation of an LC-MS/MS method for the determination of six gestagens in kidney fats. Food AdditContam Part A Chem Anal Control Expo Risk Assess 30: 995-999.
- Kaklamanos G, Theodoridis GA, Dabalis T, Papadoyannis I (2011) Determination of anabolic steroids in bovine serum by liquid chromatography-tandem mass spectrometry. J Chromatogr B AnalytTechnol Biomed Life Sci 879: 225-229.
- Kaklamanos G, Theodoridis G, Dabalis T (2009) Determination of anabolic steroids in bovine urine by liquid chromatography-tandem mass spectrometry. J Chromatogr B AnalytTechnol Biomed Life Sci 877: 2330-2336.
- Stalker DJ, Welshman IR, Pollock SR (1992) Bioavailability of medroxyprogesterone acetate from three oral dosage formulations. ClinTher 14: 544-552.
- Andrási N, Helenkár A, Záray G, Vasanits A, Molnár-Perl I (2011) Derivatization and fragmentation pattern analysis of natural and synthetic steroids, as their trimethylsilyl (oxime) ether derivatives by gas chromatography mass spectrometry: analysis of dissolved steroids in wastewater samples. J Chromatogr A 1218: 1878-1890.
- (1993) 3-month contraceptive injection approved. FDA Med Bull 23: 6-7.
- Pharmacia & UpJohn Company (2010) Lincomix® Injectable. Division of Pfizer Inc, New York.
- Ortiz A, Hirol M, Stanczyk FZ, Goebelsmann U, Mishell DR (1977) Serum medroxyprogesterone acetate (MPA) concentrations and ovarian function following intramuscular injection of depo-MPA. J ClinEndocrinolMetab 44: 32-38.
- Mishell DR Jr (1996) Pharmacokinetics of depot medroxyprogesterone acetate contraception. J Reprod Med 41: 381-390.
- Kirton KT, Cornette JC (1974) Return of ovulatory cyclicity following an intramuscular injection of medroxyprogesterone acetate (Provera). Contraception 10: 39-45.
- Koetsawang S, Shrimanker K, Fotherby K (1979) Blood levels of medroxyprogesterone acetate after multiple injections of depoprovera or cycloprovera. Contraception 20: 1-4.
- Smit J, Botha J, McFadyen L, Beksinska M (2004) Serum medroxyprogesterone acetate levels in new and repeat users of depot medroxyprogesterone acetate at the end of the dosing interval. Contraception 69: 3-7.
- Fotherby K, Saxena BN, Shrimanker K, Hingorani V, Takker D, et al. (1980) A preliminary pharmacokinetic and pharmacodynamic evaluation of depot-medroxyprogesterone acetate and norethisterone oenanthate.. FertilSteril 34: 131-139.
- Bassol S, Garza-Flores J, Cravioto MC, Diaz-Sanchez V, Fotherby K, et al. (1984) Ovarian function following a single administration of depo-medroxyprogesterone acetate (DMPA) at different doses. FertilSteril 42: 216-222.
- Said S, Omar K, Koetsawang S, Kiriwat O, Srisatayapan Y, et al. (1986) A multicentred phase III comparative clinical trial of depot-medroxyprogesterone acetate given three-monthly at doses of 100 mg or 150 mg: 1. Contraceptive efficacy and side effects. World Health Organization Task Force on Long-Acting Systemic Agents for Fertility Regulation. Special Programme of Research, Development and Research Training in Human Reproduction. Contraception 34: 223-235.
- FDA (2004) Black Box Warning Added Concerning Long-Term Use of Depo-Provera Contraceptive Injection. FDA Talk Paper 2004.
- Clark MK, Dillon JS, Sowers M, Nichols S (2005) Weight, fat mass, and central distribution of fat increase when women use depot-medroxyprogesterone acetate for contraception. Int J Obes (Lond) 29: 1252-1258.
- Bonny AE, Secic M, Cromer BA (2009) A longitudinal comparison of body composition changes in adolescent girls receiving hormonal contraception. J Adolesc Health 45: 423-425.
- Kim SM, Kim DH (2001) Quantitative determination of medroxyprogesterone acetate in plasma by liquid chromatography/electrospray ion trap mass spectrometry. Rapid Commun Mass Spectrom 15: 2041-2045.
- Mortensen SK, Pedersen M (2007) Confirmatory analysis of acetylgestagens in plasma using liquid chromatography-tandem mass spectrometry. Anal ChimActa 586: 217-222.
- Kaklamanos G, Theodoridis G, Dabalis T (2009) Determination of anabolic steroids in muscle tissue by liquid chromatography-tandem mass spectrometry. J Chromatogr A 1216: 8072-8079.
Relevant Topics
Recommended Journals
Article Tools
Article Usage
- Total views: 16116
- [From(publication date):
specialissue-2014 - Sep 20, 2024] - Breakdown by view type
- HTML page views : 11631
- PDF downloads : 4485


