Research Article Open Access
Charge Transfer Spectrophotometric Determination of Zolmitriptan in Pure and Dosage Forms
Ayman A Gouda1,2*, Ragaa El Sheikh1 and Rham M El-Azzazy1
1Department of Chemistry, Faculty of Science, Zagazig University, Zagazig, Egypt
2Makkah Community College, Umm Al-Qura University, Makkah, Saudi Arabia
- *Corresponding Author:
- Ayman A Gouda
Department of Chemistry
Faculty of Science, Zagazig University
Zagazig, Egypt
Tel: +20552423346
Fax: +20552308213
E-mail: aymanchimca@yahoo.com
Received date: September 20, 2012; Accepted date: October 23, 2012; Published date: October 29, 2012
Citation: Gouda AA, Sheikh REl, El-Azzazy RM (2012) Charge Transfer Spectrophotometric Determination of Zolmitriptan in Pure and Dosage Forms. J Anal Bioanal Tech 3:149. doi: 10.4172/2155-9872.1000149
Copyright: © 2012 Gouda AA, et al. This is an open-access article distributed under the terms of the Creative Commons Attribution License, which permits unrestricted use, distribution, and reproduction in any medium, provided the original author and source are credited.
Visit for more related articles at Journal of Analytical & Bioanalytical Techniques
Abstract
A facile, accurate, sensitive and validated spectrophotometric method for the determination of zolmitriptan (ZMT) in pure and dosage forms is described. The methods are based on the formation of charge transfer reactions between ZMT and chromogenic reagents 7,7,8,8-tetracyanoquinodimethane (TCNQ); p-chloranilic acid (P-CLA), quinalizarin (Quiz) and alizarin red S (ARS) producing charge transfer complexes which showed an absorption maximum at 840, 532, 554 and 534 nm for TCNQ, P-CLA, Quiz and ARS, respectively. The optimization of the reaction conditions such as the type of solvent, reagent concentration and reaction time were investigated. Beer’s law is obeyed in the concentration ranges 1.0-140 μg mL-1. The molar absorptivity, Sandell sensitivity, detection and quantification limits are also calculated. The correlation coefficient was ≥0.9991 (n=6) with a relative standard deviation (R.S.D.) of ≤1.01. The proposed methods were successfully applied for simultaneous determination of zolmitriptan in tablets with good accuracy and precision and without interferences from common additives and the validity assesses by applying the standard addition technique, which compared with those obtained using the reported method.
Keywords
Charge transfer reaction; Zolmitriptan; Spectrophotometry; Dosage forms
Introduction
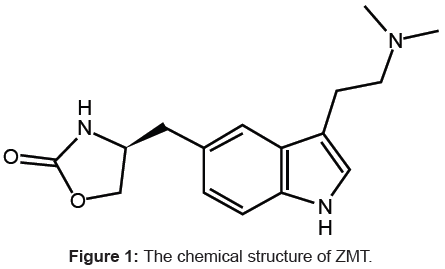
Zolmitriptan (ZMT), 4(S)-4-[3-(2-dimethyl aminoethyl)-1H- 5-indolyl-methyl]-1, 3-oxazolan-2 one (Figure 1) belongs to a group of medicines known as Serotonin 5-HT1D Receptor Agonists. It works by stimulating serotonin receptors in the brain. Serotonin is a natural substance in the brain that, among other things, causes blood vessels in the brain to narrow. It is used to treat severe migraine headaches [1].
The assay of ZMT in pure and dosage forms, as far as we know, is not official in any pharmacopoeia, and therefore, requires much more investigation. The different analytical methods that have been reported for its determination include HPLC with mass spectrometry detection [2-7], with coulometric detection [8], electrospray ionization mass spectrometry [9], tandem mass spectrometry [10], fluorescence detection [11,12] in pharmaceutical preparations and biological fluids and spectrophotometric methods [13-18].
The molecular interactions between electron donors and acceptors are generally associated with the formation of intensely colored charge transfer complexes, which absorb radiation in the visible region [19]. A variety of electron donating compounds have been reported to yield charge-transfer complexes with various π-acceptors [20-25] and with alizarin derivatives [26-29].
The aim of the present study was directed to investigate simple, direct, sensitive and precise spectrophotometric methods for simultaneous determination of ZMT via complexation with π–acceptors; 7,7,8,8-tetracyanoquinodimethane (TCNQ) and P-chloranilic acid (P-CLA) or with alizarin derivatives; quinalizarin (Quiz) and alizarin red S (ARS) as chromogenic reagents in pure form and its dosage forms (tablets).
Materials and Methods
Apparatus
All the absorption spectral measurements were made using Kontron 930 (UV-Visible) spectrophotometer (Germany) with scanning speed 200 nm/min, and band width 1.0 nm equipped with 10 mm matched quartz cells. The pH values of different buffer solutions were checked using a Hanna pH-meter instrument (pH 211, Romania).
Materials and reagents
All chemicals and reagents were of analytical grade and water was always bi-distilled water.
Materials: Zolmitriptan (ZMT) and its formulation No-Migrain tablets (2 mg ZMT per tablet) were kindly supplied by Amoun Pharmaceutical Industries, Cairo, Egypt. Its purity was found to be 99.96 ± 0.64 (n=6) according to the HPLC procedures [1].
A stock solutions of ZMT (100 and 500 μg mL-1) and (5.0×10⁻³ M) were prepared by dissolving the appropriate weight of ZMT in 5.0 mL methanol and the volume was diluted to the mark in a 100 mL calibrated flask with acetonitrile. Working standard solutions were prepared from suitable dilution of the standard stock solution. All solutions are stable for a period of 3.0 days when refrigerated (4°C).
Reagents: 7,7,8,8-tetracyanoquinodimethane (TCNQ), (Aldrich Chem. Co., Milwaukee, USA) and Chloranilic acid (P-CLA), (Fluka, Switzerland), were freshly prepared as (5.0×10⁻³ M) solutions in acetonitrile. Quinalizarin, 1,2,5,8-tetrahydroxyanthraquinone (Quiz) and alizarin red S, 3,4-dihydroxy-9,10-dioxo-2-anthracene sulfonic acid (ARS) were Aldrich products and used without further purification. A stock solution (1.0×10⁻³ M) was prepared by dissolving the appropriate amount of the reagent in approximately 25 mL of methanol. After obtaining a solid-free solution, it was transferred to a 50 mL volumetric flask and completed to the mark with methanol. The solutions were stable for at least one week at 4°C.
General procedures
Using TCNQ and P-CLA reagents: Into 10 ml calibrated flasks were placed 0.2-2.8 mL of (500 μg mL-1) ZMT using P-CLA method and 0.3-3.0 mL of (100 μg mL-1) ZMT using TCNQ method, 1.0 mL of (5.0×10⁻³ M) P-CLA and TCNQ was added. The reaction mixture was heat in a water-bath at 60 ± 2°C for 5.0 and 15 min for P-CLA and TCNQ methods, respectively. Cool and then dilute to volume up to 10 mL with acetonitrile and the absorbance was measured at 532 and 840 nm for P-CLA and TCNQ, respectively against a reagent blank prepared in the same manner.
Using Quiz and ARS reagents: Aliquots of methanolic solutions containing (0.1-2.0 mL) of 100 μg mL-1 ZMT are transferred to 10 mL volumetric flasks. To each flask 1.5 and 2.0 mL of (1.0×10⁻³ M) Quiz and ARS solution, respectively were added. Afterwards, the obtained mixture was shaken in order to promote the reaction and the volume was completed to the mark with methanol. The absorbance of this final solution was measured at 554 and 534 nm for Quiz and ARS, respectively against a reagent blank.
Procedures for pharmaceutical formulations (tablets): The contents of twenty tablets (No-Migrain, 2.5 mg ZMT per tablet) were crushed, finely powdered, weight out and the average weight of one tablet was determined for each drug. An accurate weight equivalent to 25 mg ZMT was transferred into a 100 mL calibrated flask dissolved in 20 mL methanol with shaking for 5.0 min and filtered through a sintered glass crucible (G4). The first 5.0 mL portion of the filtrate was rejected and the filtrate was diluted to 10 mL with acetonitrile using (P-CLA and TCNQ) or methanol using (Quiz and ARS) in a 100 mL measuring flask to give 250 μg mL-1 stock solutions. Aliquot of the cited solutions was taken and analyzed as described under the above recommended procedures for construction of calibration curves. For the proposed methods, the content of a tablet was calculated using the corresponding regression equation of the appropriate calibration graph.
Stoichiometric relationship: Job’s method of continuous variation [30] was employed to establish the stoichiometry of the coloured products. A 1.0×10⁻³ M standard solution of ZMT and a 1.0×10⁻³ solution of reagents were used. A series of solutions was prepared in which the total volume of drug and reagent was constant (2.0 mL). The drugs and reagents were mixed in various proportions and diluted in a 10 mL calibrated flask with acetonitrile using (P-CLA and TCNQ) or methanol using (Quiz and ARS). Measure the absorbance at optimum wavelengths after treating each reagent at best time and temperature against a reagent blank following the above mentioned procedure.
Results and Discussion
In the present investigation, we investigate the development of simple, rapid, accurate, reproducible and adequately sensitive spectrophotometric methods for determination ZMT in bulk powder and pharmaceutical formulation based on the formation of charge-transfer complex between ZMT as electron-donor when they reacted with selected π-acceptors (TCNQ and P-CLA) in acetonitrile or with (Quiz and ARS) in methanolic medium. They produce a new band of absorption intensity at a suitable λmax which was characteristic for each complex (Table 1).
| Parameters | p-CLA | TCNQ | QUIZ | ARS |
|---|---|---|---|---|
| Wavelengths λmax (nm) | 532 | 840 | 554 | 534 |
| Beer’s law limits (µg mL-1) | 10-140 | 3.0-30 | 2.0-20 | 1.0-10 |
| Molar absorptivity ε, (L/mol-1cm-1) x 104 | 0.7287 | 1.045 | 1.286 | 2.0076 |
| Sandell,s sensitivity (ng cm-2) | 39.43 | 274. 9 | 22.35 | 14.31 |
| Regression equation a | ||||
| Slope (b) | 0.0035 | 0.0267 | 0.0394 | 0.0679 |
| Intercept (a) | 0.0027 | - 0.0098 | - 0.0039 | 0.0041 |
| Correlation coefficient (r) | 0.9996 | 0.9991 | 0.9997 | 0.9998 |
| Mean recovery % ± SD | 100.64 ± 0.61 | 99.90 ± 1.01 | 99.66 ± 0.574 | 99.61 ± 0.892 |
| RSD% | 0.614 | 1.01 | 0.576 | 0.895 |
| RE% | 0.644 | 1.06 | 0.605 | 0.94 |
| LOD, (µgmL-1) b | 1.97 | 0.494 | 0.285 | 0.186 |
| LOQ, (µgmL-1) b | 6.57 | 1.65 | 0.95 | 0.619 |
| Calculated t-value c | 1.72 | 0.11 | 0.78 | 0.71 |
| Calculated F-value c | 1.10 | 2.49 | 1.24 | 1.94 |
aA = a + bC, where C is the concentration in μg mL-1, A is the absorbance units, a is the intercept, b is the slope.
bLOD, limit of detection; LOQ, limit of quantification; ε, molar absorptivity.
cThe theoretical values of t and F are 2.57 and 5.05, respectively at confidence limit at 95% confidence level and five degrees of freedom (p= 0.05).
Table 1: Statistical analysis for determination of ZMT by the proposed methods.
Absorption spectra
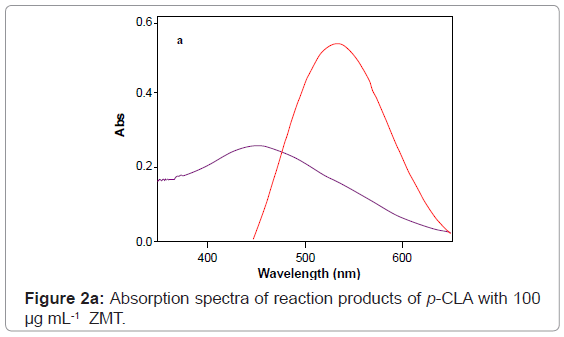
The reaction of ZMT with P-CLA results in the formation of a charge transfer complex of the n–π -type. This compound is considered to be an intermediate molecular association complex which dissociates in the corresponding radical anions in acetonitrile solvent. The P-CLA radical anion absorbs at 532 nm (Figure 2a). The experimental conditions should be carefully selected.
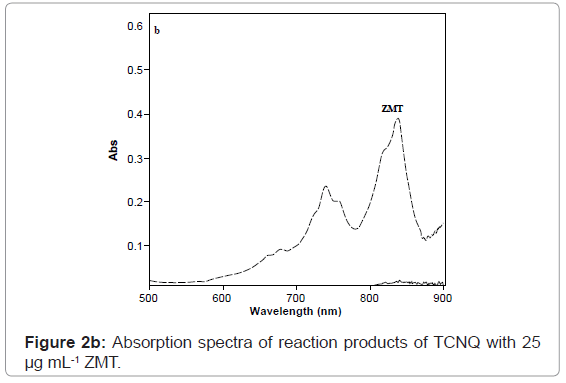
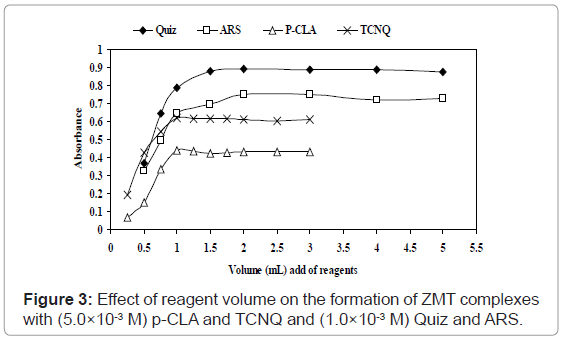
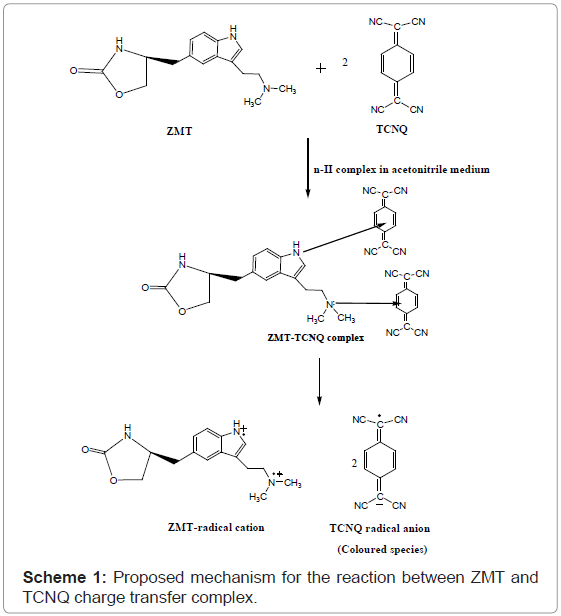
ZMT yields intense color with TCNQ in acetonitrile, absorbing maximally at wavelengths 840 nm (Figures 2b and 3) most probably due to the formation of charge-transfer complexes between the drug acting as n-donor (D) or Lewis base, and TCNQ, as π-acceptors(A) or Lewis acids:
The dissociation of DA complex is promoted by the high dielectric constant of the solvent, acetonitrile (37.5). Further support for the assignment was provided by the comparison of the absorption bands with those of the TCNQ and P-CLA.- radical anions produced by the iodide reduction method.

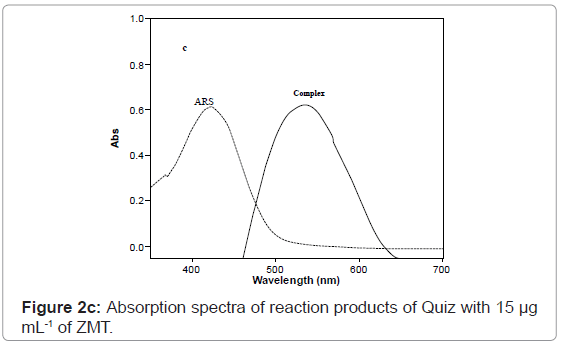
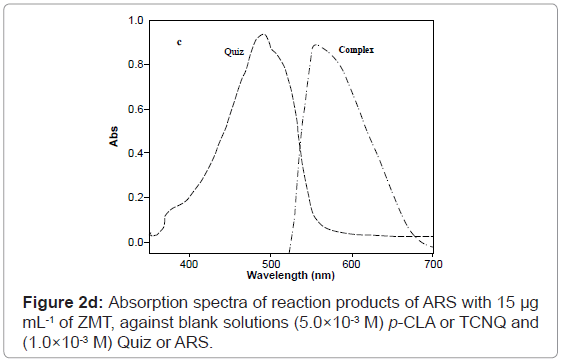
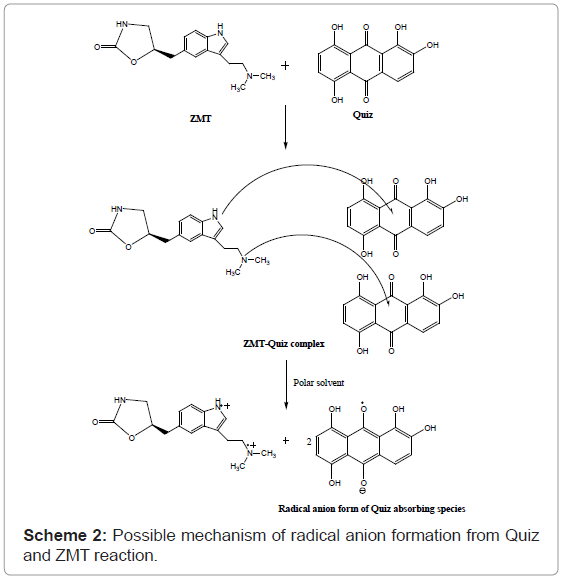
At optimum conditions, the radical anion (absorbing species) was formed in the medium immediately after mixing of the reagents and showed maximum absorption at 554 and 534 nm using Quiz and ARS, respectively in methanol medium (Figures 4 and 5). Thus, these wavelengths were chosen for all further measurements in order to obtain highest sensitivity for the proposed methods. It is important to point out that the Quiz and ARS alone, in methanol medium, exhibits maximum absorption at 491 and 423 nm, respectively (Figures 2c and 2d). The high difference between maxima of the reagent and the product absorption bands ~ 63 or 106 nm for Quiz and ARS respectively allowed the measurement of the products with only a small contribution of the reagents that was added in excess in the medium.
Optimization of the experimental conditions
Evaluation of the effect of the solvent nature: Different solvents such as acetonitrile, acetone, chloroform, methanol, ethanol, 1,4-dioxane, dichloromethane, and 1,2-dichloroethane were examined (Table 2). Acetonitrile was found to be the best solvent for TCNQ and P-CLA reagents, because it has a high relative permittivity which ensures the maximum yield of TCNQ.- and P-CLA.- species, whereas, best sensitivity for Quiz and ARS was achieved with methanol, probably because of the capacity of this solvent to form stable hydrogen bonds with the radical anion.
| Solvent | Absorbance | |||
|---|---|---|---|---|
| p-CLA | TCNQ | Quiz | ARS | |
| Acetonitrile | 0.51 | 0.42 | 0.38 | 0.35 |
| Acetone | 0.07 | 0.23 | 0.19 | 0.18 |
| Chloroform | 0.13 | 0.24 | 0.23 | 0.27 |
| Dichloromethane | 0.17 | 0.22 | 0.17 | 0.26 |
| 1,2-Dichloroethane | 0.19 | 0.17 | 0.14 | 0.20 |
| 1,4-Dioxane | 0.08 | 0.09 | 0.11 | 0.08 |
| Methanol | 0.29 | 0.28 | 0.77 | 0. 68 |
Table 2: Effect of solvent on the absorption intensity of reaction products of ZMT with TCNQ, p-CLA, Quiz and ARS.
Effect of reagents concentration: The optimum concentrations that give maximum color formation, 1.0mL of solution (5.0×10⁻³ M) TCNQ and P-CLA solution in acetonitrile was found to be sufficient for the production of maximum and reproducible color intensity. Higher concentrations of the reagent did not affect the color intensity (Figure 3). For Quiz and ARS, 1.5 and 2.0 mL of (1.0×10⁻³ M) Quiz and ARS reagents, respectively are a sufficient excess of the reagents to consume all drug present in the medium and were established for the method to attain satisfactory sensitivity besides.
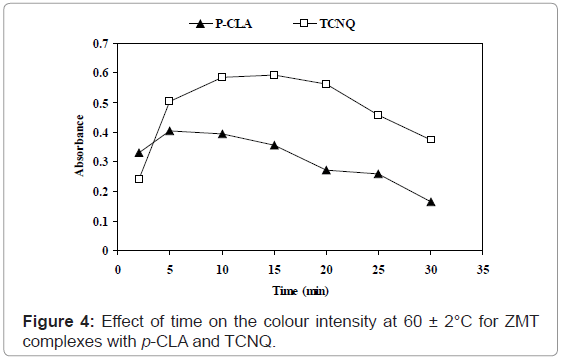
Effect of time and temperature: The optimum reaction time was determined by following the color intensity at optimum wavelengths at ambient temperature (25 ± 2°C). Complete color development was attained after 90 and 50 min for TCNQ and P-CLA complexes, respectively. The complete color development was obtained by raising the temperature to 60 ± 2°C on a water-bath for 15 and 5.0 min using TCNQ and P-CLA, respectively (Figure 4). The colour remained stable for 4.0 and 6.0 h for TCNQ and P-CLA reagent complexes.
For Quiz and ARS reagents, all measurements were carried out after 5.0 min of mixing of the reagents at laboratory ambient temperature (25 ± 2°C). Stable absorbance values were observed from the beginning of the experiment up to 120 min.
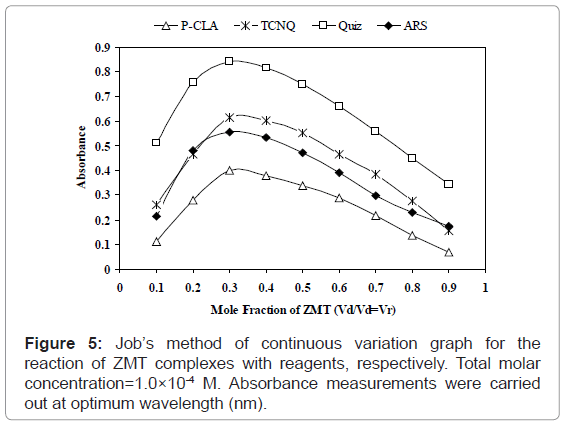
Stoichiometric ratio: The stoichiometric ratio of the reactants was determined by Job’s method of continuous variation and modified by Vosburgh and Coober. Job’s continuous variation graph for the reaction between ZMT and (TCNQ or P-CLA) and (Quiz or ARS) reagents show that the interaction occurs between an equimolar solution of the drug and the reagents. The result indicated that the complex was formed in the ratio of 1:2 (Drug: Reagent) (Figure 5). This finding supports that the interaction of ZMT and the reagents used takes place at two sites, which were the more sterically free terminal basic amino groups. In view of this result a reaction mechanism was proposed considering the transfer of free electron of the two nitrogen atom present in one molecule of drug to the charge-deficient center of reagent molecule from the total transfer of charge. On the basis of the literature data and our experimental results, tentative reaction mechanisms for ZMT-TCNQ and ZMT-Quiz complexes are proposed and given in schemes 1 and 2, respectively.
Validation of the proposed method
Linearity, detection, and quantitation limits: Following the proposed experimental conditions, the relationship between the absorbance and concentration was quite linear in the concentration ranges given in (Table 1). The regression equations were derived using the least-squares method [31]. The intercept (a), slope (b), correlation coefficient (r), molar absorptivities (ε), and sandell sensitivity values are summarized in (Table 1). The percentage recoveries of the pure drugs using the proposed methods compared with that given by the reported methods are illustrated in (Table 1). The validity of the proposed methods was evaluated by statistical analysis [32] between the results achieved from the proposed methods and that of the reported methods. Regarding the calculated Student’s t-test and variance ratio F-test (Table 1), there is no significant difference between the proposed and reported methods regarding accuracy and precision.
The detection limit (LOD) is defined as the minimum level at which the analyte can be reliably detected for the 3 drugs was calculated using the following equation, [32,33] and listed in Table 1.
LOD=3s/k where s is the standard deviation of replicate determination values under the same conditions as for the sample analysis in the absence of the analyte and k is the sensitivity, namely the slope of the calibration graph. In accordance with the formula, the detection limits were found to be 0.494, 1.97, 0.285 and 0.186 μg mL-1 using TCNQ, P-CLA, Quiz and ARS, respectively.
The limits of quantization LOQ, is defined as the lowest concentration that can be measured with acceptable accuracy and precision [32,33]
LOQ = 10s/k
According to this equation, the limit of quantization was found to be 1.65, 6.57, 0.95 and 0.619 μg mL-1 using TCNQ, P-CLA, Quiz and ARS, respectively.
Accuracy and precision: The accuracy and precision of the methods were evaluated by performing six replicate analyses on pure drug solution at four different concentration levels (within the working range). Percentage relative standard deviation (RSD %) as precision and percentage relative error (RE %) as accuracy of the proposed spectrophotometric methods were calculated. The relative standard deviation (RSD) values were less than 2% in all cases, indicating good repeatability of the suggested methods.
The percentage relative error calculated using the following equation:
RE % = [(founded – added) / added]×100
The intra-day and inter-day precision and accuracy results show that the proposed methods have good repeatability and reproducibility (Table 3).
| Methods | Added (μg mL-1) | Intra-day | Inter-day | ||||||
|---|---|---|---|---|---|---|---|---|---|
| Recovery % | Precision RSD % a | Accuracy RE % | Confidence Limitb | Recovery % | Precision RSD % a | Accuracy RE % | Confidence Limitb | ||
| p-CLA | 20 | 99.40 | 0.47 | -0.60 | 19.88 ± 0.089 | 99.70 | 0.76 | -0.30 | 19.94 ± 0.144 |
| 60 | 99.20 | 0.78 | -0.80 | 59.52 ± 0.44 | 100.60 | 0.48 | 0.60 | 60.36 ± 0.276 | |
| 100 | 99.70 | 0.59 | -0.30 | 99.70 ± 0.56 | 99.50 | 0.51 | -0.50 | 99.50 ± 0.483 | |
| 120 | 100.50 | 0.92 | 0.50 | 120.6 ± 1.06 | 99.30 | 0.88 | -0.70 | 119.16 ± 0.999 | |
| TCNQ | 5.0 | 99.35 | 0.64 | -0.65 | 4.968 ± 0.012 | 99.80 | 0.54 | -0.20 | 4.99 ± 0.026 |
| 10 | 100.30 | 0.86 | 0.25 | 10.03 ± 0.082 | 99.45 | 0.70 | -0.55 | 9.945 ± 0.066 | |
| 15 | 99.90 | 1.07 | -0.10 | 14.985 ± 0.15 | 100.35 | 0.96 | 0.35 | 15.05 ± 0.138 | |
| 25 | 99.55 | 0.57 | -0.45 | 24.89 ± 0.135 | 100.10 | 1.03 | 0.10 | 25.03 ± 0.246 | |
| Quiz | 4.0 | 99.50 | 0.68 | -0.50 | 3.98 ± 0.028 | 99.90 | 0.90 | -0.10 | 3.996 ± 0.0377 |
| 8.0 | 99.80 | 1.04 | -0.20 | 7.984 ± 0.087 | 99.30 | 0.55 | -0.70 | 7.944 ± 0.046 | |
| 12 | 99.20 | 0.89 | -0.80 | 11.904 ± 0.11 | 99.10 | 0.71 | -0.90 | 11.892 ± 0.089 | |
| 16 | 98.80 | 1.12 | -1.20 | 15.808 ± 0.186 | 99.00 | 1.16 | -1.00 | 15.84 ± 0.193 | |
| ARS | 2.0 | 99.90 | 0.53 | -0.10 | 1.998 ± 0.011 | 99.20 | 0.61 | -0.80 | 1.984 ± 0.013 |
| 4.0 | 99.30 | 1.20 | -0.70 | 3.972 ± 0.05 | 99.70 | 1.03 | -0.30 | 3.988 ± 0.043 | |
| 6.0 | 99.10 | 0.76 | -0.90 | 5.946 ± 0.047 | 99.10 | 0.87 | -0.90 | 5.946 ± 0.054 | |
| 8.0 | 98.95 | 1.46 | -1.05 | 7.916 ± 0.12 | 100.40 | 1.35 | 0.40 | 8.032 ± 0.114 | |
aMean of six determination, RSD%, percentage relative standard deviation; R.E%, percentage relative error. bMean ± standard error.
Table 3: Evaluation of intra-day and inter-day precision and accuracy obtained by the proposed methods.
Ruggedness and robustness: The ruggedness of the proposed methods was assessed by applying the procedures using two different instruments in two different laboratories at different times and two different analyte. Results obtained from laboratory-to-laboratory and analyst-to-analyst variation were found to be reproducible because the RSD did not exceed 2.0%. Robustness of the procedures was assessed by evaluating the influence of small variation of experimental variables, i.e., concentrations of reagent and reaction time, on the analytical performance of the methods. In these experiments, one experimental parameter was changed while the other parameters were kept unchanged, and the recovery percentage was calculated each time. The small variations in any of the variables did not significantly affect the results. This provided an indication of the reliability of the proposed method during routine work.
Recovery studies: The accuracy and validity of the proposed methods were further ascertained by performing recovery studies. Pre-analyzed tablet powder was spiked with pure ZMT at different levels and the total was determined by the proposed methods using standard addition technique. The percent recovery of pure ZMT added was in the range 98.50–100.50% with relative standard deviation of 0.319-0.716 (Table 4) indicating that the recoveries were good, and that the co-formulated substance and common excipients did not interfere in the determination.
| TCNQ | p-CLA | Quiz | ARS | |||||||||
|---|---|---|---|---|---|---|---|---|---|---|---|---|
| Taken (μg mL-1) | Added (μg mL-1) | Recovery* (%) | Taken (μg mL-1) | Added (μg mL-1) | Recovery* (%) | Taken (μg mL-1) | Added (μg mL-1) | Recovery* (%) | Taken (μg mL-1) | Added (μg mL-1) | Recovery* (%) | |
| 4.0 | - | 99.10 | 20 | - | 99.80 | 4.0 | - | 99.10 | 2.0 | - | 100.30 | |
| 4.0 | 99.80 | 20 | 99.60 | 2.0 | 99.50 | 2.0 | 100.20 | |||||
| 8.0 | 99.45 | 40 | 99.40 | 4.0 | 99.80 | 3.0 | 98.50 | |||||
| 12 | 100.20 | 60 | 99.20 | 8.0 | 99.90 | 4.0 | 99.80 | |||||
| 16 | 99.70 | 80 | 99.75 | 12 | 100.50 | 5.0 | 100.40 | |||||
| 20 | 99.0 | 100 | 99.00 | 16 | 100.30 | 7.0 | 99.50 | |||||
| Mean ± SD | 99.54 ± 0.452 | 99.46 ± 0.317 | 99.85 ± 0.513 | 99.87 ± 0.714 | ||||||||
| V | 0.204 | 0.10 | 0.263 | 0.51 | ||||||||
| R.S.D% | 0.454 | 0.319 | 0.514 | 0.716 | ||||||||
| S.E | 0.184 | 0.129 | 0.209 | 0.291 | ||||||||
aAverage of six determinations.
Table 4: Application of the standard addition technique for the determination of ZMT in No-Migain tablets (2.5 mg ZMT/tab) using the proposed methods.
Interference studies
A study was performed in order to evaluate the effect of possible interfering species on the drug reaction with the reagents. The selectivity of the proposed spectrophotometric methods was investigated by observing any interference encountered from some common excipients of the pharmaceutical formulations such as starch, lactose, sucrose, glucose, gum acacia, and magnesium stearate. It was shown that these excipients did not interfere with the proposed methods. So, the proposed methods are able to determine the analyte in the presence of common excipients.
Application of the proposed methods to analysis of dosage forms
The proposed method was successfully applied to the determination of ZMT in its pharmaceutical formulation (Table 5). The results were compared statistically, by applying the t- and F-tests, with the results obtained by the reference method [16]. The results obtained by the proposed methods revealed no significant difference were found between the calculated and theoretical values of the proposed and reference methods at 95% confidence level. This indicated similar accuracy and precision in the analysis by the proposed and reported methods. It is evident from these results that the proposed methods are applicable to the analysis of ZMT in its dosage forms with comparable analytical performance.
| Reported methods [17] | Recoverya ± RSD % | ||||
|---|---|---|---|---|---|
| p-CLA | TCNQ | Quiz | ARS | ||
| 99.31 ± 0.30 | 99.51 ± 0.25 | 99.65 ± 0.37 | 99.85 ± 0.513 | 99.87 ± 0.543 | |
| t b | 1.14 | 1.60 | 2.03 | 2.02 | |
| F b | 1.44 | 1.52 | 2.92 | 3.28 | |
aAverage of six determinations.
bThe theoretical values of t and F are 2.57 and 5.05, respectively at confidence limit at 95% confidence level and five degrees of freedom (p=0.05).
Table 5: Determination of the studied drugs in No-Migain tablets (2.5 mg ZMT/tab).
Conclusions
The present study describes the successful evaluation of some π acceptors (TCNQ or P-CLA) and alizarin derivatives (Quiz or ARS) as an analytical reagent in the development of simple and rapid spectrophotometric methods for the accurate determination of ZMT in its dosage forms. The methods described herein have many advantages: it does not need expensive sophisticated apparatus, it is simple and rapid, and it has high sensitivity. The proposed methods used inexpensive reagents with excellent shelf life, and are available in any analytical laboratory.
References
- British Pharmacopoeia Commission (2008) British pharmacopoeia 2009. Her Majesty Sationary Office, London.
- Ding JS, Zhu RH, Zhu YG (2006) Determination of zolmitriptan in human plasma by HPLC-MS and study on bioequivalence of domestic and import zolmitriptan tablets. Chin Pharm J 41: 1488-1490.
- Cai J, Jiang XG, Chen J, Xiong ZG, Jin L (2006) Study on determination of zolmitriptan in rat plasma by HPLC. Chin Pharm J 41: 1171-1174.
- Kilic¸ B, Ozden T, Toptan S, Ozilhan S (2007) Simultaneous LC-MS-MS determination of zolmitriptan and its active metabolite N-desmethylzolmitriptan in human plasma. Chromatographia 66: S129-S133.
- Rao BM, Srinivasu MK, Sridhar G, Kumar PR, Chandrasekhar KB, et al. (2005) A stability indicating LC method for zolmitriptan. J Pharm Biomed Anal 39: 503-509.
- Srinivasu MK, Rao BM, Sridhar G, Chandrasekhar KB, Rajender Kumar P (2005) A validated chiral LC method for the enantiomeric separation of zolmitriptan key intermediate, ZTR-5. J Pharm Biomed Anal 39: 796-800.
- Dalpiaz A, Marchetti N, Cavazzini A, Pasti L, Velaga S, et al. (2012) Quantitative determination of Zolmitriptan in rat blood and cerebrospinal fluid by reversed phase HPLC-ESI-MS/MS analysis: application to in-vivo preclinical pharmacokinetic study. J Chromatogr B Analyt Technol Biomed Life Sci 901: 72-78.
- Clement EM, Franklin M (2002) Simultaneous measurement of zolmitriptan and its major metabolites N-desmethylzolmitriptan and zolmitriptan N-oxide in human plasma by high-performance liquid chromatography with coulometric detection. J Chromatogr B Analyt Technol Biomed Life Sci. 766: 339-343.
- Zhang Z, Xu F, Tian Y, Li W, Mao G (2004) Quantification of zolmitriptan in plasma by high-performance liquid chromatography-electrospray ionization mass spectrometry. J Chromatogr B Analyt Technol Biomed Life Sci. 813: 227-233.
- Chen X, Liu D, Luan Y, Jin F, Zhong D (2006) Determination of zolmitriptan in human plasma by liquid chromatography-tandem mass spectrometry method: Application to a pharmacokinetic study. J Chromatogr B Analyt Technol Biomed Life Sci 832: 30-35.
- Chen J, Jiang XG, Jiang WM, Mei N, Gao XL, et al. (2004) High-performance liquid chromatographic analysis of zolmitriptan in human plasma using fluorescence detection. J Pharm Biomed Anal 35: 639-645.
- Yu L, Yao T, Ni S, Zeng S (2005) Determination of zolmitriptan enantiomers in rat liver microsomes by chiral high performance liquid chromatography with fluorescence detection. Biomed Chromatogr 19: 191-195.
- Sankar DG, Babu AN, Rajeswari A, Krishna AV, Devi KV (2008) Spectrophotometric determination of zolmitriptan in pharmaceutical dosage forms. Asian J Chem 20: 4960-4962.
- Rao R, Humaira S, Munde MR (2010) Validated UV spectroscopic method for estimation of zolmitriptan from tablet formulations. Ijbar 1: 82-87.
- Acharjya SK, Mallick P, Panda P, Kumar KR, Annapurna MM (2010) Spectrophotometric methods for the determination of letrozole in bulk and pharmaceutical dosage forms. J Adv Pharm Technol Res 1: 348-353.
- Raza A, Ansari TM, Niazi SB (2007) A novel spectrophotometric method for the determination of zolmitriptan in pharmaceutical formulations. J Chin Chem Soc 54: 1413-1417.
- Aydogmus Z, Inanli I (2007) Extractive spectrophotometric methods for determination of zolmitriptan in tablets. J AOAC Int 90: 1237-1241.
- Rani NU, Rao RS, Saraswathi K, Murthy TEGK (2011) Spectrophotometry method for the analysis of zolmitriptan in formulations. IJRRPAS 1: 122-130.
- Foster R (1969) Organic Charge-Transfer Complexes. Academic Press, London. 387: 51.
- Mohamed GG, El-Dien FA, Mohamed NA (2007) Utility of 7,7,8,8-tetracyanoquinodimethane charge transfer reagent for the spectrophotometric determination of trazodone, amineptine and amitriptyline hydrochlorides. Spectrochim Acta A Mol Biomol Spectrosc 68: 1244-1249.
- Aydogmus Z (2008) Highly sensitive and selective spectrophotometric and spectrofluorimetric methods for the determination of ropinirole hydrochloride in tablets. Spectrochim Acta A Mol Biomol Spectrosc 70: 69-78.
- Amin AS, El-Beshbeshy AM (2001) Utility of certain sigma and pi-acceptors for the spectrophotometric determination of sildenafil citrate (Viagra). Mikrochimica Acta 137: 63-69.
- Gouda AA, El-Sheikh R, Amin AS (2008) Utility of some pi-acceptors for spectrophotometric determination of gatifloxacin in pure form and in pharmaceutical preparations. Chem Pharm Bull 56: 34-40.
- Gouda AA (2009) Utility of certain sigma- and pi-acceptors for the spectrophotometric determination of ganciclovir in pharmaceutical formulations. Talanta 80: 151-157.
- Darwish IA, Refaat IH (2006) Spectrophotometric analysis of selective serotonin reuptake inhibitors based on formation of charge-transfer complexes with tetracyanoquinodimethane and chloranilic acid. J AOAC Int 89: 326-333.
- Amin AS (2002) Spectrophotometric determination of piroxicam and tenoxicam in pharmaceutical formulations using alizarin. J Pharm Biomed Anal 29: 729-736.
- Issa YM, Amin AS (1994) Spectrophotometric microdetermination of sulfamethoxazole and trimethoprim using alizarin and quinalizarin. Anal Lett 27: 1147-1158.
- Shama SA, Amin AS (2004) Spectrophotometric microdetermination of nefopam, mebevrine and phenylpropanolamine hydrochloride in pharmaceutical formulations using alizarins. Spectrochim Acta A Mol Biomol Spectrosc 60: 1769-1774.
- Gouda AA, Kassem M (2012) Novel Spectrophotometric Methods for Determination of Desloratidine in Pharmaceutical Formulations Based on Charge Transfer Reaction. Arabian J Chem In press.
- Job P (1964) Advanced Physicochemical Experiments. 2nd edition, Oliner and Boyd, Edinburgh 54.
- Mendham J, Denney RC, Barnes JD, Thomas MJK (2000) Vogel’s Quantitative Chemical Analysis. 6th Edition, Pearson Education Ltd, England.
- Miller JN, Miller JC (2005) Statistics and Chemometrics for Analytical Chemistry. 5th edition, Prentice Hall, England.
- International Conference on Harmonization of Technical Requirements for Registration of Pharmaceuticals for Human Use (2005) ICH Harmonized Tripartite Guideline, Validation of Analytical Procedures: Text and Methodology, Q2(R 1). Complementary Guideline on Methodology dated 06 November 1996, ICH, London.
Relevant Topics
Recommended Journals
Article Tools
Article Usage
- Total views: 17442
- [From(publication date):
November-2012 - Dec 15, 2025] - Breakdown by view type
- HTML page views : 12520
- PDF downloads : 4922

