Comparative Quantitation of Lymphoma Gene Signatures in Parallel Formalin Fixed Paraffin Embedded and Frozen Tissue Lymph Nodes
Received: 24-Aug-2012 / Accepted Date: 24-Sep-2012 / Published Date: 26-Sep-2012 DOI: 10.4172/2161-0681.1000128
Abstract
Abstract
Microarray gene expression profiling of frozen samples has identified Indicator genes predictive outcome in diffuse
large B-cell lymphoma (DLBCL) and follicular lymphoma (FL) and there is a now a need to translate these to use in
routine clinical material. In order to evaluate the use of Indicator genes as a diagnostic tool in routinely processed
formalin fixed paraffin embedded tissue (FFPET), we used a simple, practical polyA PCR based method for analysis
of Indicator genes in DLBCL and FL, using parallel FFPET and frozen tissue lymph nodes. PolyA PCR was used to
generate polyA cDNAs from 42 archival FFPET lymph nodes and 42 parallel frozen tissue lymph nodes. These polyA
cDNAs were assayed by real-time PCR for 35 Indicator genes, identified from previous microarray studies, predictive
of outcome in FL and DLBCL, together with housekeeping genes. Housekeeping genes were detectable at high levels
in all cases, though the 35 Indicator genes were expressed at lower levels. There was statistically significant difference
in gene expression between DLBCL and FL for one of the Indicator genes, HSP27 (p ≤ 0.02). There was no correlation
between the Indicator gene expression levels in the FFPET and frozen lymph nodes. The results demonstrate that
gene expression in FFPET is altered from that in frozen tissue and that gene expression data from frozen tissue is
therefore not transferable for use in FFPET.
Keywords: Lymphoma; Indicator genes; Formalin fixed paraffin embedded tissue; PolyA PCR; Real-time PCR
308334Introduction
Recently it has become clear that the development of haematological malignancy may depend almost solely on disturbances in normal gene transcription within cells [1,2]. This breakdown in normal control can be quantified in the laboratory by measuring mRNA expression levels and a number of important studies have identified, through global gene expression profiling using microarray technology, small groups of genes for both FL [3-5] and DLBCL [6] predictive of outcome or response to treatment, so called Indicator genes. Although, the above microarray studies have suggested the possibility of more precise cancer diagnosis [7], verification of the data in larger or more diverse sample sets is hindered by the need for fresh or frozen tissue and for relatively large amounts of tissue. However, most archival and clinical tissue is in the form of formalin fixed paraffin embedded tissue (FFPET) which, with its attendant long-term follow-up and inclusively for all tumor types, is therefore becoming evermore important as a source of research material [8] and it would greatly facilitate and speed up research in this area [9]. Furthermore introducing gene expression profiling into routine oncology could revolutionise the way in which we manage cancers, improving patient outcomes.
There is therefore an urgent need to develop methods for measurement of mRNA expression in FFPET. Previous attempts have reported varying degrees of success but have used methods directed against a limited number of specific genes [10-12] or against abundant genes [13], which are of limited relevance for global transcriptional analyses.
In order to incorporate gene expression profiling of tumours into routine clinical practice, a robust, reproducible, reliable and cost effective procedure is required. PolyA reverse-transcriptase polymerase chain reaction (PolyA RT-PCR) enables globally amplification of cDNA transcripts representative of all poly adenylated mRNAs from a given sample whilst maintaining the relative ratios of each of the transcripts [14]. The technique is of sufficient sensitivity to amplify sub-picogram amounts of mRNA from single cells [15], and is therefore ideal for analysis of clinical samples, which given the increased use of needle core and fine needle aspiration samples, are of increasingly small size. We have previously successfully used this method to extract mRNA from FFPET [16] and for measurement of lymphoma associated Indicator genes in archived frozen samples of FL and DLBCL [17].
In this study we tested the hypothesis that polyA PCR could produce globally amplified cDNA from RNA extracted from formalin fixed paraffin embedded samples. The specific aims were to: 1) To extract RNA from FFPET samples from patients with either FL or DLBCL, and for whom we have mRNA expression data from parallel frozen tumour samples. 2) To produce a polyA cDNA library using polyA RT-PCR. 3) To amplify cDNA using RTQ-PCR and subsequently measure the expression levels of 35 FL and DLBCL Indicator genes [1,5,6] in each sample. 4) To test the use of these gene expression profiles as classifiers of FL versus DLBCL. 5) To compare mRNA expression between archival frozen and FFPET samples from the same patients. The last two aims will test of the feasibility of switching from frozen to FFPET samples for routine gene expression analysis in FL and DLBCL.
Materials and Methods
Tissue specimens
Fifty archived FFPET lymph nodes (with at least 5 years follow up) with a diagnosis of either FL or DLBCL were obtained, with informed consent, from the archives of the Christie Hospital NHS Trust, Manchester, UK. The samples were selected from the archive on a sequential chronological basis, taking all samples for which consent was given, in the archive from 1995 backwards to 1989. Paraffin embedded sections from all cases were reviewed by two pathologists (RJB & LPM) and those unlikely to have sufficient material for analysis, with more than 10% necrosis or with uncertain or complex/mixed diagnoses were excluded. Parallel archived frozen tissue samples from the same patients had undergone mRNA expression analysis in a previous study [17]. A summary of the sample details is given below in table 1; total RNA was extracted from 50 FFPET lymph node samples, 42 of which yielded RNA in enough quantity to perform gene expression analysis.
| Diagnosis | Number | Average age of samples (yrs) | Outcome |
|---|---|---|---|
| FL | 18 | 13.4 | All dead |
| DLBCL | 24 | 13.6 | All dead |
| Total | 42 |
Table 1: Summary of FFPET sample details.
For each case the FFPET block was cooled on ice for twenty minutes, following which eight 10 μm thick sections were cut using a microtome. The eight sections from each block were then equally split between two 1.5 ml Eppendorf tubes (Starlab), such that each tube contained four rolled 10 μm sections. To allow for optimum extraction, the surface area of the tissues was ensured not to exceed 1cm.
Total RNA isolation from samples FFPET
The ‘Optimum™ FFPE RNA Isolation kit’ (Ambion ; Cat No. 47000) was used for RNA extraction, according to manufacturer’s instructions. Total RNA was extracted from 50 FFPET lymph node samples, 42 of which yielded RNA in enough quantity to perform gene expression analysis using RTQ-PCR. Total RNA from these 42 samples was visualised on 0.6% agarose gels.
Poly Adenylated mRNAs (PolyA RT-PCR)
Global amplification of cDNA corresponding to all expressed genes (polyA PCR), was carried out as previously reported [17].
Real-time quantitative RT-PCR
TaqmanTM PCR primers and probes were designed for each gene using Primer Express Software (Perkin Elmer/Applied Biosystems) and are listed in Table 2. For each gene, TaqmanTM PCR was applied to 1ng polyA cDNA from each sample and to 10 microlitre of all serial human genomic standards, using a TaqmanTM Gold kit as recommended by the manufacturer. Samples were analysed using an ABI Prism 7000 sequence detection system (PE Applied Biosystems) as recommended by the manufacturer and as described previously [18].
| Genes | Accession Number | 1=5’-TaqMan forward primer - 3’ 2= 5’-TaqMan revers primer - 3’ 3=5’-TaqMan(FAM)-probe-(TAMARA)- 3’ |
References | |
|---|---|---|---|---|
| 1 | Beta Actin | NM_001101 | 1=CCACCCCACTTCTCTCTAAGGA | Housekeeping gene |
| 2=CATAATTTACACGAAAGCAATGCTATC | ||||
| 3=TGGCCCAGTCCTCTCCCAAGTCC | ||||
| 2 | Ribosomoal S9 | U14971 | 1=GAGACGACGAGGAGGAGGATTA | Housekeeping gene |
| 2=GCAGGAAAACGAGACAATCCA | ||||
| 3=TCCACCTGTCCCTCCTGGGCTG | ||||
| 3 | IF2b | U23028 | 1=TGGAGTTGGGATGTGGAAGTG | Housekeeping gene |
| 2=CTGCCGGCCTGCTTAG | ||||
| 3=TCCTCCCTAGGCAGAAGCTTTGTTCCAT | ||||
| 4 | GAP | NM_002046 | 1=CATGGCCTCCAAGGAGTAAG | Housekeeping gene |
| 2=GGGACTCCCCAGCAGTGA | ||||
| 3=ACCAGCCCCAGCAAGAGCACAAGA | ||||
| 5 | 5-hT2B | X77307 | 1= ATGGGATTAACCCTGCCATGTA | Shipp et al, 2002 [1] |
| 2=GAGAAGCGTATCTAGTAGAATGATTGATGA | ||||
| 3=TCCAATGAGGCTCCGAAGTTCAACCAT | ||||
| 6 | h731 | NM_145341 | 1=CTTTCTTTCAAGGACAGTGTTTTTTGT | Shipp et al, 2002 [1] |
| 2=TCCCAAAGCACAGTATCTCAACAG | ||||
| 3=TAAGCTGCTAAAACCCCATGTTGGCTGCT | ||||
| 7 | PKC-b-1 | BC036472 | 1=CCCTCATCCCCAAACTACTTGA | Shipp et al, 2002 [1] |
| 2=GGCCTTGCTAGAGTGACTGTGTT | ||||
| 3=AAGGGCATTTGGCACCACTCTCTGAA | ||||
| 8 | OVGL | U09550 | 1=CCTAAGCCCCTCTGGTGTCA | Shipp et al, 2002 [1] |
| 2=GAGATTGGCCTATTCTGGTTTTGA | ||||
| 3=TTCTAAGTGACATGTTGGAAGCCTTCTCATCC | ||||
| 9 | PKCG | BC047876 | 1=GCTCCCAATCAGCTTTTGTTCTA | Shipp et al, 2002 [1] |
| 2= GTGGGTCCGAGCCAGACA | ||||
| 3= AGCCCGCCTGCCGTGCAT | ||||
| 10 | ZFPC150 | BC022785 | 1=CCAGTGAAGTTGCTGATGGTATG | Shipp et al, 2002 [1] |
| 2=GGTACAAGGTGAACAACCTTAAGTAACA | ||||
| 3=TTGCGGTGTCTCGGCATACCCCT | ||||
| 11 | TLE1 | M99435 | 1=CAAGGCCAAGCGGACAGA | Shipp et al, 2002 [1] |
| 2=CCAGATCACCCAGAAAGAAAGAA | ||||
| 3=AACGGAATCTGCCGACTCACATGACA | ||||
| 12 | MINOR | U12767 | 1=GGATGACCACACTAGCACAGAAGA | Shipp et al, 2002 [1] |
| 2=CAGCTGGTGGCTTCCTGATT | ||||
| 3=TCCTCCCTTGGCGGGAGAGCTCT | ||||
| 13 | ACTA | J05192 | 1=CCGGAGCGCAAATACTCTGT | Rosenwald et al, 2002 [5] |
| 2=CCCGGCTTCATCGTATTCCT | ||||
| 3=ATCGGTGGCTCCATCCTGGCCT | ||||
| 14 | NPM3 | NM_006993 | 1=GATGACTTCCAGCTCCAACCA | Rosenwald et al, 2002 [5] |
| 2=CTCGCTCTCCTCCTCAGAAACA | ||||
| 3=TAACCTTCCGCCTGAAGTCGGGCT | ||||
| 15 | Bcl-6 | U00115 | 1=CAGACACAGGGACTTGAAGTTGTTACT | Rosenwald et al, 2002 [5] |
| 2=GACACAGCCAAACCCTGTCTC | ||||
| 3=TCCCATTCTGCGTCATGCTTGTGTGATAACT | ||||
| 16 | c-myc | D89667 | 1=GAAACAGGCCGTCATGGAAAT | Rosenwald et al, 2002 [5] |
| 2=CAAAAACTCTCAGGCCTTAGCAGTA | ||||
| 3=AGTCAGAAGATTCAGCAGCTCACAGCCCT | ||||
| 17 | HLA-DQ-a | U77589 | 1=CGCCATCTACAGGAGCAGAA | Rosenwald et al, 2002 [5] |
| 2=AGCAGCTTAAGTCCCAGAGAAAAG | ||||
| 3=ACATGACCTAGCACTATTCTCTGGCCCGATT | ||||
| 18 | HLA-DR-a | K01171 | 1=GCCCTATAGCCACCCCAAGT | Rosenwald et al, 2002 [5] |
| 2=CAGGGAAGCCAGCTAGATGTTAGA | ||||
| 3=TGGTTATGCCTCCTCGATTGCTCCGTA | ||||
| 19 | KIAA0233 | D87071 | 1=GGAGGAGTTGTACGCCAAGCT | Rosenwald et al, 2002 [5] |
| 2=CTTCTCACGAGTCCACTTGATCA | ||||
| 3=TCTTCCTCTACCGCTCACCGGAGACC | ||||
| 20 | Urokinase | U08839 | 1=GGCTCCCAGCCCTACAGACT | Rosenwald et al, 2002 [5] |
| 2=GCTTTTCTCTTCTGCTTCACACAA | ||||
| 3=AGTGTGCCGACCTCTCTGGGCCT | ||||
| 21 | BMP6 | NM_001718 | 1=AGGCAGTGCTCACCTCTTCTTT | Rosenwald et al, 2002 [5] |
| 2=GTACTAGAGCCGGCAGTCCAGA | ||||
| 3=CCAGAACGGTTCTTTGACCAGCACATTAA | ||||
| 22 | BCL-2 | M14745 | 1=TGAGTAAATCCATGCACCTAAACCTTT | Husson et al, 2002 [6] |
| 2=CACTGTCACTCTTGCAAATTCTACCT | ||||
| 3=TGGGCCCTCCAGATAGCTCATTTCATT | ||||
| 23 | COL3A1 | NM_000090 | 1=CAAAATCTGTACATGTCTCCCATCAG | Husson et al, 2002 [6] |
| 2=CAACACATTCTCTATGCTAGTGTGACAA | ||||
| 3=TGCCACAGGGATTCTCCTCCTTCATCC | ||||
| 24 | CDC2 | NM_052987 | 1=CCTGGCAGGACTCCAGATGA | Husson et al, 2002 [6] |
| 2=GGAGCAGGGATCCAGCTCA | ||||
| 3=AGCCACAATTGAGGATACCCCGAGCT | ||||
| 25 | Cyclin B | M25753 | 1=CCTGGCTAAGAATGTAGTCATGGTAA | Husson et al, 2002 [6] |
| 2=GCATGCTTCGATGTGGCATA | ||||
| 3=TCAAGGACTTACAAAGCACATGACTGTCAAGAACA | ||||
| 26 | IL2RG | D11086 | 1=CACCCCTTCATTTGGCATTC | Husson et al, 2002 [6] |
| 2=CGAAAAGGAAGGGCCAGACT | ||||
| 3=ACTTGAGAATTACCCTTTTGCCCCGAACAT | ||||
| 27 | Hsp40 | D49547 | 1=CTGTTCCCTGGAGGCCAGT | Husson et al, 2002 [6] |
| 2=CACTTTGGTCTCATGTTGGCA | ||||
| 3=TGCTCAGACCTTTAGACTCATTGTAAGTTGCCA | ||||
| 28 | MLK-3 | L32976 | 1=GGCTCTCTGGATGCCTTCCT | Husson et al, 2002 [6] |
| 2=GTTTATTTGGCTTCTGGCTTCACT | ||||
| 3=CCAGCCAGGGTTGGAGTCTTAGCCTC | ||||
| 29 | HSF1 | M64673 | 1=CCGTGTCCTGTGGTTTGGTT | Husson et al, 2002 [6] |
| 2=GTTGTGTAAAAATCCAAAATACAATTCTGA | ||||
| 3=TCACAGCCACACCTGGACTGACCCT | ||||
| 30 | XPB | M31899 | 1=CTTAGGCAGGGTACTTCGTTCAA | Husson et al, 2002 [6] |
| 2=GAGGTGGAAGGAAAATGTTATGCT | ||||
| 3=CGGCGCTTGGCACCCTTGT | ||||
| 31 | HSP27 | X54079 | 1=GCAGTCCAACGAGATCACCAT | Husson et al, 2002 [6] |
| 2=CTTTACTTGGCGGCAGTCTCAT | ||||
| 3=TCACCTTCGAGTCGCGGGCC | ||||
| 32 | P21CIP1 | U09579 | 1=CTCTCGGCTCCCCATGTGT | Husson et al, 2002 [6] |
| 2=CATTGTGGGAGGAGCTGTGA | ||||
| 3=TGGTTCCCGTTTCTCCACCTAGACTGTAAAC | ||||
| 33 | TNF | X01394 | 1=AGCTGCCTTGGCTCAGACAT | Husson et al, 2002 [6] |
| 2=GGTCACCAAATCAGCATTGTTTAG | ||||
| 3=AGCTGAACAATAGGCTGTTCCCATGTAGCC | ||||
| 34 | YY-1 | M76541 | 1=AGTGTTAATCAATTTAAACCCATTTTAGTCA | Husson et al, 2002 [6] |
| 2=CAGGTGTTAAAAGGTACAATACATTCTACAAC | ||||
| 3=CCAGATGCTGATGTTCAGTGTAATTTCTTTGCCT | ||||
| 35 | ear-2 | X12794 | 1=CCAGGATGGAGGGTCCAAT | Husson et al, 2002 [6] |
| 2=CCCCACCATCCCACAAGTT | ||||
| 3=AGCCTTGTTCCTCAGCACCCCTAGCA | ||||
| 36 | ZFX | X59738 | 1=CAGGCTTTAAACGGCACGTTA | Husson et al, 2002 [6] |
| 2=CATTATGTGCTGGTTCTTTTCTGAA | ||||
| 3=TCCATTCACACGAAAGACTATCCTCACCG | ||||
| 37 | ID2 | NM_002166 | 1=CGTGAATACCAGAAGGATCCAGTA | Husson et al, 2002 [6] |
| 2=CAGCATTCAGTAGGCTTGTGTCA | ||||
| 3=TCAGTCACTTAAATGAAGTCTTTTGGTCAGAAATTACCTT | ||||
| 38 | JUN | J04111 | 1=GCAGGAATTGGTGGCAGATT | Husson et al, 2002 [6] |
| 2=CAAAGGCCATCTTTTTATCTAGGAA | ||||
| 3=ATGTATCCTTCCAATTTGGAATCTTCTCTTTGACA | ||||
| 39 | bsp-1 | U57456 | 1=GTTCACCTCATAATCCTATTTCATCTGT | Husson et al, 2002 c |
| 2=GGCTCCTTTGTCAGTTCTCAATC | ||||
| 3=CCTCTGGAAAACTATTGAGCCTTGCATGTACTT |
1=TaqMan primer 1 (5’–3’); 2=TaqMan primer 2 (5’–3’); 3=TaqMan [6-carboxyfluorescein (FAM)]-probe-[6-carboxyteramrthylrhodamine (TAMARA)] (5’–3’).
Table 2: List of primers and probes used.
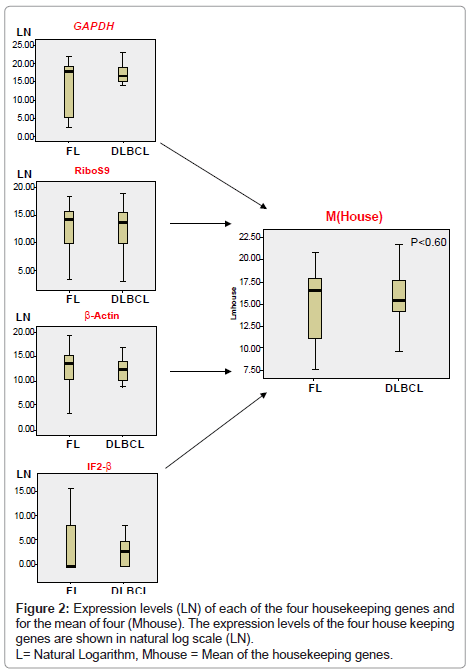
Data Normalisation: The expression levels of four housekeeping genes (IF2-β, GAPDH, Beta actin and human ribosomal protein S9 mRNA) were measured by RT-PCR in each sample. Copy numbers obtained for the mean (Mhouse) of the four housekeeping genes in each sample were divided by the highest Mhouse in all samples resulting in a normalisation correction factor. Following real-time PCR amplification and quantification of the selected genes, this factor was then used for normalisation of expression levels of each of the 35 genes measured.
Statistical analysis
The data was not normally distributed and therefore nonparametric tests were used. Statistical analysis of the expression levels of the 35 genes was performed using the Mann Whitney test and Kruskal-Wallis with a p ≤ 0.05 for statistical significance. All the tests were performed using SPSS software v13 (Woking, Surrey, UK). As the expression levels for all the genes falls across a large range, the natural logarithm (LN) was used to plot all values to aid visual comparison. The ranking of the expression levels of Indicator genes between samples was presented as the mean rank statistical difference [18]. Spearman Correlation analysis was also performed.
Results
RNA extraction and reverse transcription
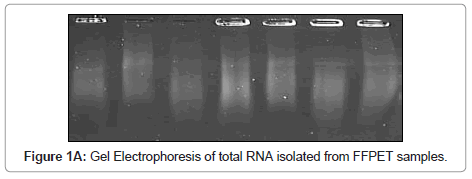
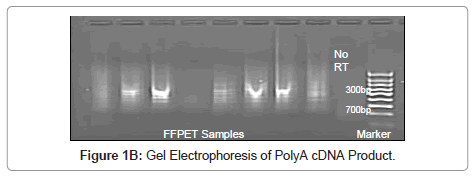
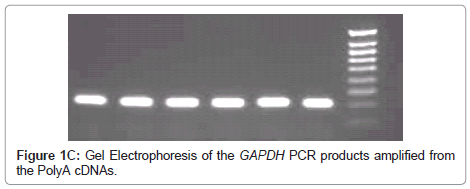
In order to validate the polyA PCR amplification step, the product was assessed by three means, as described previously [16], to ensure that the method was reliable and that the product could be used confidently in subsequent probing for Indicator genes. Firstly the polyA cDNA was visualised using gel electrophoresis (Figure 1A). Secondly, normal reverse-transcriptase PCR (RT-PCR) was performed on GAPDH and this was viewed using gel electrophoresis (Figure 1B,1C); the no RT control was negative (Figure 1B). Finally, as a quantitative measure, real time-quantitative PCR (RTQ-PCR) was performed for GAPDH.
Quantification of Housekeeping Gene Expression from FFPET samples
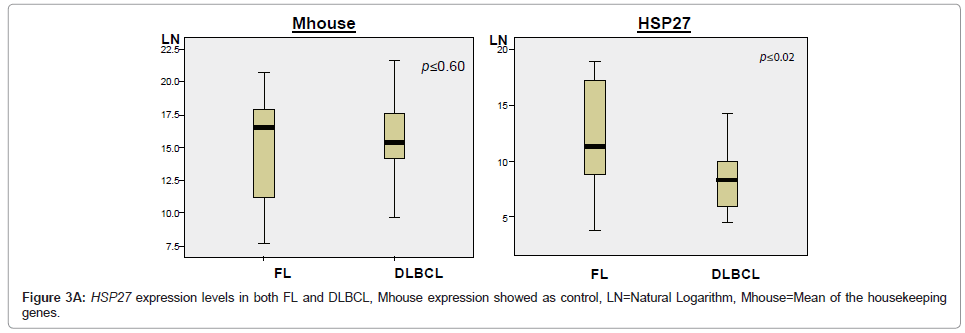
All samples showed strong expression of GAPDH, Ribosomal S9 and β-actin, although expression of IF2-β was less (Figure 2). However, there was no statistically significant difference in the value of Mhouse for the different diagnostic groups (p ≥ 0.60).
Quantification and Comparison of FL or DLBCL Indicator Gene Expression in FFPET samples
The expression levels of 35 Indicator genes for FL and DLBCL [1,5,6] were quantified and compared in FFPET samples (Table 2); these genes had been measured in parallel frozen samples in a previous study and were therefore chosen for purposes of comparison. The copy number for each gene in each sample was reproducible over at least duplicate tests demonstrating reliability of the method. Following normalisation of the data, only one gene, HSP27, showed significant difference in expression between FL and DLBCL (P ≤ 0.02), with higher expression in FL (Figure 3A). Comparison of the expression levels of each of the 35 Indicator genes measured in both FL and DLBCL is shown by means of the mean rank statistic in Figure 3B.
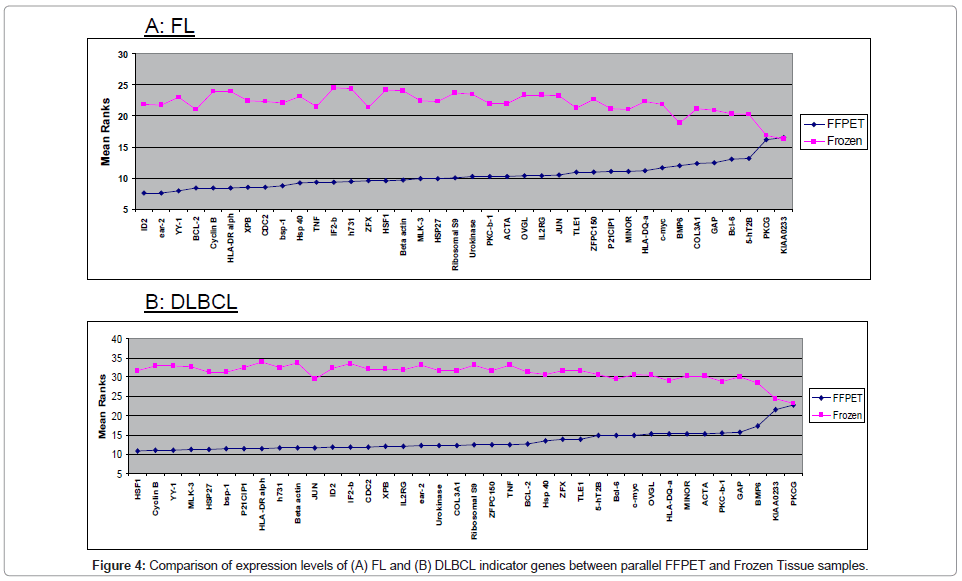
Comparison of expression levels of FL and DLBCL indicator genes between parallel FFPET and Frozen Tissue samples
Parallel archival frozen lymph node samples had previously been analysed for mRNA expression for the same genes as measured in the FFPET samples. The FFPET gene expression data for each sample was compared with that from the corresponding frozen samples in order to determine whether gene expression levels in FFPET was comparable with that of parallel frozen samples (Figure 4).
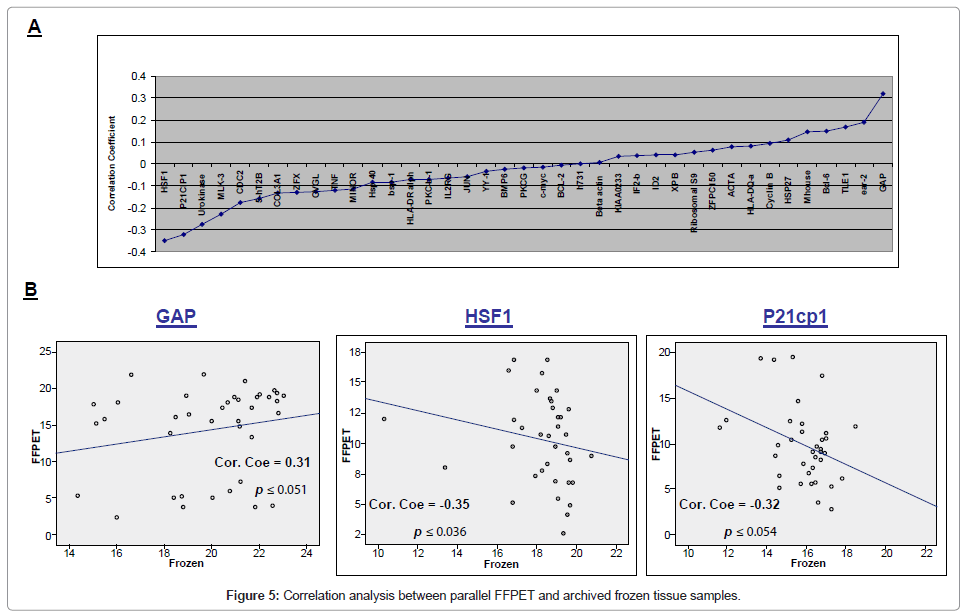
Correlation analysis between parallel FFPET and frozen tissue samples demonstrated statistically significant correlation for HSF1 (correlation coefficients -0.35, p ≤ 0.036), P21cp1 (correlation coefficients -0.32, p ≤ 0.054) and GAPDH alone showed positive correlation (correlation coefficients 0.31, p ≤ 0.051) (Figure 5).
Discussion
The aims of the study were to determine the feasibility of mRNA extraction, polyA PCR global cDNA amplification and RTQ-PCR of gene expression profiling from routinely processed FFPET blocks from patients with FL and DLBCL and to compare the gene expression profiles obtained with those in parallel frozen samples. The results demonstrate that the methodology is suitable for extraction and the amplification of mRNA from FFPET samples but that the gene expression profile in the resultant cDNA differs from that in cDNA prepared from frozen samples.
The main obstacle to using FFPET samples in routine molecular diagnosis is degradation caused to nucleic acids within the sample by the process of fixation, which both cross links and fragments the mRNA present. Frequent breaks in the RNA results in a number of intact amplicons that is too low for amplification [19], whilst with increasing age, more breaks may appear in the RNA, leading to the number of intact amplicons to be too low for amplification of the gene of interest [19]. We have previously addressed this problem using polyA amplication to increase the amount of material for analysis, followed by real-time PCR using primers and probes for relatively short sequences within 300 bp of the 3’ end. Since formalin fixation results in mRNA fragments approximately 200 bp long this strategy is capable of successful analysis [16].
The results demonstrate that all four housekeeping genes measured were expressed but that three of the four, namely GAPDH, β-Actin and Ribosomal S9 were expressed at higher levels than IF2-β. Since housekeeping genes, by definition, are constitutively expressed by all cells, the likely explanation for this is that the IF2-β gene is more vulnerable to disruption during formalin fixation than the other housekeeping genes. This could be due to a structural difference in the gene, or maybe because the gene is expressed at lower levels constitutively in cells.
It should be stressed however that successful amplification of a housekeeping gene from cDNA does not ensure that Indicator gene expression will be unaffected by fixation in FFPET samples. By definition, housekeeping gene expression is uniformly high in all cells, and so even if extensive degradation had occurred, they may still be detectable after PCR. Conversely, formalin fixation may completely destroy genes that are expressed at only low levels in cells, such as some Indicator genes, and thus these would not be detectable. The FFPET samples used in this study were all over five years old. It is possible that RNA stored in FFPET does not in fact degrade during the fixation process itself, but degrades whilst in the paraffin over time [20]. If this were to be the case, then gene expression analysis from FFPET may be more feasible from FFPET of a younger age.
Despite the above concerns mRNA was successfully amplified and the gene expression profile of 35 Indicator genes measured in the resultant cDNA. However, only one of the 35 genes measured, Heat shock protein 27 (HSP27), demonstrated statistically significant (p ≤ 0.02) increased expression in FL compared to DLBCL, indicating that this was the only gene capable of differentiating between the two types of lymphoma in this study.
Using archival data from parallel frozen samples, correlation analysis was performed to statistically compare gene expression of 35 Indicator genes in frozen versus FFPET tissue from identical patients (Figure 5). The results showed that gene expression in FFPET was altered from that of frozen tissue, with positive correlation between the level of gene expression in frozen samples and the level in the corresponding FFPET sample for GAPDH alone, and that therefore gene expression data from frozen tissue studies was not transferable to use in FFPET. This inability to translate between the two gene expression profiles means that if FFPET were to replace the use of frozen tissue in the future in routine use, then new Indicator genes will need to be identified from FFPET directly in future studies. These findings have reiterated conclusions from previous studies, which all indicate that gene expression in FFPET samples is not comparable to that of frozen samples. For example, Chen et al. [21] identified 63 genes whose expression levels were significantly different between hepatocellular adenoma and well differentiated hepatocellular carcinoma using microarray studies. When these genes were further analysed using RTQ-PCR from parallel FFPET samples, only eight of the original 63 genes were found to be expressed in concordance with the microarray results. More significantly, our previous work demonstrated that in the 42 parallel frozen samples for which Indicator gene expression was quantified, ten of the 35 genes showed significant differences in expression between FL and DLBCL [16]. However, in this study we found that in the corresponding FFPET samples, only one of the 35 genes was significantly expressed. This difference is due to the significantly increased degradation of RNA extracted from FFPET, causing the discriminative power of each gene to drop when using FFPET.
Overall this study has demonstrated the feasibility of extracting and globally amplifying RNA from routinely processed, human FFPET samples, using polyA RT-PCR. RTQ-PCR can then be successfully performed for both housekeeping genes and Indicator genes. However, the expression levels of these genes differs from that in parallel frozen samples and therefore, despite the ability to extract mRNA, carry out polyA PCR and measure gene expression in FFPET, Indicator genes identified in frozen samples cannot be used for prediction of outcome in FFPET.
References
- Shipp MA, Ross KN, Tamayo P, Weng AP, Kutok JL, et al. (2002) Diffuse large B-cell lymphoma outcome prediction by gene-expression profiling and supervised machine learning. Nat Med 8: 68-74.
- Ebert BL, Golub TR (2004) Genomic approaches to hematologic malignancies. Blood 104: 923-932.
- Sigal S, Ninette A, Rechavi G (2005) Microarray studies of prognostic stratification and transformation of follicular lymphomas. Best Pract Res Clin Haematol 18: 143-156.
- Glas AM, Kersten MJ, Delahaye LJ, Witteveen AT, Kibbelaar RE, et al. (2005) Gene expression profiling in follicular lymphoma to assess clinical aggressiveness and to guide the choice of treatment. Blood 105: 301-307.
- Husson H, Carideo EG, Neuberg D, Schultze J, Munoz O, et al. (2002) Gene expression profiling of follicular lymphoma and normal germinal center B cells using cDNA arrays. Blood 99: 282-289.
- Rosenwald A, Wright G, Chan WC, Connors JM, Campo E, et al. (2002) The use of molecular profiling to predict survival after chemotherapy for diffuse large-B-cell lymphoma. N Engl J Med 346: 1937-1947.
- Alizadeh AA, Eisen MB, Davis RE, Ma C, Lossos IS, et al. (2000) Distinct types of diffuse large B-cell lymphoma identified by gene expression profiling. Nature 403: 503-511.
- Lehmann U, Kreipe H (2001) Real-time PCR analysis of DNA and RNA extracted from formalin-fixed and paraffin-embedded biopsies. Methods 25: 409-418.
- Oberli A, Popovici V, Delorenzi M, Baltzer A, Antonov J, et al. (2008) Expression profiling with RNA from formalin-fixed, paraffin-embedded material. BMC Med Genomics 1: 9.
- Stanta G, Schneider C (1991) RNA extracted from paraffin-embedded human tissues is amenable to analysis by PCR amplification. Biotechniques 11: 304, 306, 308.
- Finke J, Fritzen R, Ternes P, Lange W, Dölken G (1993) An improved strategy and a useful housekeeping gene for RNA analysis from formalin-fixed, paraffin-embedded tissues by PCR. Biotechniques 14: 448-453.
- Mizuno T, Nagamura H, Iwamoto KS, Ito T, Fukuhara T, et al. (1998) RNA from decades-old archival tissue blocks for retrospective studies. Diagn Mol Pathol 7: 202-208.
- Krafft AE, Duncan BW, Bijwaard KE, Taubenberger JK, Lichy JH (1997) Optimization of the Isolation and Amplification of RNA From Formalin-fixed, Paraffin-embedded Tissue: The Armed Forces Institute of Pathology Experience and Literature Review. Mol Diagn 2: 217-230.
- Brady G, Billia F, Knox J, Hoang T, Kirsch IR, et al. (1995) Analysis of gene expression in a complex differentiation hierarchy by global amplification of cDNA from single cells. Curr Biol 5: 909-922.
- Iscove NN, Barbara M, Gu M, Gibson M, Modi C, et al. (2002) Representation is faithfully preserved in global cDNA amplified exponentially from sub-picogram quantities of mRNA. Nat Biotechnol 20: 940-943.
- Byers R, Roebuck J, Sakhinia E, Hoyland J (2004) PolyA PCR amplification of cDNA from RNA extracted from formalin-fixed paraffin-embedded tissue. Diagn Mol Pathol 13: 144-150.
- Sakhinia E, Glennie C, Hoyland JA, Menasce LP, Brady G, et al. (2007) Clinical quantitation of diagnostic and predictive gene expression levels in follicular and diffuse large B-cell lymphoma by RT-PCR gene expression profiling. Blood 109: 3922-3928.
- Sakhinia E, Faranghpour M, Liu Yin JA, Brady G, Hoyland JA, et al. (2005) Routine expression profiling of microarray gene signatures in acute leukaemia by real-time PCR of human bone marrow. Br J Haematol 130: 233-248.
- Antonov J, Goldstein DR, Oberli A, Baltzer A, Pirotta M, et al. (2005) Reliable gene expression measurements from degraded RNA by quantitative real-time PCR depend on short amplicons and a proper normalization. Lab Invest 85: 1040-1050.
- Hsu PL, Hsu SM (1998) Abundance of heat shock proteins (hsp89, hsp60, and hsp27) in malignant cells of Hodgkin's disease. Cancer Res 58: 5507-5513.
- Chen H, Zheng C, Zhang Y, Chang YZ, Qian ZM, et al. (2006) Heat shock protein 27 downregulates the transferrin receptor 1-mediated iron uptake. Int J Biochem Cell Biol 38: 1402-1416.
Citation: Sakhinia E, Goodchild J, Menasce LP, Radford J, Estiar MA, et al. (2012) Comparative Quantitation of Lymphoma Gene Signatures in Parallel Formalin Fixed Paraffin Embedded and Frozen Tissue Lymph Nodes. J Clin Exp Pathol 2:128. DOI: 10.4172/2161-0681.1000128
Copyright: © 2012 Sakhinia E, et al. This is an open-access article distributed under the terms of the Creative Commons Attribution License, which permits unrestricted use, distribution, and reproduction in any medium, provided the original author and source are credited.
Select your language of interest to view the total content in your interested language
Share This Article
Recommended Journals
Open Access Journals
Article Tools
Article Usage
- Total views: 15085
- [From(publication date): 11-2012 - Dec 19, 2025]
- Breakdown by view type
- HTML page views: 10260
- PDF downloads: 4825

