Research Article Open Access
Ionization Polarity as a Cause of Matrix Effects, its Removal and Estimation in ESI-LC-MS/MS Bio-analysis
Chinmoy Ghosh1,2*, Chandrakant P. Shinde2 and Bhaswat S. Chakraborty11Contract research organization, Cadila Pharmaceuticals Limited, 1389-Trasad road, Dholka, Gujarat, India
2School of Studies in Chemistry, Jiwaji University, Gwalior, M.P., India
- *Corresponding Author:
- Chinmoy Ghosh
Research Scientist
Contract Research Organization
Cadila Pharmaceuticals Limited
1389, Trasad road, Dholka-387 810
Dist – Ahmedabad, Gujarat, India
Tel: +91-2714-221481/83/84
Fax: +91-2714-221848
E-mail: chinmoy_ghosh@yahoo.com
Received date: September 13, 2010; Accepted date: November 01, 2010; Published date: November 03, 2010
Citation: Ghosh C, Shinde CP, Chakraborty BS (2010) Ionization Polarity as a Cause of Matrix Effects, its Removal and Estimation in ESI-LC-MS/MS Bioanalysis. J Anal Bioanal Tech 1:106. doi: 10.4172/2155-9872.1000106
Copyright: © 2010 Ghosh C, et al. This is an open-access article distributed under the terms of the Creative Commons Attribution License, which permits unrestricted use, distribution, and reproduction in any medium, provided the original author and source are credited.
Visit for more related articles at Journal of Analytical & Bioanalytical Techniques
Abstract
Matrix effect is the effect on an analytical method caused by all other components of the sample except the specific compound to be quantified. Matrix effects and selectivity issues have long been associated with bioanalytical techniques. A number of approaches have been investigated to improve reproducibility and robustness of LC-MS-MS methods that are subjected to matrix effects. In the present research work the role of ionization polarity on matrix effect was studied. Enalapril and its metabolite were analyzed in positive and negative polarity by using ESI-LC-MS/MS. Matrix factor (MF) was determined to evaluate the matrix effects in different polarities. Two different concentration levels of each analyte were used to determine the MF. In positive polarity the MF at two different concentration levels were 0.6353 & 0.6496 for enalapril and 0.6885 & 0.6770 for enalaprilat, whereas, the MF in negative polarity at two different concentration levels were 0.8203 & 0.7717 for enalapril and 1.1124 & 1.0915 for enalaprilat. These data showed approximately 30-35% ion suppression in positive polarity for both the analyte, but approximately 20% ion suppression for enalapril and 10% ion enhancement for enalaprilat in negative polarity. So, matrix effects depend on the ionization polarity also.
Keywords
Matrix effects; Ionization polarity; Phospholipids; LCMS/ MS; Enalapril; Enalaprilat; Metabolite
Introduction
Matrix effect is defined as the effect of co-eluting residual matrix components of a biological sample on the ionization of the target analyte. Basically there are two types of matrix effects, e.g. absolute matrix effect and relative matrix effect. Absolute matrix effect is defined as the difference between response of equally concentrated analytes (standards) in solvent and in matrix extracts. There are two types of absolute matrix effects, one is ion suppression, which is more often observed, and the other is ion enhancement, which may be observed if the standard mixture contains a very large number of analytes but sample extract contains one analyte only. Relative matrix effect is defined as the variation of absolute matrix effects between several lots of the same matrix. The matrix effect may cause the decreased/increased sensitivity of analytes over time, increased baseline, imprecision of results, retention time drift and chromatographic peak tailing.
One limitation associated with LC-MS analysis is its susceptibility to matrix effects [1,2]. Typically, suppression or enhancement of analyte response is accompanied by diminished precision and accuracy of subsequent measurements [2-5]. Matrix effects thus limit the utility of LC-MS for quantitative analysis. However, matrix effects may lead to significant analytical errors due to inconsistent ion generation, which may affect the reproducibility of the result. So, any undesirable effects resulting from a matrix are called ME, whereas, according to the traditional definition of ME, any ion suppression or enhancement to varying degrees between samples, are called ME.
Though there is no single method for elimination of all types of matrix effects, but some typical strategies are commonly adopted to eliminate/minimize the matrix effects: a) by adopting some advanced extraction techniques like solid phase extraction (SPE), or mixed mode SPE, or protein precipitation/ liquid-liquid extraction followed by SPE for comparatively interference free extracted samples; b) by modifying the chromatographic conditions so that the compound(s) of interest elute(s) in a region where matrix effect is not observed. This generally involves altering the chromatography time, but the matrix effect may not always be minimized; c) by dilution of the final extracts, matrix effects can be minimized provided after dilution the lower limit of quantization (LLOQ) response is consistent, reproducible and signal-to-noise (S/N) ratio >5; d) matrix effect can be minimized/ eliminated by reducing the injection volume also; and e) stable-isotope labeled internal standard may also be instrumental in correction of the degree of matrix effects.
It is not always possible to eliminate the matrix effects completely. So in those cases it is mandatory to evaluate and quantify the degree of matrix effects. The Guidance for Industry on Bioanalytical Method Validation [6] states that “In the case of LC-MS and LC-MS/MS based procedures, matrix effects should be investigated to ensure that precision, selectivity, and sensitivity will not be compromised.” The specific methods to evaluate matrix effects are not specified; the approaches to expose matrix effects are left to the discretion of the investigator. For the evaluation of matrix effects basically two procedures are available. One procedure is qualitative evaluation and the other one is quantitative evaluation. The qualitative evaluation procedure is based on the post column infusion of analytes in a chromatographic run along with an extract of a blank matrix, whereas, for quantitative evaluation MF was determined.
In the present study the possible reasons of matrix effects and elimination thereof have been studied. The experiments have been performed on enalapril and its metabolite, enalaprilat by ESI-LC-MS/ MS. From the literature search it has been observed that there are many published papers describing the different reasons of matrix effects, but there are only a limited number of literatures describing the role of polarity of ESI interface on matrix effects. So, the significance of the present research work is to examine the role of different polarity of ESI interface [7] on ME with the help of enalapril and its metabolite, enalaprilat.
Experimental
The quantitative evaluation of matrix effects is described by Matuszewski et al. [8]. Matrix effects can also be quantified in terms of matrix factor [9] for which two sets of samples are required. Set A consists of neat standard solutions (eventually a calibration line), resulting in the reference peak area(s). For set B extracts of 6 different blank matrices are supplemented (after the extraction) with the same amount of standard as used for set A (this then results in peak area(s). The matrix factor (MF) can then be calculated by using the following formula: the area(s) obtained for the set of samples spiked after extraction (B) divided by the area(s) obtained for the neat standards (A), whereby 1, indicates absence of any matrix effect, whereas < 1, means suppression and values > 1, indicate enhancement of the ionization process.
In the present manuscript to evaluate assay specificity, human plasma samples from six different lots were extracted and analyzed for endogenous co-eluting interference causing matrix effect. Two replicates of post extracted spiked samples from six different lots and a set of un-extracted sample at two different concentrations were analyzed using the same assay run conditions to determine the matrix effects. The matrix effects were measured by referring the post-extracted spiked samples to the un-extracted sample, using the following equations:
Matrix factor = B/A ………. [i]
% Matrix effect = [(B-A)/A] * 100 ………. [ii]
where, A, is the response of the neat standard solution and B is response for the post extracted spiked samples.
The experiments outlined here describe an alternative approach which may be used to avoid or minimize matrix issues observed in the development of ESI-LC-MS/MS methods and are illustrated by two specific cases. In case-I, MF was determined in positive ionization polarity, whereas, in case-II, the experiment was performed under negative ionization polarity.
Materials
Enalapril with a purity of 99.7%, and enalaprilat with a purity of 99.29%, were procured from Quality control department of Cadila Pharmaceuticals Limited, Ahmedabad, Gujarat, India and Varda Biotech (P) Limited, Mumbai, India, respectively. All reagents were of analytical reagent grade unless stated otherwise. Water used for the preparation of mobile phase and other solutions were collected from Milli QPS (Milli Pore, USA) installed in the Laboratory. HPLC-grade methanol, acetonitrile, ammonia and acetic acid were supplied by J. T. Baker, USA and Finar Chemicals Limited, Ahmedabad, India, respectively. Drug free Human K2EDTA Plasma used during analysis was supplied by Clinical unit of Cadila Pharmaceuticals Limited, Ahmedabad, India. Plasma was stored at -30±5ºC before sample preparation.
Case 1: sample treatment
A solid phase extraction technique was used to extract enalapril and enalaprilat from plasma sample. Only 380µL plasma sample was transferred to a ria vial for analysis. Then, 20µL of pre-mixed solution of enalapril and enalaprilat and 300µL of 2.0% v/v ortho phosphoric acid were added into it, the sample was vortexed for 15 seconds. Extraction was carried out by 48 positive pressure unit from Orochem with Lichrosep sequence SPE cartridge (30mg, 1mL) from Merck. During extraction SPE cartridges were first conditioned with 1 mL of methanol, followed by equilibration with 1 mL of Milli-Q water. Then, the spiked plasma samples were loaded into it. Cartridges were washed with 1 mL of Milli-Q water, followed by 30 seconds of air drying and then elution was done with 1mL of 0.2% v/v acetic acid in methanol. The eluted solvent was evaporated under the stream of nitrogen gas at 50°C. The dry residue was reconstituted with 200µL of mobile phase.
Instrumentation
The chromatography system consisted of a pair of Shimadzu (Shimadzu Corporation, Japan) LC-20AD pumps controlled via a Shimadzu system controller. A Shimadzu DGU- 20A3 degasser is standard on this system. Sample injection was automated via a SILHTC auto sampler. The compounds were separated on a reversed phase column (Hypurity C18, 50 x 4.6mm ID, particle size 5µ, Thermo Electron Corporation, UK), with an isocratic mobile phase consisting of 0.1% v/v ammonia solution in water and methanol at a ratio of 15:85 v/v. The mobile phase was eluted at 0.300 mL/min. Total analysis time of single injection was 2.0 minutes. Injection volume was 15µL. Auto sampler rinsing volume was 500µL. The auto sampler temperature was maintained at 5°C.
The plasma concentrations enalapril and enalapril at were quantified using Sciex API 4000 LC-MS/MS system (Applied Biosystems, Canada), equipped with an ESI interface used to generate positive ions [M+H]+. Data collection and peak integration were performed using AnalystTM 1.4.2 software. Unless otherwise noted, this mass spectrometer was operated in the multiple reaction monitoring (MRM) modes using positive ion electro spray. Enalapril was monitored with a MRM transition of m/z 377.10→m/z 234.20 while enalaprilat was monitored with a MRM transition of m/z 349.20→m/z 206.10. The following are the API 4000 instrument parameters used for all experiments. Since gas parameters and few other parameters were common for both the molecules, so they were as follows: gas 1 = 30 psi, gas 2 = 40 psi, curtain gas = 10 psi, CAD gas = 12 psi, ion spray voltage = 5500V, turbo heater temperature = 400°C. Whereas, some other parameters like declustering potential, exit potential, collision energy and cell exit potential were different for different m/z. So, for enalapril these were 60V, 10V, 25V, 12V and for enalaprilat 78V, 12V, 29V, 15V respectively.
Case 2: Sample treatment
Sample extraction steps were the same as those for the case-I except for the last step where reconstitution of sample took place. The dry residue was reconstituted with 200µL of mobile phase.
Instrumentation
The plasma concentrations enalapril and enalaprilat were quantified using Sciex API 4000 LC-MS/MS system (Applied Biosystems, Canada), equipped with an ESI interface used to generate negative ions [M-H]-. The compounds were separated on a reversed phase column (Hypurity C18, 50 x 4.6mm ID, particle size 5µ, Thermo Electron Corporation, UK), with an isocratic mobile phase consisting of 0.1% v/v ammonia solution in water and methanol at a ratio of 15:85 v/v. The mobile phase was eluted at 0.300 mL/min. Total analysis time of single injection was 2.0 minutes. Injection volume was 15µL. Auto sampler rinsing volume was 500µL. The auto sampler temperature was maintained at 5ºC.
The ion spray voltage and temperature were optimized to get the maximum response and were set at -4500 V and 350ºC. The typical ion source parameters, viz., declustering potential, collision energy, entrance potential and collision cell exit potential were -65, -42, -10 and -17 V for enalapril and -35, -20, -10 and -5 V for enalaprilat, respectively. Nitrogen gas was used for the gas1, gas 2, curtain gas and collision-activated dissociation gas, which were set at 19, 20, 15 and 4 psi, respectively. Quantification was performed by MRM of the deprotonated precursor ion and the related product ion for enalapril and enalaprilat. The mass transitions used for enalapril and the metabolite, enalaprilat were m/z 375.00→m/z 114.00 and m/z 347.48 →m/z 113.90 respectively, with a dwell time of 200 ms per transition. Quadrupoles Q1 and Q3 were set on a unit resolution. The analytical data were processed by Analyst software (Version 1.4.2; Applied Biosystems).
Preparation of MF samples
To evaluate the matrix factor of enalapril and enalaprilat samples were prepared as above. Plasma blank from six different lots were extracted as per the sample treatment procedure. Then after reconstitution of samples, 20µL of pre-mixed enalapril and enalaprilat solution was added to each reconstituted sample with the replacement of equal volume of reconstitution solution (sample type-I). Along with these samples, a pre-mixed aqueous sample of same composition was prepared for comparison (Sample type-II). These entire samples were prepared at two different concentration levels.
Results
Case 1
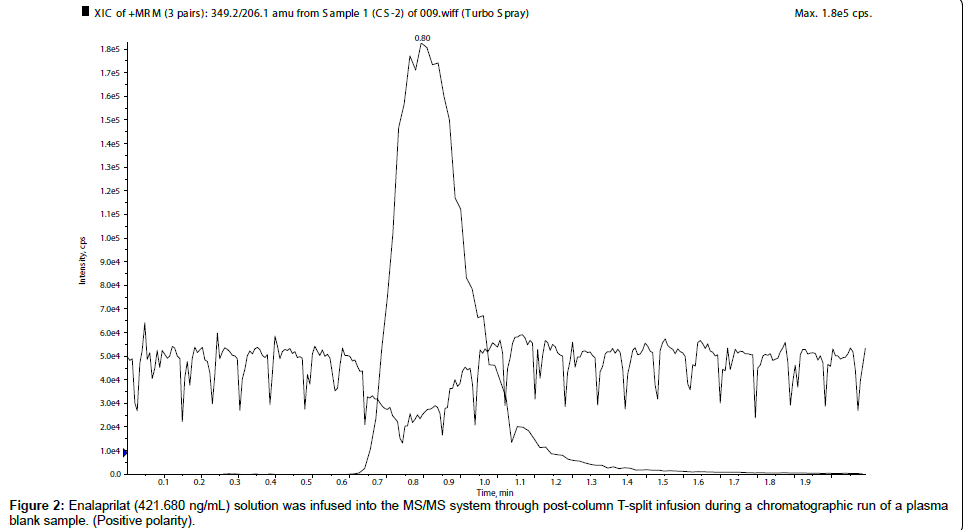
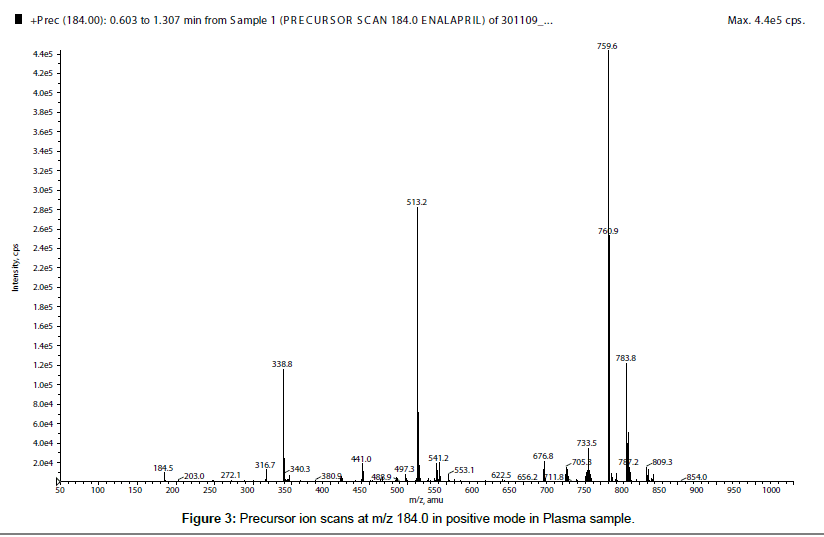
First of all, for qualitative evaluation of matrix effects, enalapril (421.764 ng/mL) and enalaprilat (421.680 ng/mL) solutions were infused into the MS/MS system through post-column T-split infusion during a chromatographic run of a plasma blank sample to check its ME. From the chromatogram it was observed that plasma blank showed negative response at the retention time of enalapril and enalaprilat, which was an indication of ion suppression which was presented in Figure 1, for enalapril, whereas, ion suppression of enalaprilat was showed in Figure 2. There are many published papers describing m/z 184.0 as a common pre-cursor ion for phospholipids [10-14] in positive ion polarity. So to find out the phospholipids causing the matrix effects, pre-cursor ion scan at m/z 184.0 was performed at the retention window of both the molecules, which showed five major ion peaks at m/z 338.1, 513.2, 559.6, 560.9 and 783.8 (Figure 3). So, these were the five major phospholipids [14-16] which were causing the ion suppression/ enhancement.
Further, for quantitative evaluation of matrix effects, matrix factor was determined. For which, responses of extracted samples in duplicate from six different plasma lots i.e. sample type-I was compared with the average response of sample type-II. From the calculations, it was observed that enalapril showed the MF of 0.6353 and 0.6496 at two different concentration levels respectively with a CV within 15%. For enalaprilat the MF was 0.6885 and 0.6770 at two different concentration levels respectively with a CV within 15%. Data was presented in Table 1.
| Analyte name | Concentration (ng/mL) | Positive Polarity | Negative Polarity | ||
|---|---|---|---|---|---|
| MF | % CV (n=12) | MF | % CV (n=12) | ||
| Enalapril | 220.924 | 0.6353 | 2.05 | 0.8203 | 4.52 |
| 421.764 | 0.6496 | 1.44 | 0.7717 | 1.49 | |
| Enalaprilat | 220.880 | 0.6885 | 1.08 | 1.1124 | 2.18 |
| 421.680 | 0.6770 | 1.02 | 1.0915 | 1.56 | |
Table 1: Matrix factor at different polarity.
Case 2
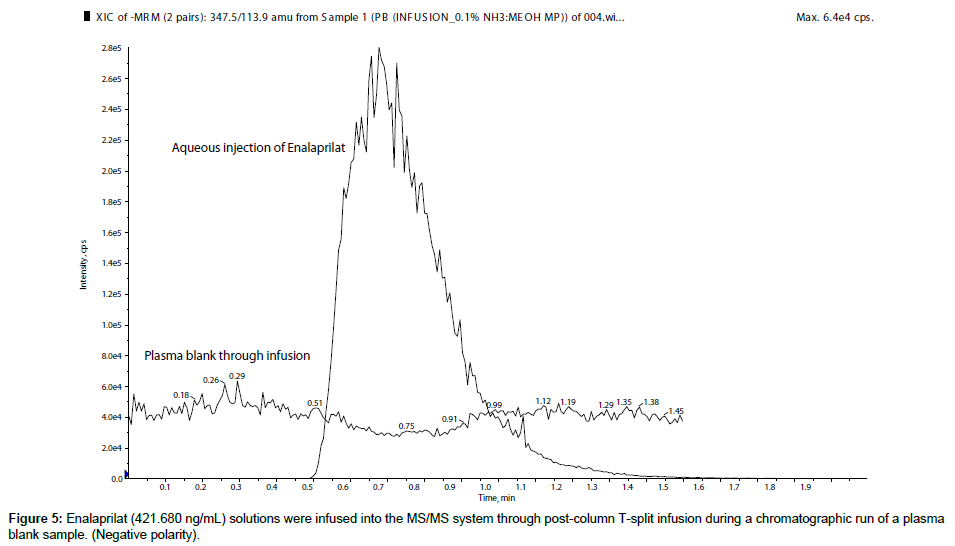
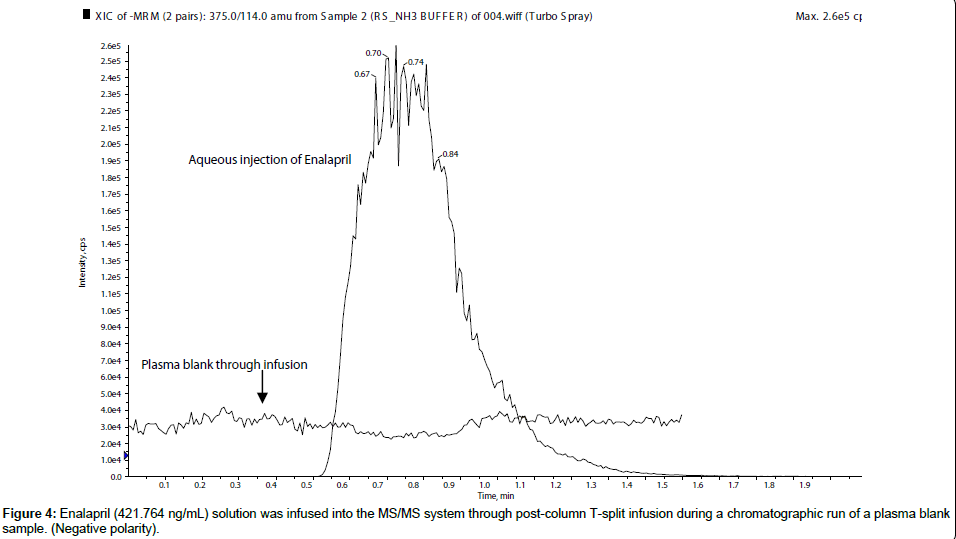
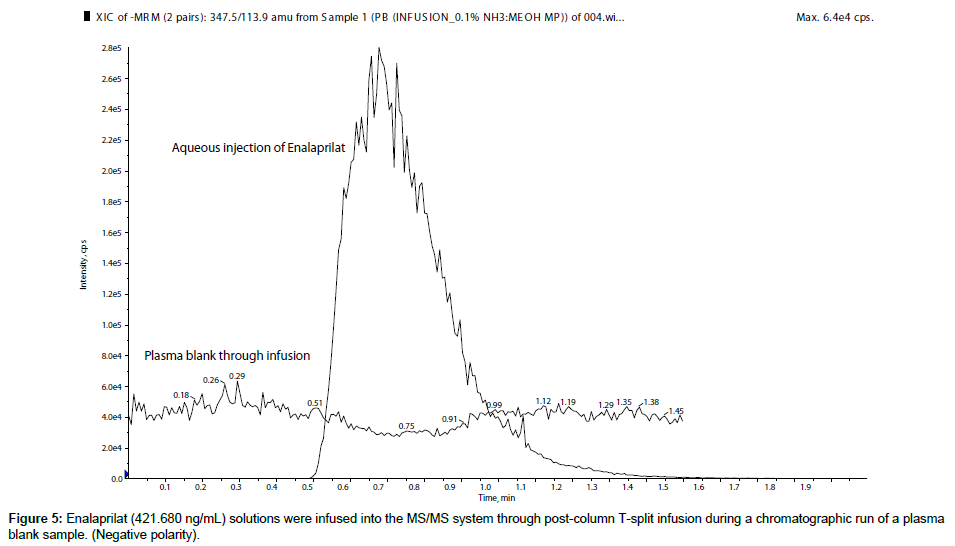
For a qualitative evaluation of matrix effects, enalapril (421.764 ng/mL) and enalaprilat (421.680 ng/mL) solutions were infused into the MS/MS system through Harvard infusion pump along with an injection of plasma blank from auto sampler. From the chromatogram it was observed that both the molecules showed no matrix effects at their respective retention time i.e. in negative polarity it showed almost no ion suppression or ion enhancement for enalapril (Figure 4) and enalaprilat (Figure 5).
Further, for quantitative evaluation of matrix effects, matrix factor was determined. For which, responses of extracted samples in duplicate from six different plasma lots i.e. sample type-I was compared with the average response of sample type-II. From the calculation it was observed that enalapril showed the MF of 0.8203 and 0.7717 at two different concentration levels respectively with a CV within 15%. For enalaprilat, the MF was 1.1124 and 1.0915 at two different concentration levels respectively with a CV within 15%. Data was presented in Table 1.
Discussion
In the present manuscript the role of ionization polarity on matrix effects was studied. During the course of research, enalapril and enelaprilat were analyzed in both the polarity i.e. positive and negative polarity. In post column infusion, both the analytes showed sharp ion suppression in positive polarity. The quantitative analysis was performed to confirm and to measure the degree of ME in terms of MF. The result showed almost 35% ion suppression (average MF for ENP 0.6425 and for ENPT 0.6828) for both the analytes in positive ionization mode. So, further investigation was carried out to find the reason of ME, which revealed the presence of five phospholipids in the retention window of enalapril and enalaprilat.
Then, the post column infusion experiment was performed in negative polarity also, which showed the ion suppression for enalapril and minor ion enhancement for enalaprilat. So, during quantitative analysis it was observed that enalapril showed almost 20% ion suppression (average MF for ENP 0.7960) and enalaprilat showed 10% ion enhancement (average MF for ENPT 1.1020). Even, no major phosphatydilinositols were observed.
Thus, if one cannot remove the ME completely, then the change of polarity will be an alternative approach to remove/ reduce the ME for those molecules which can be detected in both the polarity with good intensity of response. Moreover, polarity changing also showed completely different natures of ME in enaalprilat i.e. suppression in positive mode and enhancement in negative mode. So, it confirms that different polarity plays a major role in ME.
Thus, major cause of ME when using ESI interface is from endogenous phospholipids. Phospholipids are present in extremely high concentrations in biological matrices and their concentrations can vary greatly between subject samples and experimental time points in pharmaceutical studies. Some research revealed [17,18] that even if phospholipids did not co-elute with drugs, the presence of phospholipids in extracted samples could result in retention time shift, elevated baselines, and divergent curves, thus influencing assay performance and ruggedness. It is always preferable to remove phospholipids during sample preparation. However, because removal is not always straightforward or possible in sample preparation, then some other techniques can be used to remove/minimize these ME. ME do not solely relate to the ionization process of LC-MS/ MS, extraction technique, chromatographic techniques but should be considered when developing methods for a variety of analytical techniques where reproducible analysis is required.
Although numerous papers in the LC/MS literature discuss matrix effects [19-29], we believe that assessing its importance during initial assay development has not been sufficiently emphasized in the research community. A current search of the LC/MS literature [28] suggests that in manuscripts describing quantitative analysis from plasma, matrix effects are mentioned in only 20% of them, and are the subject of more in depth focus (appearing in the title, abstract, or keyword) in less than 5%. So, it is very important to discuss the details of matrix effects in every LC-MS analysis. Moreover, those informations may be useful for further advanced research works.
Though the present manuscript emphasizes on the role of ionization mode via polarity switching on evaluation and determination of ME, but there are secondary parameters which are responsible in this abnormality. This different nature of ME was not only related with the polarity, but the mobile phase composition and its pH, might also play a very important role.
From the experiments described in this experimental section, it was observed that the positive polarity in ESI interface was more prone to matrix effects as compared with its negative polarity. Moreover, matrix effects may cause irreproducibility of analytical data. So, where complete elimination of matrix effect is not possible, in those cases determination of matrix factor is must. In this experiment it was showed that the analytical method for analysis of enalapril with metabolite in positive polarity was not free from matrix effects, but the CV of MF was within 15%, therefore the ion formation and detection was consistent. On the other hand, from the experiment it was revealed that there were minor matrix effects in negative polarity for the analysis of the same molecules. The information presented in this manuscript can greatly improve the method development approaches using LC-MS/MS and make the analysis more reliable.
Conclusions
The effect of co-eluting compounds arising from the matrix can result in signal enhancement or suppression in LC–MS/MS analyses. When matrix compounds and analytes enter the source at the same time, competition for ionization arises, and signals of analytes are affected, where analyte signal is attenuated by competition from the ionization of bulk ions inside the solution droplets [31,32]. In this way, matrix effect can affect the reproducibility and accuracy of the method. During method development matrix effect should be evaluated, and if necessary eliminated as much as possible. In the present work, matrix effect is evaluated during method development. Matrix suppression was high; consequently, different approaches were tested in view of minimizing matrix effects. If a molecule ionizes in both the polarity, then by switching the polarity, matrix effects can be minimized/ removed provided the generated ions in both the polarity should be sufficient, consistent and stable. If the method is not free from matrix effects, then it is must to evaluate and determine the matrix effects in term of matrix factor. Since there is no specific guidelines for acceptance criteria of matrix effects, so methods with CV of MF less than 15%, can be considered as a reproducible method and that method can be applied for further studies.
References
- Buhrman DL, Price PI, Rudewicz PJ (1996) Quantitation of SR27417 in Human Plasma Using Electrospray Liquid Chromatography Tandem Mass Spectrometry: A Study of Ion Suppression. J Am Soc Mass Spectrom 7: 1099– 1105.
- King R, Barrish A, Bonfiglio R, McLoughlin D, Merkle K, et al. (1998) Proceedings of the 46th ASMS Conference on Mass Spectrometry and Allied Topics.
- Fu I, Woolf EJ, Matuszewski BK (1998) Effect of the Sample Matrix on the Determination of Indinavir in Human Urine by HPLC with Turbo Ion Spray Tandem Mass Spectrometric Detection. J Pharm Biomed Anal 18: 347–357.
- Mei H, Hsieh Y, Nardo C, Xu X, Wang S, et al. (2003) Investigation of Matrix Effects in Bioanalytical High-Performance Liquid Chromatography/Tandem Mass Spectrometric Assays: application to drug discovery. Rapid Commun Mass Spectrom 17: 97–103.
- Dams R, Huestis MA, Lambert WE, Murphy CM (2003) Matrix Effect in Bio- Analysis of Illicit Drugs with LC-MS/MS: Influence of Ionization Type, Sample Preparation, and Biofluid. J Am Soc Mass Spectrom. 14: 1290–1294.
- Guidance for Industry, Bioanalytical Method Validation (2001) Food and Drug Administration, CDER, 01-22.
- Rogatsky E, Stein D (2005) Evaluation of Matrix Effect and Chromatography Efficiency: New Parameters for Validation of Method Development. J Am Soc Mass Spectrom. 16: 1757–1759.
- Matuszewski BK, Constanzer ML, Chavez-Eng CM (2003) A Systematic Approach to Reducing Matrix Effects in LC/MS/MS Analyses. Anal Chem 75: 3019 - 3030.
- Viswanathan CT, Bansal S, Booth B, DeStefano AJ, Rose MJ, et al. (2007) Quantitative Bioanalytical Methods Validation and Implementation: Best Practices for Chromatographic and Ligand Binding Assays. Pharm Res 24: 1962-73.
- Pucci V, Palma SD, Alfieri A, Bonelli F, Monteagudo E (2009) A novel strategy for reducing phospholipids-based matrix effect in LC-ESI-MS bioanalysis by means of Hybrid SPE. J Pharm Biomed Anal 50: 867-871.
- Du L, White RL (2008) Reducing glycerophosphocholine lipid matrix interference effects in biological fluid assays by using high-turbulance liquid chromatography. Rapid Commun Mass Sppectrom 22: 3362-3370.
- Ismaiel OA, Halquist MS, Elmamly MY, Shalaby A, Thomas Karnes H (2008) Monitoring phospholipids for assessment of ion enhancement and ion suppression in ESI and APCI LC/MS/MS for chlorpheniramine in human plasma and the importance of multiple source matrix effect evaluations. J Chromatogr B Analyt Technol Biomed Life Sci 875: 333-343.
- Ismaiel OA, Halquist MS, Elmamly MY, Shalaby A, Karnes HT (2007) Monitoring phospholipids for assessment of matrix effects in a liquid chromatographytandem mass spectrometry method for hydrocodone and pseudoephedrine in human plasma. J Chromatogr B Analyt Technol Biomed Life Sci 859: 84-93.
- Manicke NE, Wiseman JM, Ifa DR, Cooks RG (2008) Desorption Electrospray Inonization (DESI) Mass Spectrometry and Tandem Mass Spectrometry (MS/ MS) of Phospholipids and Sphingolipids: Ionization, Adduct Formation, and Fragmentation. J Am Soc Mass Spectrom 19: 531-543.
- Liang X, Liu J, LeBlanc Y, Covey T, Ptak AC (2007) Electron transfer Dissociation of Doubly Sodiated Glycerophosphocholine Lipids. J Am Soc Mass Spectrom 18: 1783-1788.
- Ahmed Z, Ravandi A, Maguire GF, Emili A, Draganov D (2001) Apolipoprotein A-I Promotes the Formation of Phosphatidylcholine Core Aldedydes That Are Hydrolyzed by Paraoxonase (PON-1) during High Density Lipoprotein Oxidation with a Peroxynitrite Donor. J Biol Chem 276: 24473-24481.
- Bennett P, Hairui (2004) Overcoming Matrix Effects Resulting From Biological Phospholipids Through Selective Extraction in Quantitative LC/MS/MS. Presented at the ASMS Conference.
- Carter, Spencer J (2006) Non-intuitive Strategies for Minimizing Matrix Effects in Development of Ultrasensitive Bioanalytical LC/MS/MS Methods. Presented at the ASMA Conference.
- Stüber M, Reemtsma T (2004) Evaluation of three calibration methods to compensate matrix effects in environmental analysis with LC-ESI-MS. Anal Bioanal Chem 378: 910–916.
- Taylor PJ (2005) Matrix effects: The Achilles heel of quantitative highperformance liquid chromatography-electrospray-tandem mass spectrometry. Clin Biochem 38: 328–334.
- Basilicata P, Miraglia N, Pieri M, Acampora A, Soleo L, et al. (2005) Application of the standard addition approach for the quantification of urinary benzene. J Chromatogr B Analyt Technol Biomed Life Sci 818: 293–299.
- Kloepfer A, Quintana JB, Reemtsma T (2005) Operational options to reduce matrix effects in liquid chromatographyelectrospray ionization-mass spectrometry analysis of aqueous environmental samples. J Chromatogr A 1067: 153–160.
- Zrostlikova J, Hajslova J, Poustka J, Begany P (2002) Alternative calibration approaches to compensate the effect of co-extracted matrix components in liquid chromatography-electrospray ionization tandem mass spectrometry analysis of pesticide residues in plant materials. J Chromatogr A 973: 13–26.
- Souverain S, Rudaz S, Veuthey JL (2004) Matrix effect in LC-ESI-MS and LCAPCI- MS with off-line and on-line extraction procedures. J Chromatogr A 1058: 61–66.
- Alder L, Lüderitz S, Lindtner K, Stan HJ (2004) The ECHO technique—the more effective way of data evaluation in liquid chromatography-tandem mass spectrometry analysis. J Chromatogr A 1058: 67–79.
- Dams R, Huestis MA, Lambert WE, Murphy CM (2003) Matrix effect in bioanalysis of illicit drugs with LC-MS/MS: Influence of ionization type, sample preparation, and biofluid. J Am Soc Mass Spectrom 14: 1290–1294.
- Bonfiglio R, King RC, Olah TV, Merkle K (1999) The effects of sample preparation methods on variability of the electrospray ionization response for model drug compounds. Rapid Commun Mass Spectrom 13: 1175–1185.
- Avery M (2003) Quantitative characterization of differential ion suppression on liquid chromatography/atmospheric pressure ionization mass spectrometric bioanalytical methods. Rapid Commun Mass Spectrom 17: 197–201.
- Ghosh C, Singh RP, Inamdar S, Mote M, Chakraborty BS (2009) Sensitive, Selective, Precise and Accurate LC-MS Methid for Determination of Clonidine in Human Plasma. Chromatographia 69: 1227-1232
- Ghosh C, Jha V, Ahir R, Shah S, Shinde CP, Chakraborty BS (2010) A rapid andmost sensitive liquid chromatography/tandemmass spectrometry method for simultaneous determination of alverine and its major metabolite, para hydroxy alverine, in human plasma: application to a pharmacokinetic and bioequivalence study. Drug Test Anal 2: 284-291.
- Mallet CR, Lu Z, Mazzeo JR (2004) A study of ion suppression effects in electrospray ionization from mobile phase additives and solid-phase extracts. Rapid Commun Mass Spectrom 18: 49–58.
- Marchese A, McHugh C, Kehler J, Bi H (1998) Minimization of ion suppression in LC–MS/MS analysis through the application of strong cation exchange solidphase extraction (SCX-SPE). J Mass Spectrom 33: 1071-1079.
Relevant Topics
Recommended Journals
Article Tools
Article Usage
- Total views: 19517
- [From(publication date):
November-2010 - Dec 09, 2025] - Breakdown by view type
- HTML page views : 14404
- PDF downloads : 5113

