A BIM-Based Visualization Tool for Facilities Management: Fault Detection through Integrating Real-Time Sensor Data into BIM
Received: 06-Feb-2020 / Accepted Date: 13-Feb-2020 / Published Date: 20-Feb-2020 DOI: 10.4172/2168-9717.1000228
Abstract
A building information model (BIM) can be used as a platform to track sensor data, which is useful for facilities management (FM). One method is to use the Revit API (application programming interface) to integrate BIM and sensor data.
Keywords: US National Building; Building information model; Facilities management
Introduction
Building information modeling (BIM)
According to the definition by US National Building Information Model Standard Project Committee, BIM is “a digital representation of physical and functional characteristics of a facility” [1]. This digital representation (3d model) is rich in data and information which can be shared for multiple purposes, such as energy simulation, clash detection, cost evaluation, and facility operations and management. This 3D digital representation benefits not only designers, but also engineers working with systems, and facilities managers responsible for the operation of the building. Autodesk’s Revit is a commonly used BIM software program.
Leveraging BIM for facilities management (FM)
A prominent characteristic that BIM and FM share is a huge amount of data. FM keeps the function of a building on track and to implement FM services, a tool that gives easy access to data is useful. There are intrinsic synergies between BIM and FM [2]. One of the biggest potential contributions of BIM for FM, however, lies in its long-term competence of providing FM services in the operation and maintenance (O&M) phase. The duration of O&M phase spans 30 years or even more, and the cost of building O&M makes up 75%-85% of the total cost, which imposes considerable influence on and offering possibilities of huge cost saving to the industry [3]. Therefore, for the sake of improved maintenance, energy savings, and reduced costs in the long run, an efficient BIM-based tool for FM services is necessary.
Sensor data
Sensor data is the output of sensors that responds to a specified kind of measurand (input) from the ambient environment. The original data itself is only values and strings stored in data repositories and not easily meaningful at first sight. Therefore, processing and analyzing the data is the key to having a better insight into the underlying information hidden in the data. One of the main purposes of sensor analytics is to find trends and patterns. Graphical presentations of data is helpful in understanding how the data fluctuates and determining if the fluctuation is haphazard or periodic. By reading the trends and patterns, researchers can not only figure out what happened and what is happening, but also predict the change of data in the future. Another purpose of sensor analytics is to find out anomalies. By examining deviations from a pre-established setpoint, people have a better understanding of what is not in good condition or out of control. This is significant for proactively preventing equipment failure, warning information can be generated for troubleshooting and maintenance when a part of heating, ventilation and air conditioning (HVAC) system does not function properly [4].
Integration of BIM and sensor data
With the advent of “smart building” technology, more buildings have been equipped with intelligent building automation systems (BAS). In a BAS system, several types of sensors are needed to continuously acquire a large amount of data [5]. Real-time sensor data helps with evaluating building performance and data-driven decisions related to facility operation and management [6]. The employment of BIM-andsensor- data integration is not confined to buildings. It also applies to other structures that require daily monitoring and management, such as bridges and dams.
One of the strategies to integrate BIM and sensor data is to attach real-time data accumulated in sensors to geometric and spatial information extracted from BIM model [6]. Such a “dynamic” BIM model goes beyond a static source of information that comprises only limited design and construction data. Through this dynamic BIM model, facility managers will be able to visualize and monitor the status of sensors and facilities [7]. Problems can also be detected and located immediately.
Dynamic BIM models have the potential to minimize the cost on facility restoring, and lowering the possibility of abnormal conditions that jeopardize the comfort and safety of building occupants. In addition, when documentation of data is needed, or when assessing the performance of both facilities and their managing personnel, the data saved in the BIM will be of importance. An example of integrating of BIM and sensor data was carried out by researchers in Virginia Polytechnic Institute and State University [7]. The case study studied combining temperature sensor data and bridge deck model to evaluate the performance of deck de-icing system. Since Revit does not support the direct storage of data, the research team took advantage of Revit Application Programming Interface (API) and wrote an external plugin to make connections between the model and sensor data. With this external plugin, data was imported into Revit in the form of schedules, and data visualization and statistical analyses were shown in separate windows.
BIM+sensor data+fault detection
The purpose of sensor fault detection is to identify faults and pinpoint the location and type of them. The definition of “faults” can be described as the deviation from normal sensor measurements, which indicates an abnormal working status of sensors due to hardware malfunction or failure. However, there is another interpretation on “faulty” sensor measurements, based on the concept of thermal comfort rather than the performance of sensor hardware. In the context of indoor thermal comfort, “faults” are detected on the grounds of comfort zones. Some main standards of thermal comfort and comfort zones include American Society of Heating Refrigeration and Air Conditioning Engineers (ASHRAE) and International Standardization Organization (ISO).
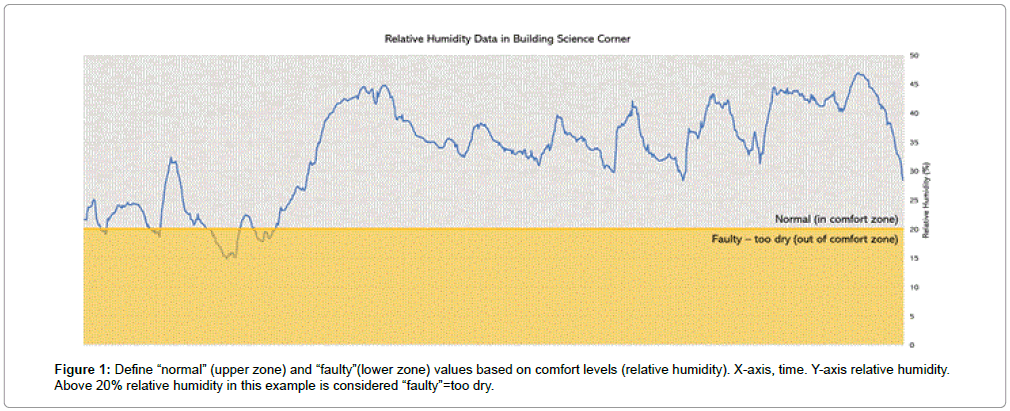
As an example, RH data from one of the data feeds collected is examined with the comfort RH range (20%-80%) defined by ASHRAE 55-2017 [8]. Any RH values lower than 20% or higher than 80% will be defined as “faulty” and not desired for good thermal comfort (Figure 1). The same rule can be applied to temperature as well.
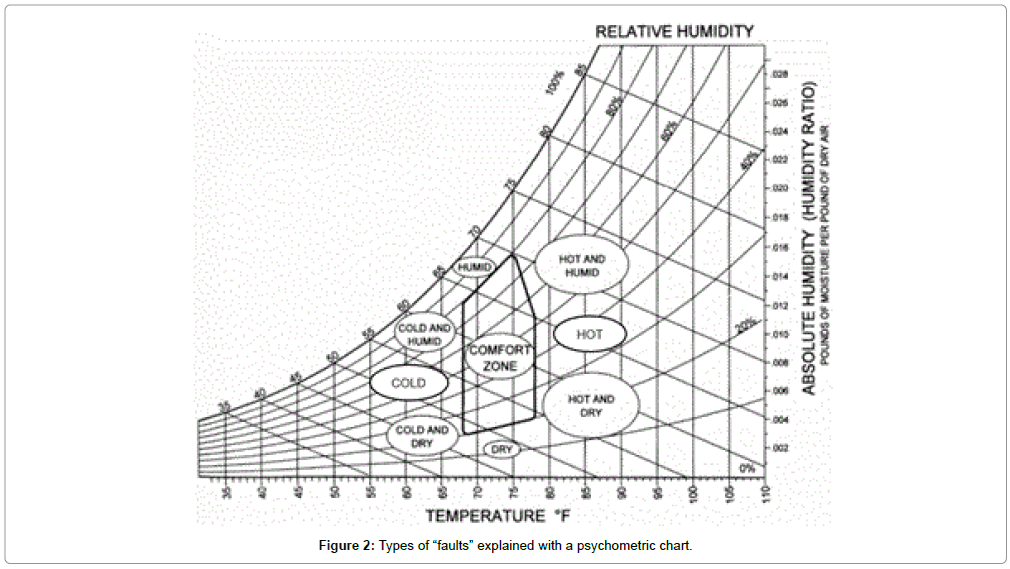
Types of “faults”, when explained with a comfort zone and a psychrometric chart, are linked with how people feel about the thermal condition in the space where she is in. In this context, there can be up to eight types of faults as combinations of temperature and humidity: “hot,” “dry,” “cold,” humid,” “hot and dry,” “hot and humid,” “cold and humid,” and “cold and dry” based on psychometric chart (Figure 2).
As BIM is commonly used in architecture and construction, and a digital model can be supplied to the facility manager of a building, it is possible to use it for building performance maintenance. One way it can be used is to visually track sensor data and provide fault detection. In this case, comfort ranges (temperature and humidity). “Values out of ranges” indicates the existence of anomalous sensor data values. The definition of “ranges” is based on ASHRAE 55-2017 comfort zone, in which temperature ranges from 68℉ to 78℉, and RH ranges from 20% to 80%. Besides ASHRAE 55-2017, ISO 7730 can also be used for defining ranges [9].
Background Research
There have been several previous research projects and case studies of the application of BIM for FM including those for BAS (or BMS) and the integration of its real-time data into BIM models. A BIM-FM framework requires the exchange of information between BIM models and dispersed information systems.
Understanding the framework of BIM for FM
The value of BIM application in FM lies in that BIM improves the current manual process of information handover, contributes to more accurate and accessible FM data, and more efficient work order execution Kassem et al. 2015. However, BIM for FM faces challenges ranging from methodologies, shortage of knowledge about implementation requirement and BIM expertise in FM industry [10]. In addition, people do not know enough about the value of BIM for FM due to the lack of real-life cases.
Different BIM for FM strategies can be mapped out based on various FM needs proposed by clients. As a result, the framework of BIM for FM differs, and factors such as modeling requirements, BIMFM interoperability and deployment of dispersed information systems should be considered separately for every single project. This section introduces some case studies of BIM application for FM, with a focus on what information systems are integrated and how BIM interacts with these systems.
Case study #1: Northumbria University: Northumbria University is located in Newcastle upon Tyne, UK. The case study started in 2010 and lasted for five years. In the investigation of the University’s information system, it was found that the drawings and information were stored in two different repositories, which resulted in extra workload for manual updates. Scanned elevations, sections, and photos for verifying construction details were also saved in separate environments. Dealing with all sources of information was time- consuming and requires attention of FM personnel. BIM was introduced to simplify FM workflow and reduce the need for technicians. FM personnel do not need to switch between software since these sources are integrated into Revit. The use of Revit made possible the automatic and instant update of schedules, elevations and sections, 3D models and renderings. In this case, Revit worked as a hub of information from other systems, and it also provided reliable source of various presentations of information.
Case study #2: Carnegie Mellon University: Researchers from Carnegie Mellon University developed an integrated multi-view visualizer for interfacing HVAC information to support troubleshooting of HVAC-related problems. In this visualizer developed with Java, users are exposed to a total of eight modules that collects information from a wide range of information systems. The visualizer integrated floor plan view (d), 3D model view (f) and schematic diagram view with text annotations of sensor data from BAS (e). This combination provides clear representation of the location of HVAC components and helps with the real-time monitoring of their working status. By selecting any components from the list (c), information [(d) (e) and (f)] of the corresponding components will be displayed. The visualizer also supported the management of text-based work order information. In work order context (a), users can specify problem type and problem spatial scope. Information about HVAC system type and control system type is also available. In the complaints log (b), new work orders for the currently displayed component can be created and historical work orders are available for examining the past performance of the component [11].
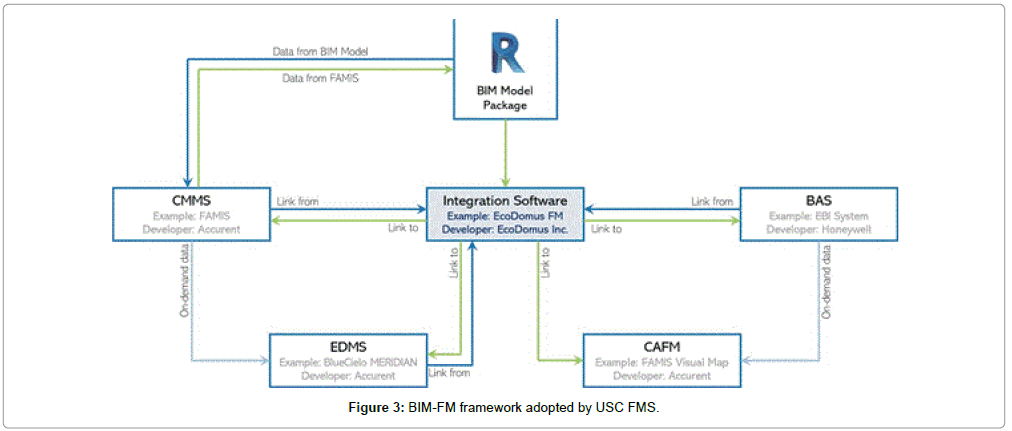
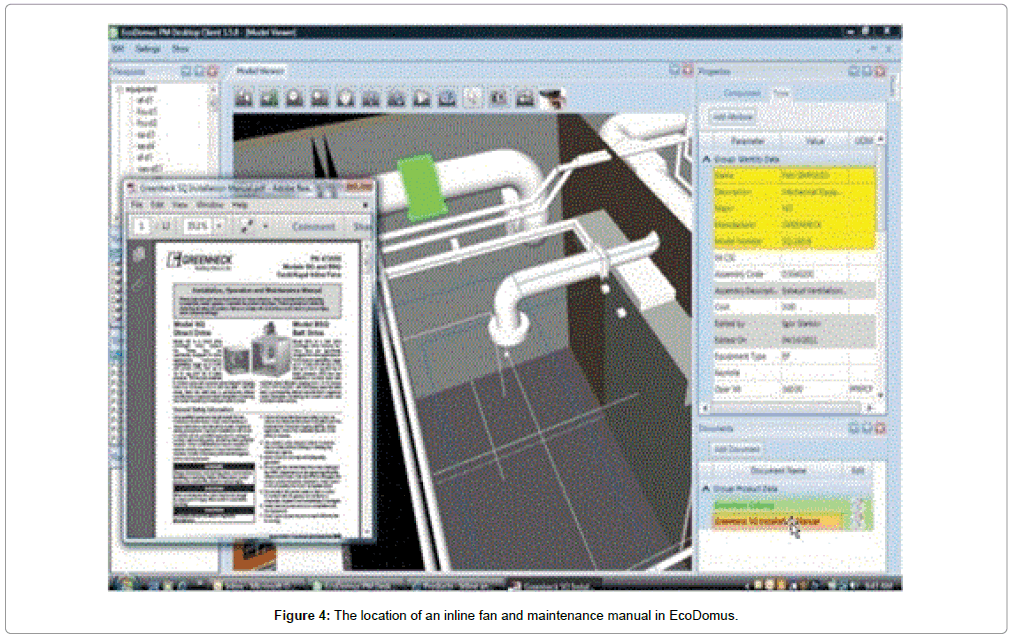
Case study #3: University of Southern California: Facility management in USC is one of the best examples that showcases the links and exchanges of information between systems (Figure 3). EcoDomus FM serves as the center of the BIM-FM framework, integrating information from BIM and other systems including CMMS, BAS, EDMS and Computer-Aided Facility Management (CAFM) System. For example, the 3D view shows the position of an inline fan and highlights it with green. General information about this fan originally resided in CMMS is displayed on the right. And at the same time, the operation and maintenance manual of the fan, which is stored in EDMS, is shown on the same interface as the 3D model and equipment information (Figure 4). There is also a BAS-related pane designed for displaying conditional data conventionally managed by the BAS. Examining information and data through an integrated interface saves time since FM personnel does not need to switch repeatedly from one system to another. Such integration also helps FM personnel get more comprehensive knowledge about components, and gives technical support to them in case troubleshooting or maintenance work is necessary [12].
Integration of sensor data into BIM
An increasing number of modern buildings have become more intelligent with the help of building automation system (BAS), which acquiring data from numerous sensors. Sensor data, if appropriately used, can be beneficial in terms of assessing building and facility performance and as a result, supporting the decision-making process during the operation and maintenance of a building. However, analyzing sensor data alone does not contribute much to understanding facility condition, since data makes far more sense when they are analyzed in a “context” [5]. This context can be provided by spatial information from building information models, which enables a visualized and integrated way of data analysis. For instance, by integrating into BIM models data from temperature sensors installed in HVAC systems, FM managers can look for discrepancies between temperatures in adjacent rooms to detect system faults [13,14].
BIM is a powerful tool for managing building information during a complete lifecycle. Attempts of integration BIM with various sensing technologies and devices are made in past research projects regarding multiple areas in building automation [15]. For example, temperature, humidity, and energy consumption sensors were used to implement post occupancy evaluation (POE) and real-time energy performance in a residential building [16]. Data retrieved from fire sensors were utilized for establishing a fire alarm management system to determine the authenticity of fire alarms and to prevent disturbance because of false alarms [17].
The integration of sensor data with BIM is not confined to indoor environments. An example of such integration is the application of RFID and GPS sensors for building a fusion model that estimates locations of tools, equipment and materials in construction projects [18]. A second example is the use of load sensors in a crane navigation system where the position of lifted objects are displayed in the context of a building and surroundings. Meanwhile, real-time data is collected through sensors and video cameras [19].
Sensor data: Sensor readings are a series of data ordered by a particular rule, mostly by time. The structure of a reading could vary a lot, but some key attributes such as sensor ID, reading ID, data value, and time stamps are always required. Other attributes besides these key attributes are supplementary, and it is up to users to determine whether they should be integrated into BIM models or pruned. For example, a sensor reading downloaded from Adafruit IO contains up to 11 attributes (Table 1).
| Attributes | Explanation |
|---|---|
| “id” | The ID for current line of sensor reading. |
| “value” | The sensor data value. |
| “feed_id” | The ID for the feed. A “feed” is a plain text file consisting of data values and other attributes for a single measurand. |
| “feed_key” | The feed key. A unique string used by users to get access to the feed. |
| “created_at” | The timestamp recording when this sensor reading is created. |
| “location” | The location where the sensor is installed. |
| “lat” | The latitude at which the sensor is installed. |
| “lon” | The longitude at which the sensor is installed. |
| “ele” | The elevation (height) at which the sensor is installed. |
| “created_epoch” | Another form of timestamp. |
| “expiration” | The expiration time of current line of sensor reading. |
Table 1: Attributes in an IoT sensor reading.
Attributes in bold and italic, such as “id”, “value”, “feed_id” and “created_at”, are four key attributes that are indispensable for the integration into BIM.
One of the main challenges of sensor data readings is the overwhelming increase of data in a short period of time. Therefore, a reliable data repository or a database (online or local) is necessary for the recording and query of data [5]. However, there is always a limit of capacity for the amount of data that comes into the repository, so a common practice is to discard past readings and replace them with most recent ones. This explains why there is an attribute called “expiration” in Table 1. For example, in Adafruit IO, a sensor recording can be kept for a maximum of 30 days.
Sensor metadata: Sensor metadata can be considered as descriptions of data, or “data about data” [20]. It provides necessary information for sensor discovery and data processing [5]. Sensor metadata generally falls into four categories:
a) Static information about the experiment: background and phenomena measured by the sensor network;
b) Static information about the sensor: background data about the sensors including what they sense (temperature, humidity, CO2, pressure, etc.) and where they are located;
c) Dynamic sensor data: information about the sensor’s status, e.g. whether or not it is working or out of order, lacks power, completely broken, etc.;
d) Dynamic data quality information: continuous information about the quality of the data.
One major purpose of the sensor metadata is to easily keep track of anomalies. For example, when faulty values are detected in data analysis, researchers want to find out what specific sensor is responsible for the abnormal data values. To locate the correct sensor, a database of sensor metadata including the sensor’s serial number and other categories of supporting metadata can be developed. Dawes et al. developed a sensor metadata repository (SMR) and integrated it with Microsoft SensorMap, a platform for publishing, browsing, and searching for sensor data based on a geospatial interface Dawes et al. 2008. Points of real-time sensor data are distributed on the map based on the location where sensors are installed. At the same time, users can take advantage of the “time traveler” feature in SensorMap to select any point of time and see sensor data at that point. SensorMap also allows users to share and publish real-time data and metadata from their sensors so the data can be searched on the map [21]. Different types of sensors can be distinguished by their different icons.
An example of BIM+BAS (building automation system) integration: Dasher 360: A good example of BIM+BAS integration is Dasher 360 developed by Autodesk [22]. Dasher 360 collects data from a wide range of sensors including temperature, RH, CO2 concentration, sound level and light intensity sensors. Dasher 360 gives excellent support to the visualization of sensor data information with graphs and quick navigation to sensors in the BIM model, but the lack of sensor fault detection is a main limitation.
In Dasher 360, users can choose any sensor both from the sensor list and the model. When choosing a sensor from the list, users can click on the sensor name to examine the historical data values in a line plot. When choosing from the model, users need to point the cursor to the sensor (which is represented by a dot) to check the value. By clicking on the “Go To Sensor” button next to the sensor name, users can be navigated to where the sensor is installed in the model.
Overall, as an ongoing research project, Dasher 360 is an excellent integration of BAS data into BIM by locating multiple types of sensors in the model and by appending real-time sensor data to these models. One major limitation is that it although it displays data numerically and as line plots, there seems to be a lack of alert information related to potential problems with sensors and data. For example, the loss of a large amount of data values observed in March 2015 should have been announced by warnings, either somewhere on the main interface or in the sensor list, in order to figure out the cause of this data value loss. These warnings are important in terms of reminding users of sensor malfunctions during real-time data monitoring and provide information for locating and fixing problematic sensors. Dasher 360 has developed from Project Dasher (Autodesk Research Group) into a mature software tool that displays historical and real-time sensor data for use with Revit models. It is an excellent platform for providing owners and facilities managers with a better understanding of the realtime building performance. One drawback is that it does not seem to analyze the data being presented to determine if the sensors are working (not showing data) or are within defined comfort ranges.
Other research examples of BIM+sensors: There is a growing area of relevant research about BIM and the use of sensors. Kazado et al. makes the case that “the BIM model cannot show real-time information related to the performance of the building in the operational stage.” They propose three methods to solve that problem through combinations of the sensors, Revit, and Navisworks so that not only facilities managers, but also occupants, can benefit from access to the data [23]. Others give case studies where sensors were put in social housing and comfort parameter readings were taken within the building information model [24]. Another approach used augmented reality to visualize sensor readings by programming Dynamo in Revit and using unreal engine (a common game engine) for the augmented reality [25].
It is not only the visualization of the data from the sensors that is important, but the actually placement of the sensors is critical, “incorrect sensor [light] placement can compromise system performance, cause discomfort to occupants and diminish savings” [26]. Their research suggested a method for optimization of placement of the sensors. Another research project focused on using light sensors to control shades and louvers in a building information model through the use of Dynamo rather than the Revit API [27]. BIM+sensor data is an expanding research area; these are just a few examples. None of the examples read showed the link between both comfort and fault visualization in BIM.
Fault detection algorithms
Fault detection has successfully played its role in many engineering domains including automotive and industrial manufacturing for decades, but its application in AEC industry is still under development [28]. Real-time data in buildings need to be monitored to ensure the proper function of facilities and equipment. At the same time, however, detecting anomalies among data sets and problematic behaviors associated with them is also indispensable. Fault detection is achieved by developing algorithms. Some of them are quite simple and straightforward, such as statistical generation model (SGM) based on logarithm likelihood and Adaptive-neuro fuzzy inference system (ANFIS) based on squared prediction error (SPE) index. However, these algorithms sometimes may lead to incorrect results. Advanced algorithms using machine learning or artificial intelligence can also be used.
Statistical generation model (SGM): Different strategies and algorithms for fault detection and alarm generation were proposed by past researchers. A straightforward implementation of fault detection is realized by taking advantage of a “statistical generation model (SGM)” proposed in a research related to BAS. First, a model is constructed based on normal behavior. Then, parameters in this normal behavior model is optimized with a maximum likelihood algorithm. With this optimized model, incoming values are examined and compared to this model. “Logarithm likelihood” or “log-likelihood” is the key to the SGM model since it determines whether a value is normal or faulty. Every value in the SGM model has its log-likelihood of appearance. A value will be considered as faulty if this log-likelihood falls below a specific threshold [29].
Adaptive-neuro fuzzy inference system (ANFIS): Another method of fault detection is called “Adaptive-neuro fuzzy inference system (ANFIS)”, in which neural network learning algorithms and fuzzy reasoning are used. In ANFIS method, a squared prediction error (SPE) index is invented to detect sensor faults by calculating the deviances of measured values from predicted values [30]. When ANFIS method is used, SPE index can be calculated with the following formula:

where ym stands for measured values and yp for predicted values.
To test the fault detecting ability of ANFIS method, researchers introduced a complete sensor fault of 100 μg/m3 to a PM10 sensor from the 80 th sample. Test results showed that the SPE index increased quickly and exceeded the threshold value marked by the red line. This result indicates that large deviances of measured values from predicted values happened starting the 80 th sample, and the sensor is not working properly. It can also be observed that the SPE index values fluctuates intensely as soon as the fault was introduced, with some values fall back to below the threshold value. These values after the 80 th sample and below the line are incorrect results, because they indicate that the sensor is working properly, which is contradictory to the fact. Therefore, a limitation of this method is the accuracy of results.
Machine learning algorithms: Besides SGM and ANFIS method, there are also a great variety of more advanced fault detection algorithms. These advanced algorithms are more robust and accurate, and usually involve the application of machine learning and/or artificial intelligence. There is an algorithm that features the “prediction-correction” process, during which an updated estimation of system state is provided every time a new measurement is available [28] In addition, machine learning can be combined with a probabilistic model of prediction produced as a result of Gaussian process regression to detect malfunctions in HVAC systems [31].
Simple algorithms: A fault detection algorithm does not always have to be complex to be useful. It just has to be accurate within the bounds of its context. For example, a null reading from a temperature sensor in a room is also a fault as a value is expected. Determining the reason for the null reading might be complex, but the algorithm (check for null readings) is not. A second example is checking for a value within a specified range. If the value is not in the range, it is a fault. For example, a temperature set point might be 72°F (22.2°C) and the float 3°F (20.6°C to 23.9°C) to achieve comfortable working conditions. A temperature reading of 80°F (26.7°C) would be considered a fault in this case, but perhaps not for another set of conditions/ranges.
Methodology- Adafruit io Reader Tool
Revit allows users to add new features to its existing functions. These new features can be plugged into the software by coding in Revit API with Microsoft Visual Studio, in Revit Macro development environment, or by coding graphically in Dynamo. The Revit API features the combination of BIM parametric modeling and programming functions. Users can take advantage of this interacting programming method to design and manipulate Revit elements through customized algorithms and computational logics. One of the benefits of using Revit API is that it frees users from repetitive manual operation with automatic batch processing developed for particular functions [32].
Adafruit IO is a free cloud-based service that serves primarily to display, store, and retrieve real-time data. It is compatible with both hardware and software such as Arduino and Python. With Adafruit IO, users can keep their projects connected to the Internet or other internet-enabled devices. Feeds are central to Adafruit IO. They work as repositories of both sensor data uploaded by users and metadata, for example, the date and time when a piece of sensor data information is created or GPS coordinates (longitude, latitude, and elevation) of the sensor. Data feeds can be added, deleted, downloaded, and exported as CSV or JSON files for analysis. Furthermore, they can be shared. Depending on the size of the group with which a user plans to share his/her data, fine-tuned sharing and privacy controls can be applied to allow and restrict access to data feeds. Any data sensors could have been used in this research project. Arduino was chosen because of its easy cloud links, and some sensors had been previously placed in the case study building. For a real building installation, more reliable sensors should be used.
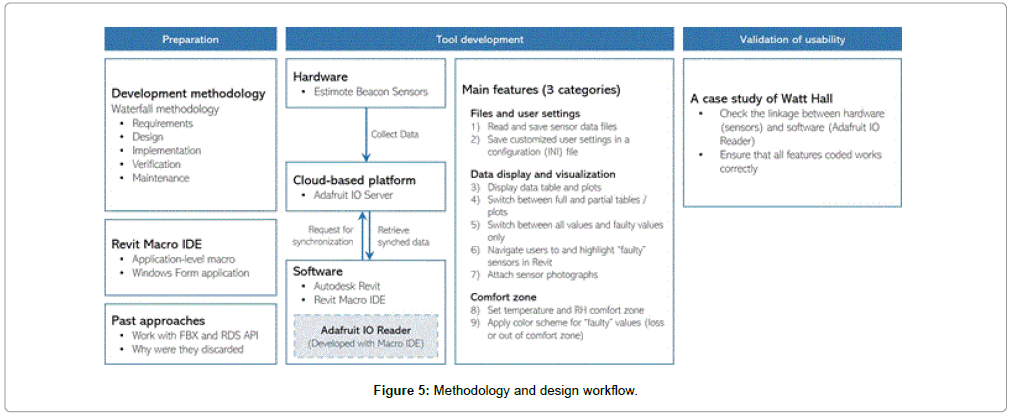
Adafruit IO Reader is a new Revit plugin that was written to integrate IoT sensor data and BIM to visualize sensor data and navigate users to corresponding sensors in Revit. There are three phases to the workflow in creating the Adafruit IO Reader tool: Preparation, tool development, and validation of usability (Figure 5).
Preparation
The code that supports the Adafruit IO Reader Tool was developed in Revit Macro IDE. An application level macro is more desirable to ensure that the tool can be opened in more than one Revit session. A second reason for choosing Revit Macro IDE is that all necessary references have been loaded automatically when a new macro is created.
Tool development
Sensor data and a 3D model are two key items necessary before starting the tool coding and development. It was verified that the data can be acquired for a relatively long period of time and that the 3d models and every single element that comprises them can be manipulated (for example: Applying color fill/outline or changing material, etc.) by code.
Two types of connections can be found in the developing process. A unidirectional connection exists between beacon sensors (hardware) and Adafruit IO Server (cloud-based platform). Sensors collect data, and upload them to the server. In contrast, the interaction between the cloud-based platform and software is bidirectional. Adafruit IO Reader (software) developed with Macro IDE in Revit initiates requests for synchronization to retrieve data from the server, and at the same time, the server provides data files by downloading data to a local folder and importing to Adafruit IO Reader.
Note that not all data from the server is necessary. For example, these IoT sensors in the research collect real-time temperature, relative humidity (RH), and voltage data. However, researchers might want to focus only on those measurands that are directly associated with the ambient environment. In this case, only temperature and RH data values were collected. These values are combined with pre-defined parameters including setpoints and comfort zone ranges (threshold values) to generate alerts when there are sensors that fault.
A Revit model was obtained of Watt Hall, and five sensors were deployed to test the software as it was being developed. Five sensors were chosen for the practical reason that they were available. The intent of the case study was to show that real data could be shown in Revit and a determination of a fault made. It didn’t really matter how many sensors were actually installed.
Based on the defined requirements, there were nine main features to be coded, divided into three categories:
Files and user settings:
• Read sensor data file from Adafruit IO server and save them in a designated local folder.
• Save customized options by writing to and reading from a configuration file (INI file) to ensure that they will not be lost when the program is relaunched.
Data display and visualization:
• Display the data in both data tables and plots.
• Tables and in can be switched between “full” mode and “partial” mode based on a time range set by the user.
• Tables can be switched between “all values” mode and “faulty values only” mode.
• Navigate tool users to sensors with faulty values and highlight their positions in Revit.
• Attach sensor photographs that match the sensor model.
Comfort zone:
• Set temperature and RH comfort zone to define “normal” and “faulty” values.
• Highlight loss of values and/or values out of comfort zone (“faulty” values) with different color schemes in data tables.
Detailed workflow of tool development
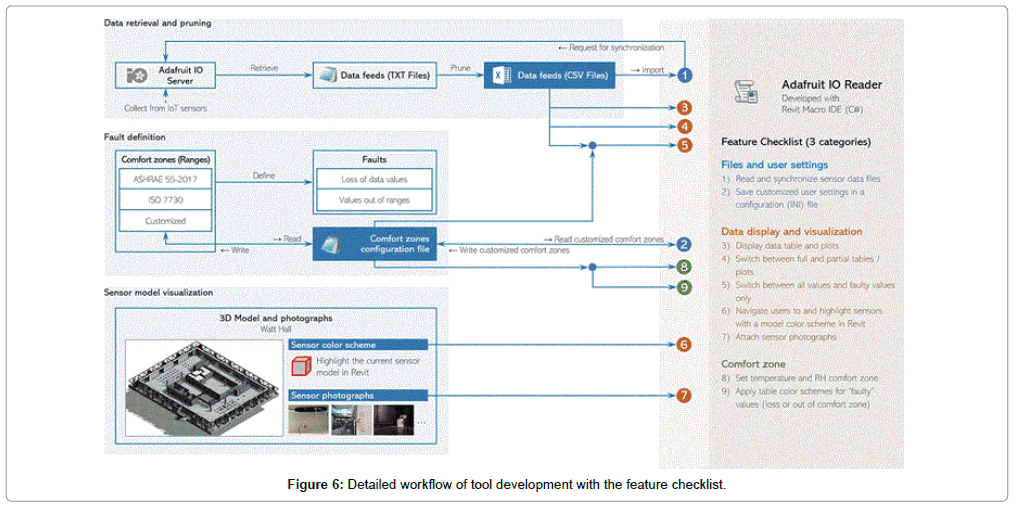
The tool development is feature-oriented and can be divided into three sections: Data retrieval and pruning, fault definition, and sensor model visualization (Figure 6). Features in Adafruit IO Reader were realized either using information from only one section (e.g. feature 1,4,6,9), or combining information from multiple sections (e.g. feature 5).
Section #1: Data retrieval and pruning: The first section concentrates on building the “hardware-platform-software” connection for data retrieval and pruning (Figure 7).
IoT sensors update data at a regular interval of 15 minutes. All data are stored on Adafruit IO Server, and users can sign in with a valid username and password on the Adafruit IO homepage to get access to data. With the username and the AIO key, a query that gets all available feeds from the user can be as simple as a URL in web browsers, like this:
https://io.adafruit.com/api/v2/{username}/feeds?X-AIOKey={ AIO key}
On this feed information page, all feed IDs and feed keys for current user are available. Every feed in Adafruit IO is assigned a unique feed key that can be used to check real-time data in this feed.
https://io.adafruit.com/api/v2/{username}/feeds/{feed key}/ data?X-AIO-Key={AIO key}
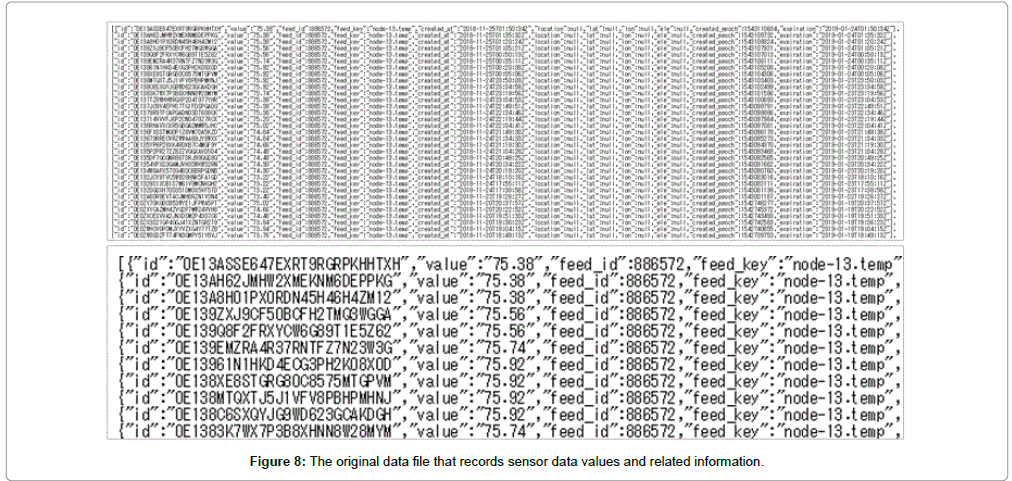
After replacing the strings in the braces with a valid username, feed key and AIO key, users will be led to the data feed file. It includes not only data values, but also information about the data ID, feed ID, feed key, created time, created epoch and expiration time (Figure 8).
In addition to checking out information about all feeds or feed data values, there are also a large number of commands that make changes to the feeds, such as inserting, replacing and deleting, etc., as long as the username, feed key and AIO key are provided. This simplicity of authentication allows more users to get access to and manipulate data without signing up for an Adafruit IO account and improves the efficiency of sharing data within a research group. However, this simple retrieval of data requires that everyone involved takes confidentiality very seriously. In case the key is accidentally given away to non- group members, the research advisor or group leader can generate a new key to make the previous one invalid.
The original data files were downloaded from Adafruit IO Server and saved as CSV files by executing C# codes in Revit Macro IDE. But these CSV files need to be pruned before they are imported into the Adafruit IO Reader. The process is divided into three main steps: Prune, reorganize, and translate date and time. The first step of pruning is to reduce redundancy. The file contains many secondary attributes that do not have values (null) or are not relevant to the needs of the Adafruit IO Reader. The tool omits all supplementary information and focus on only primary attributes, including “value”, “feed_id” (feed ID) and “created_at” (the time when the value is created). The second step is to reorganize these files to make sure the information can be displayed in correct positions when they are opened with Excel. In the CSV files after the first step, attributes and their numeric or nominal values are in pairs and this formation applies to the whole file from the first to the last line. Therefore, all the attributes should appear only in the first line as the header of data tables. The rest of the file belongs to values that corresponds to attributes. Square brackets (“[]”), braces (“{}”), and quotation marks (") were completely removed from data files. The third step is to work with time and date. Because the time recorded in these data files are based on Zulu Time or Greenwich Mean Time (GMT), which is 8 hours ahead of Pacific Time in Los Angeles, all the hour values need to be subtracted by 8 to do the time zone conversion (add 16 to hour values and subtract day value by 1 if hour values is less than 8), and get all “T” and “Z” removed by replacing them with spaces. The sensors do not know that they are in Los Angeles or where they are located in the building. They need to be told this.
All the steps above are realized by a C# function in Adafruit IO Reader. CSV files after pruning are ready to be imported into the tool and displayed in both tables and line plots. In addition, these files will be connected to sensor models in Revit to achieve the goal of visualization through combining real-time sensor data and 3D models.
Section #2: Fault definition: Two types of faults are considered in the tool development: Loss of data values and values out of ranges (Figure 9).
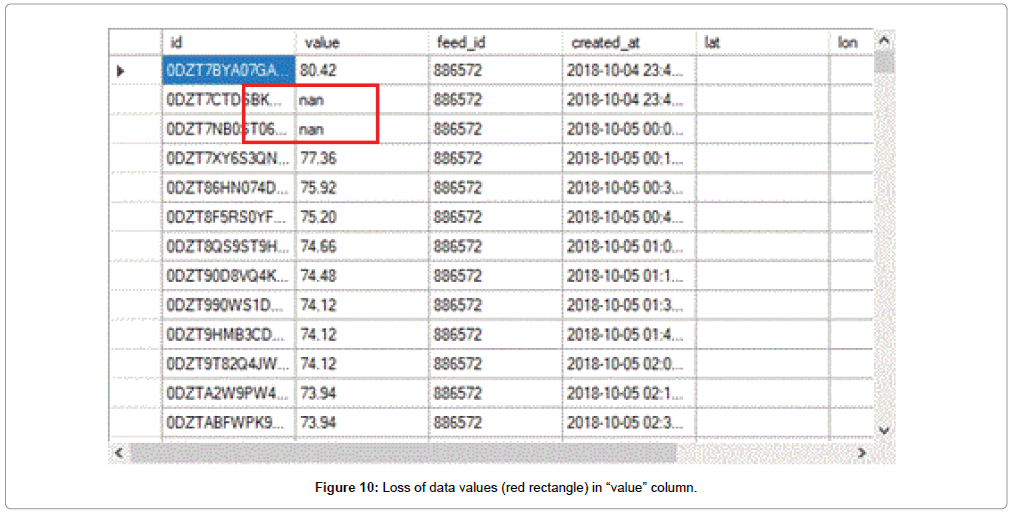
“Loss of data values” means there is no valid temperature or RH data at a specific point of time. This results in a “nan” no value (Figure 10) in a data table and it is often related to hardware glitches or battery power issues.
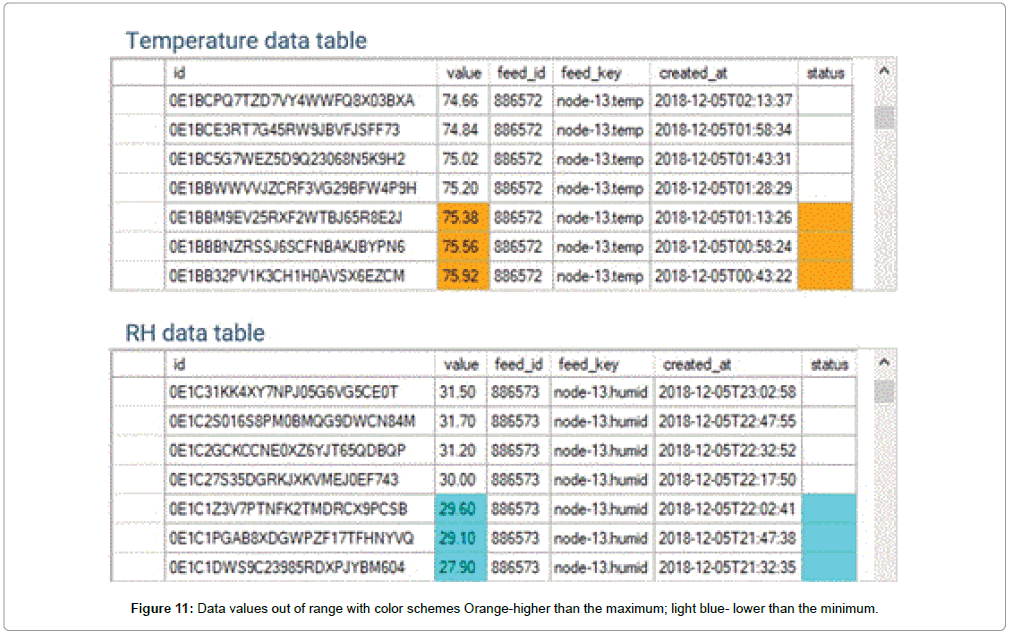
“Values out of ranges” indicates the existence of abnormal sensor data values. The definition of “ranges” is based on ASHRAE 55-2017 comfort zone, in which temperature ranges from 68℉ to 78℉, and RH ranges from 20% to 80%. Besides ASHRAE 55-2017, ISO 7730 can also be used for defining ranges. All data values that do not fall in these ranges are treated as “faulty” and result in colored cells in data tables on the main interface (Figure 11).
Although it is easy to spot the “nan” (no value) in the charts, the software highlighted values in the data table in orange for those higher than the maximum value and light blue for those lower than the minimum value.
In addition to ASHRAE and ISO comfort zones, users are free to customize these own comfort zones to fit the needs of thermal comfort in different places. However, there is a problem with customized comfort zones. Manually set numeric values will be reset to default values after the program is restarted. Therefore, an extra configuration file that stores these values is required to save customized settings. Customized values are written to this file from comfort zone dialog box in the tool, and they can be read from the file to replace default values when the same dialog box shows up. Introducing the configuration file reduces repetitive typing work, which renders Adafruit IO Reader more user-friendly.
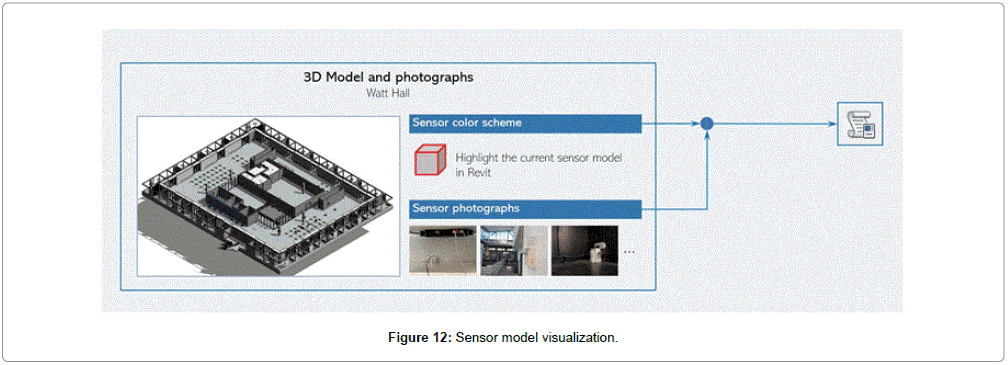
Section #3: Sensor model visualization: The third section focuses on various visualization strategies, including 3D models with color schemes and on-site photographs (Figure 12). This visualized information was combined with data files to finally accomplish the main goal of Adafruit IO Reader to integrate real-time sensor data into BIM. During the post-development phase, the usability of completed tool was evaluated. IoT sensors in Watt Hall (WAH) were used as a case study. The two main evaluation items were the following:
• The connections of cloud-based platform (Adafruit IO Server) with hardware (IoT sensors), and software (Adafruit IO Reader) are effective through validating synchronizations of data with the Server;
• All features and functions coded (1-10 in Section 3.1.2.1) work properly as expected and/or produce correct outputs.
Only under the circumstances where both items are checked and considered successful can Adafruit IO Reader be deemed effective or usable.
Watt Hall Case Study
Overview
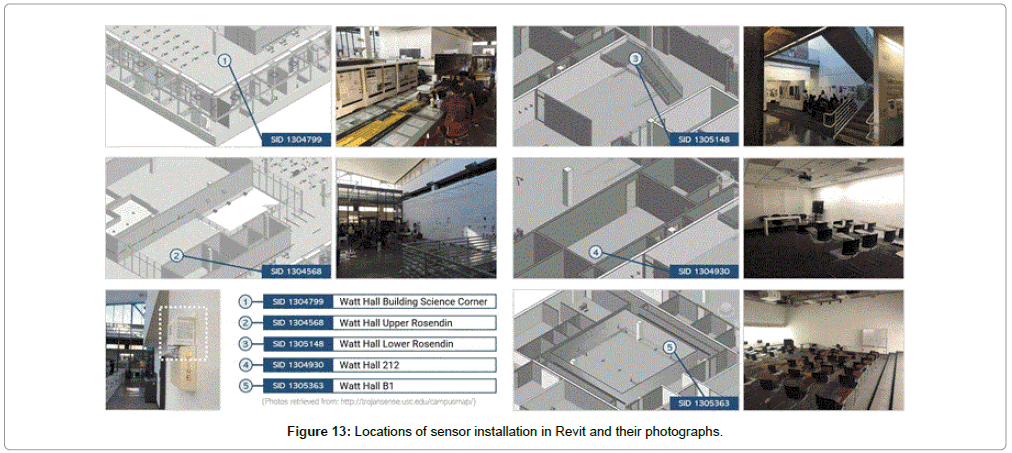
Watt Hall on the USC campus was selected as the case study building. The five-story building covers a net area of 67,855 square feet, with three stories above ground and one underground with a mezzanine. Five IoT sensors are installed in different locations in Watt Hall for data collection (Figure 13). These sensors are originally installed by a researcher from a project named TrojanSense. In this project, real-time sensor data are collected and analyzed along with occupants’ expected thermal status to establish a data-driven comfort model that lends credibility to adjusting HVAC systems [33]. Temperature and RH data in Watt Hall third floor southeast corner (building science corner), Upper Rosendin (two sensors), Watt 212, and Watt B1 was gathered and at the same time uploaded to Adafruit IO server. With the approval from the leader of TrojanSense project, the access to sensor data feeds on the server was granted for the development of Adafruit IO Reader.
The intent was to demonstrate that the data from the five sensors could be retrieved by the Adafruit IO Reader, values shown in Revit as both tabular and line plots, and faults detected and highlighted in color with the corresponding sensor and its location.
Hardware
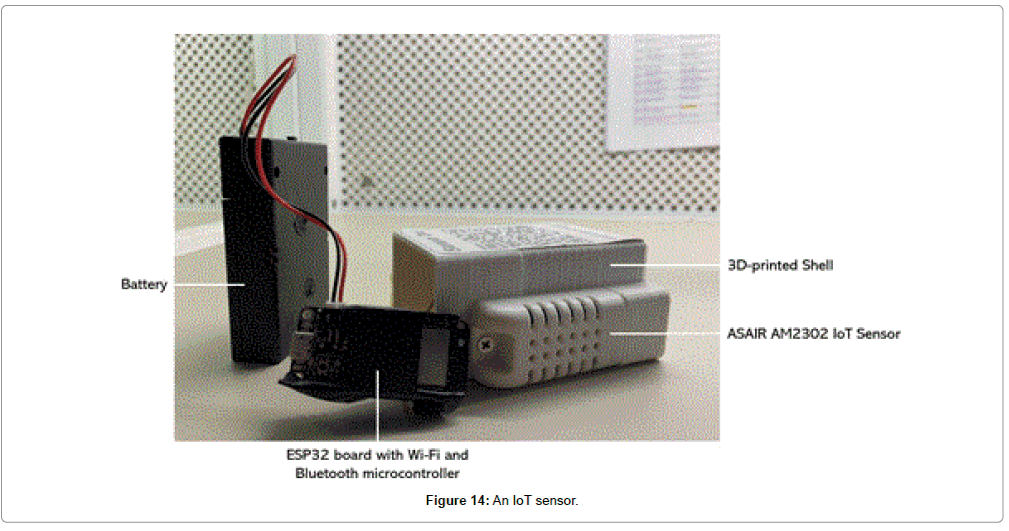
The hardware used in the case study were developed by the TrojanSense team. They consist of ASAIR AM2302 IoT sensors powered by AA batteries and connected to Arduino ESP32 board with a Wi-Fi and Bluetooth microcontroller (Figure 14). These sensors collect temperature, relative humidity, and voltage data.
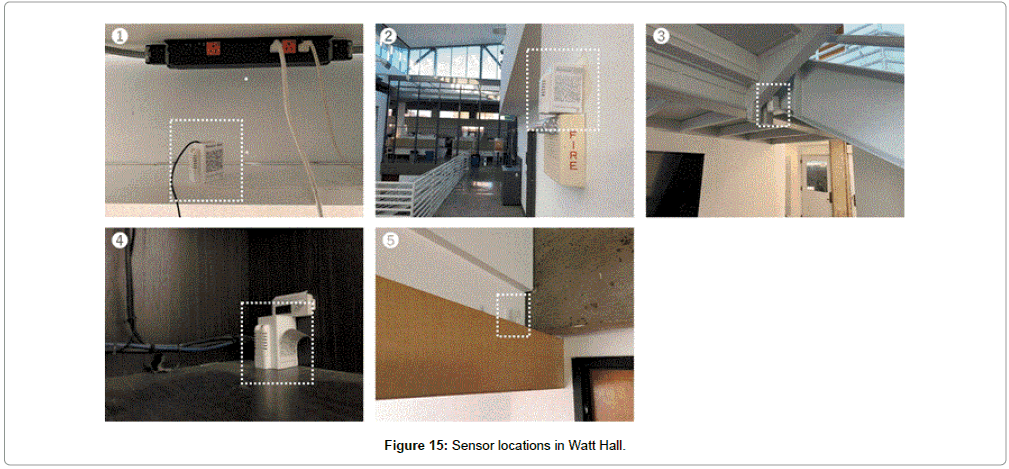
Sensors were attached to the outside of the 3D-printed shells. Batteries supplied power to ESP32 boards and microcontrollers. These parts were put into the shells and installed under a studio desk in Watt Hall, in the Building Science corner, on a fire alerting device in Upper Rosendin, on the staircase connecting Lower and Upper Rosendin, under the desk in Watt Hall 212, and on the wall in Watt Hall B1 (Figure 15).
Software
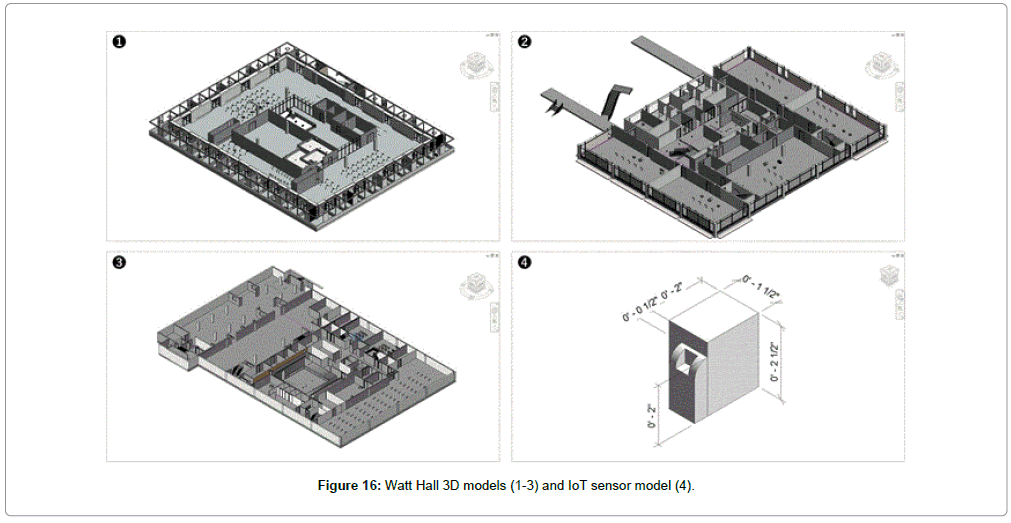
The Revit model was provided by USC FMS. 3D views of 3rd floor, 2nd floor and basement were used (Figure 13). The opacity of some building elements and the viewing angles are adjusted to ensure that sensor models are visible. The model of IoT sensors were created as a Revit family to be added to the model based on “Sensor Photos” and measurement of sensor dimensions (Figure 16).
To work with Adafruit IO Reader, the first step is to get program files and copy them to the specified folder. The project file “Adafruit IO Reader.zip” can be downloaded from GitHub (https://github.com) by searching “Adafruit IO Reader Ver. 0.5”. The program is started with Macro Manager in Revit, which can be found near the right end in “Manage” ribbon. First, select “Application” tab control and any macro from A to E. Then, click on “Run” button to run the selected macro.
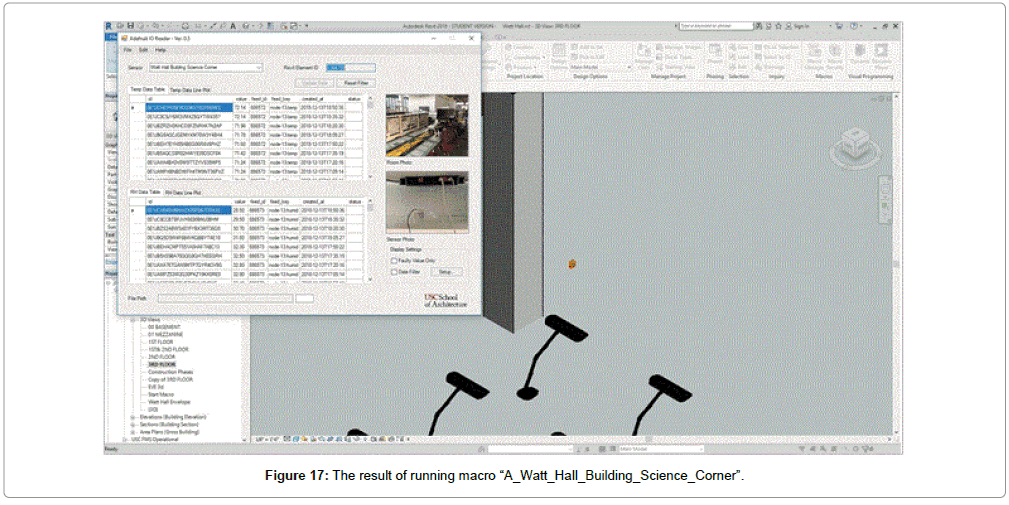
Running the macro brings up the highlighted sensor model in a 3D view and the main interface of Adafruit IO Reader with real-time sensor data retrieved from the server (Figure 17).
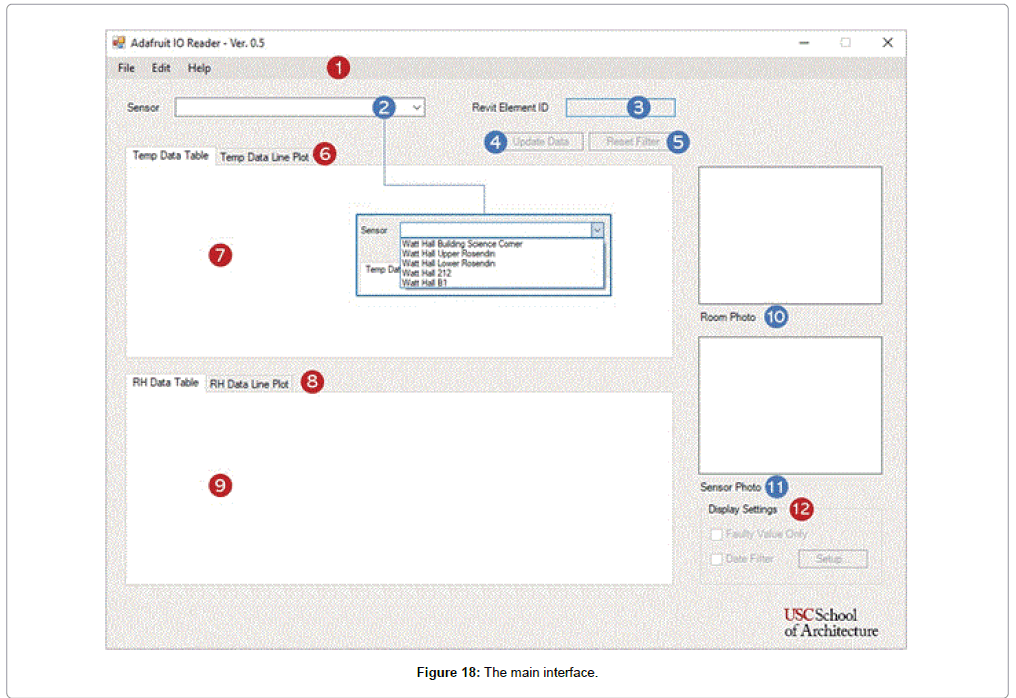
In the main interface of the Adafruit IO Reader, most of the space on the main interface window is used for data table view panels and line plot view panels visualizing sensor data. The interface is currently comprised of 12 functional modules (Figure 18).
• Menu bar items: Menu commands related to synchronizing sensor data with Adafruit IO server, clearing data display on the interface, editing thermal comfort zone and file path for storing sensor data files.
• Sensor list: A dropdown list containing five IoT sensors installed in Watt Hall. By selecting any sensor from the list, the program automatically load temperature and RH data files and display them in view panels. At the same time, the program takes users to the selected sensor model and zoom in to the view of that sensor.
• Revit element ID: Every sensor model in Revit is assigned a six-digit Revit element ID. This is used in source code to create the many-to-one relationship between data feeds and a sensor model.
• Update data: A shortcut button for synchronizing sensor data with data feed stored on Adafruit IO server.
• Reset filter: A temporary button for developer’s testing and debugging only. This will be removed in future versions.
• Temperature tab control: Switch between temperature data table and line plot.
• Temperature view panel: Display temperature data table (by default) and line plot.
• RH tab control: Switch between RH data table and line plot.
• RH view panel: Display RH data table (by default) and line plot.
• Room photo: Display the photo of the room where the sensor is installed.
• Sensor photo: Display the close-up view of the sensor.
• Display settings: The settings related to manipulating data tables such as filter values according to start and/or date, or the status of values (faulty or normal).
Data retrieval, pruning, and synchronization: Sensor data is not automatically synchronized with the latest version on the server. It must be done manually either from menu bar or the shortcut button on the interface. The average time spent on data syncing in the tool is approximately 8 seconds per time, so it is not ideal to make tool users wait by synchronizing data every time the program is launched.
Save customized settings: The bidirectional interaction between the configuration file and Adafruit IO Reader can be used for customized comfort zones. The program reads the customized setting from the file and displays the setting in the Comfort Zone window, where users are free to adjust the threshold values for new settings.
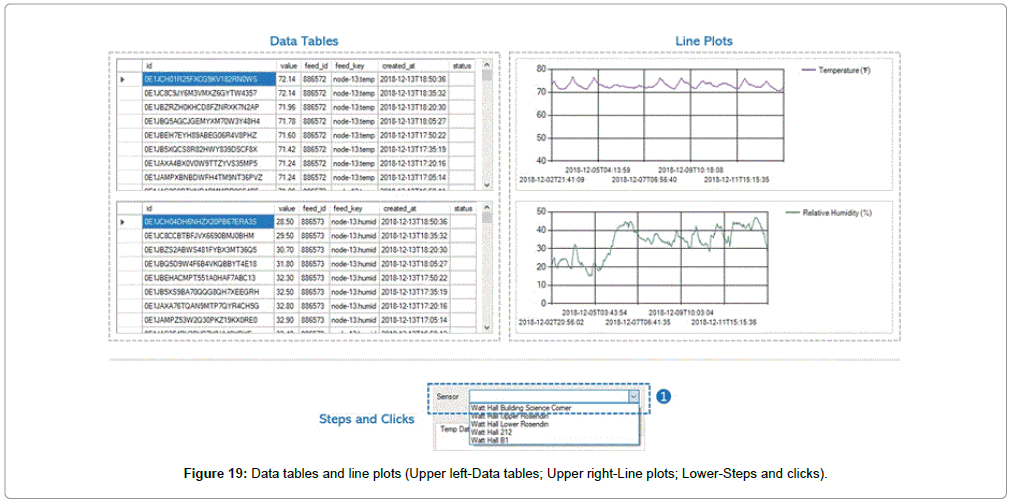
Data tables and plots: Data tables and line plots take most of the space on the interface, and they serve as the basis of other program features. Data tables in Adafruit IO Reader share the same layout as those CSV files that can be opened with Excel upper left (Figure 19). The most recent 1,000 data values are available in both data tables. This is the amount of data for approximately 15 days. Past values older than 15 days will be erased and replaced by new values to dispose space for storage. Line plots, as a more visualized presentation, are generated based on data values in the second column upper right (Figure 19). Users can switch between tables and graphs with tab controls at the upper left corner of view panels. Both data tables and line plots can be manipulated by different display settings to allow users to focus on a specified portion of data.
Full and partial tables/plots: Manipulation of data tables is completed by “Display Settings” on lower right corner of the main interface. One of the settings is named “Date Filter.” Sometimes, there may be a time range of interest where data values need special attention. Adafruit IO Reader provides a date filter that allows users to focus on only an excerpt from the full table. Either start date or end date, or both dates can be used for setting a range. The filter works on not only to data tables, but also line plots. With such a filter, the line plot view looks like “zoomed in”, enabling the observation of data fluctuation in a more legible manner with a smaller scale.
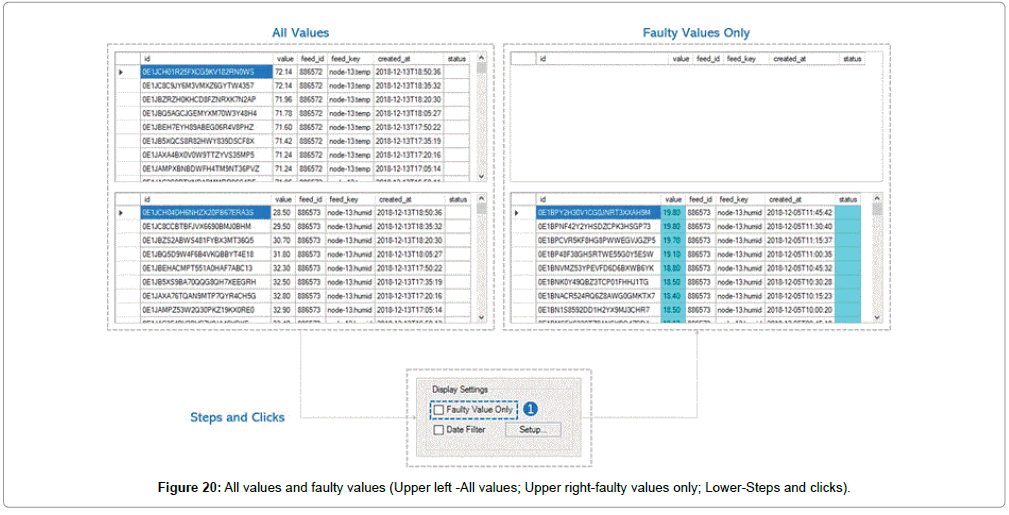
All values and faulty values: Another “Display Setting” is named “Faulty Values Only.” To enable this, users just need to check the “Faulty Values Only” box in “Display Settings” lower (Figure 20). This feature was designed for users to quickly locate faulty values defined by the current comfort zone at work. All values within the comfort zone are filtered out by this setting. A blank data table indicates that all values recorded are considered normal upper right (Figure 20). When “Faulty Values Only” box is checked, line plots will be temporarily unavailable since the appearance of faulty values is, in most cases, sporadic rather than continuous. Such data values with little or completely no chronological continuity are not sufficient for generating line plots.
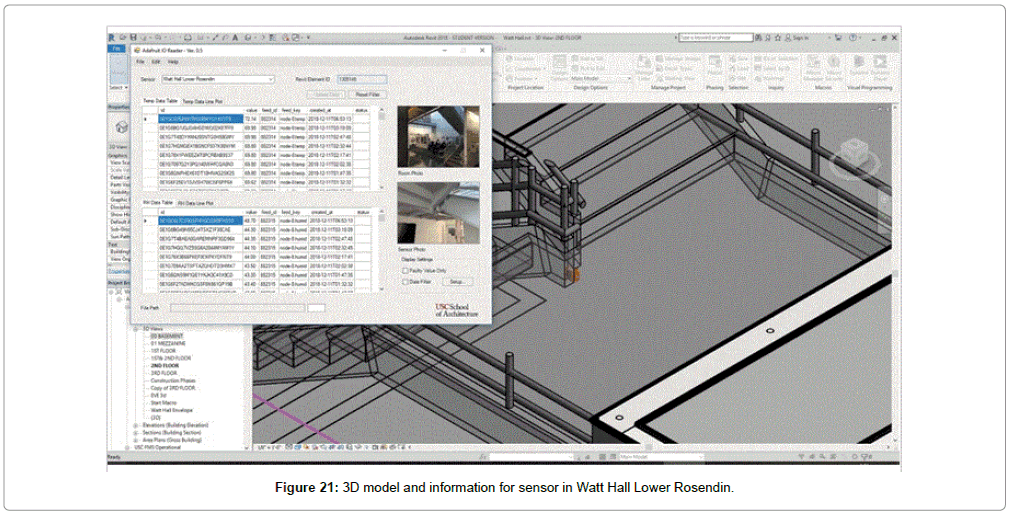
Navigation to sensor models: When “Run” button is clicked, Revit will begin to execute codes in the selected macro and switch current view to the sensor model associated with this macro (Figure 21). Meanwhile, the main interface will show up, providing a wide range of information including sensor data value tables, line plots, currently working comfort zone, etc. Users can also take advantage of features introduced in previous sections, such as “Display Settings,” to manipulate the display of data.
On-site photographs: For every sensor in the list, “Room Photo” and “Sensor Photo” are displayed next to data tables. These photographs were stored in a separate folder, and they can be updated by replacing files at any time. Photographs are tied up with data tables, so every time a sensor is chosen from the combo box and corresponding data tables loaded, these photographs will show next to tables.
Comfort zone presets: The comfort zone options define an acceptable range for data values that can be considered as “normal.” Two major standards of thermal comfort zone, ASHRAE 55-2017 and ISO 7730 (including summer and winter), are provided in the tool for needs in different indoor environment. Thredshold values for ASHRAE and ISO comfort zones are read from psychometric charts and saved as presets.
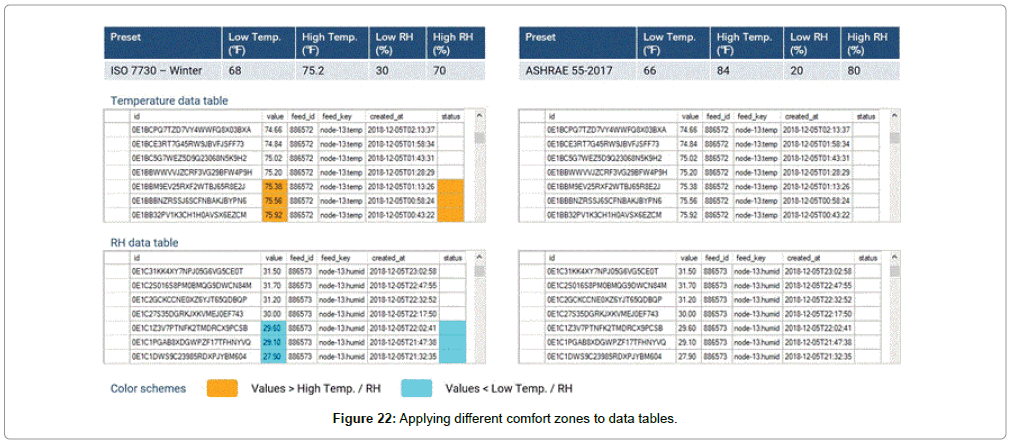
Color schemes: Color schemes are associated with the definition of comfort zones. With a comfort zone set, data values can be categorized as “too high,” “normal,” or “too low.” Color schemes are assigned to these three kinds of values. Values higher than the maximum threshold value are marked with orange, while those lower than the minimum are colored with light blue (Figure 22). By applying color schemes, users can easily distinguish “faulty” values and when these values occurred, which can help with figuring out the reason for faults.
Discussion and Future Work
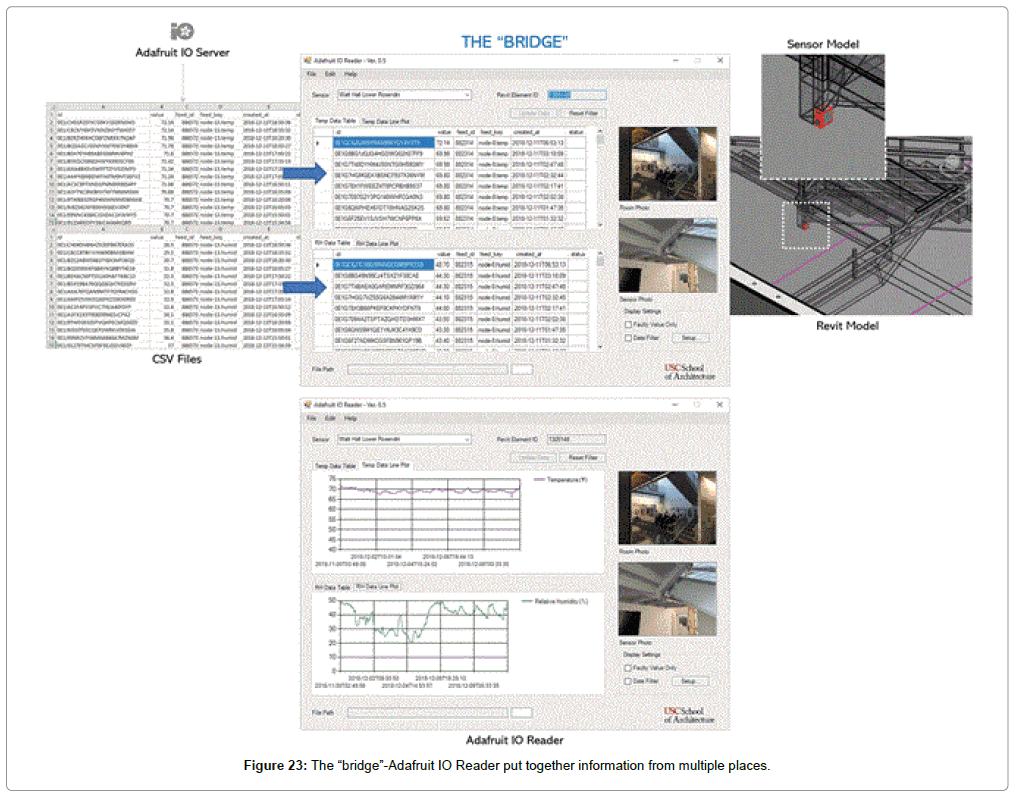
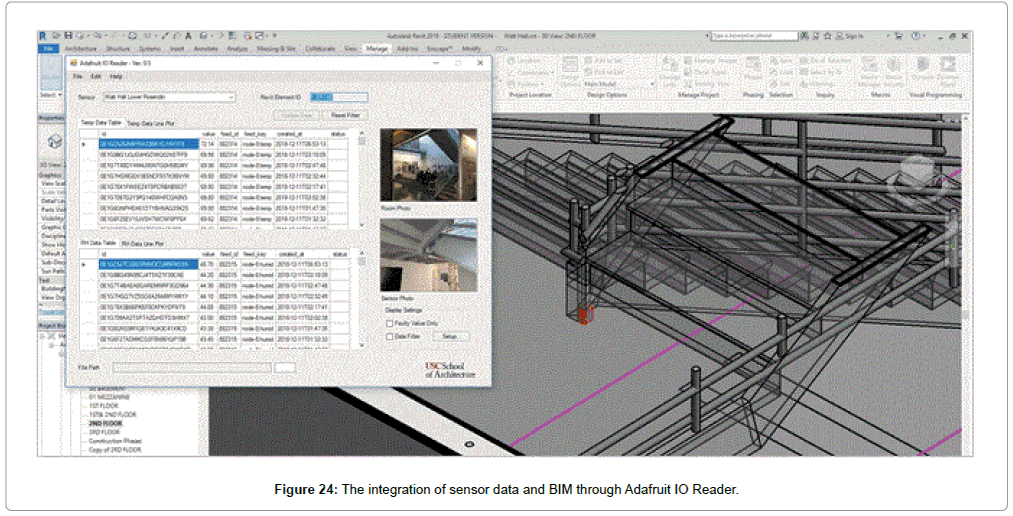
Adafruit IO Reader is a new plugin that provides users access to temperature and humidity data and visualization of fault detection in Revit by interfacing with real-time IoT sensor data feeds stored on an Adafruit IO server. By putting together information from different sources, the tool works as a “bridge” between sensors and data feeds on the cloud, navigating users to sensor models in Revit while loading data feeds to the main interface from the server (Figure 23 and 24).
Adafruit IO Reader is composed of nine main features separated into three categories as previously mentioned. These features are examined with the case study of Watt Hall, and most of the features performed satisfactorily by always producing desired outputs, except for some minor issues with the navigation to sensor models. Of particular note is the integration of the data within a building information model. FM personnel can use Revit to check the sensor list, discover the location of the sensors in the digital model and by the room photographs linked to each sensor, and show the data as tables or line plots. Settings can be created to define a “fault.” In the case study, ASHRAE 55 and ISO 7730 were used to set high and low values for temperature and relative humidity. If the room values were outside of these settings, the sensors would be highlighted allowing facilities managers immediate feedback to uncomfortable conditions. A fault is also detected if there is not a value (“nan”) being sent by the sensor.
Limitations
Despite that the nine main features worked properly, there is still plenty of room for improvement for the Adafruit IO Reader. The biggest limitation lies in the installation of IoT sensors and the influence on availability of data feeds. Amongst the five sensors in Watt Hall, only one at Building Science Corner was plugged in, while another four are powered by AA batteries. A possible explanation for doing so is that the wiring between sensors and sockets will reveal the locations of sensors and expose them to the risk of being taken away. Taking advantage of solar energy is ideal in terms of sustainability, but it is impractical in indoor settings without daylighting [33]. Given that AA batteries were used for powering most of the sensors in Watt Hall, the replacement of batteries becomes a serious issue. If the replacement stops, the sensors will eventually out of power and stop collecting data. Another problem derived from the previous one is the limitation of the data feed pruning algorithm. The current pruning algorithm is solely designed for sensor data files generated by ASAIR IoT sensors and retrieved from Adafruit IO servers. In case of processing data files generated by other types of sensor, it is likely that some necessary information may be erroneously pruned, which will lead to data files with disordered formatting. A third limitation is that the sensor management is accessible only through adding Revit Family (RFA) files of sensor model to Watt Hall model and through editing source code. These approaches are far too complicated for users new to Revit and C#, and lacks efficiency when a large amount of sensor models and corresponding information need to be added to or deleted from the model. Adafruit IO Reader currently collects a total of 10 data feeds (both temperature and RH feeds) for five sensors.
Managing sensors and data feeds of this amount is still possible by manual editing of codes, but a brand-new and automated approach for sensor management should be taken into account before Adafruit IO Reader can deal with more sensors.
Future Work
Future work includes addressing existing limitations and expanding the functionalities of Adafruit IO Reader. The main areas of work include improving the speed of the workflow, updating the code, allowing the use of data feeds from other sources, and imbedding the tool in existing facility management platforms. The synergy of features from these platforms and Adafruit IO Reader will provide FM managers with more comprehensive information about facilities and equipment in a building, supporting both quotidian monitoring work and, when necessary, corrective maintenance work (troubleshooting). Another alternative is to instead create the ability to make custom fault ranges in existing software like Dasher 360 to provide the same functionality.
Conclusion
The combination of visualized sensor data and sensor models were evaluated by a case study of Watt Hall, and the result showed that Adafruit IO Reader is able to achieve the integration by navigating users to sensor models, while providing corresponding sensor data information that is open to customized manipulation through various display settings. The findings of the research is of value for FM managers in terms of supporting with visualized user interfaces decision-making processes especially related to HVAC systems and thermal comfort. Adafruit IO Reader could be a prototype for developing more sophisticated products that help the data management in FM, or it could be integrated into currently used FM platforms to better streamline workflows with more exhaustive information during regular management work and troubleshooting work. The specific contributions of this research is that the display of sensor data, definition of “fault” (for comfort-defined by ASHRAE 55 and ISO 7730), and links to the sensors’ locations occur directly within the BIM software.
Acknowledgement
This research did not receive any specific grant from funding agencies in the public, commercial, or not-for-profit sectors.
References
- McGraw-Hill (2019) National BIM Standard-United States. APEC Meeting Document Database. Accessed.
- Hosseini MR, Roelvink R, Papadonikolaki E, Edwards DJ,  Pärn, E (2018)  Integrating BIM into facility management: Typology matrix of information handover requirements. International Journal of Building Pathology and Adaptation 36: 2-14.
- Matarneh ST, Danso-Amoako M, Al-Bizri S, Gaterell M, Matarneh R (2018) Developing an interoperability framework for building information models and facilities management systems. In Creative Construction Conference pp: 1018-1027.
- Liu X, Akinci B (2009) Requirements and evaluation of standards for integration of sensor data with building information models. J Comput Civil Eng pp: 95-104.
- Suprabhas K, Dib HN (2016) Integration of BIM and utility sensor data for facilities management. Comput Civil Eng pp: 26-33.
- Chen J, Bulbul T, Taylor JE, Olgun G (2014) A case study of embedding real-time infrastructure sensor data to BIM. Construction Research Congress 2014Â pp: 269-278.
- Lechner N, Heating C (1991) Lighting: Design Methods for Architects. John Wiley& Sons.
- Kassem M, Kelly G, Dawood N, Serginson M, Lockley S (2015) BIM in facilities management applications: A case study of a large university complex. Built Environment Project and Asset Management 5: 261-277.
- Yang X, Ergan S (2016) Design and evaluation of an integrated visualization platform to support corrective maintenance of HVAC problem–related work orders. J Comput Civil Eng 30: 0401-5041.Â
- Kensek K (2015) BIM guidelines inform facilities management databases: A case study over time. Buildings 5: 899-916.
- Teicholz E (2001) Facility design and management handbook. McGraw Hill Professional pp:1-39.
- Riaz Z, Arslan M, Kiani AK, Azhar S (2014) CoSMoS: A BIM and wireless sensor based integrated solution for worker safety in confined spaces. Automation in Construction 45: 96-106.
- Ozturk Z, Arayici Y, Coates SP (2012) Post occupancy evaluation (POE) in residential buildings utilizing BIM and sensing devices: Salford energy house example. University of Salford Manchester.
- Shiau YC, Chang CT (2012) Establishment of fire control management system in building information modelling environment. In The 1st International Conference on Software Technology.
- Razavi SN, Haas C (2009) A data fusion model for location estimation in construction. In Proc, the International Symposium for Automation and Robotics in Construction. (ISARC) 26: 1-4.
- Lee G, Cho J, Ham S, Lee T, Lee G, et al. (2012) A BIM-and sensor-based tower crane navigation system for blind lifts. Automation in Construction 26: 1-10.
- Dawes N, Kumar KA, Michel S, Aberer K, Lehning M (2008) Sensor metadata management and its application in collaborative environmental research. IEEE pp: 143-150.
- Knies R (2006) SensorMap Delivers Real-Time Data on the Go. Microsoft Research Blog. Accessed.
- Kazado, Daniel, Miroslava Kavgic, Rasit Eskicioglu (2019) Integrating Building Information Modeling (BIM) and sensor technology for facility management. ITcon 24: 440-458.
- Penna, Paola (2019) From Sensors to BIM: Monitoring Comfort Conditions of Social Housing with the KlimaKit Model. International Conference on Cooperative Design, Visualization and Engineering. Springer pp: 108-115.
- Natephraa, Worawan Ali Motamedib (2019) Live data visualization of IoT sensors using Augmented Reality (AR) and BIM. IAARC pp: 632-638.
- Hu, Jia, Maulin Patel (2014) Optimized selection and placement of sensors using Building Information Models (BIM).IES Annual Conference pp: 1-5.
- Kensek K, Kahn W (2014). Integration of Environmental Sensors with BIM. Advancing Towards Net Zero 66: 31-39.Â
- Bonvini M, Sohn MD, Granderson J, Wetter M, Piette MA (2014) Robust on-line fault detection diagnosis for HVAC components based on nonlinear state estimation techniques. Applied Energy 124: 156-166.
- Sallans B, Bruckner D, Russ G (2006) Statistical detection of alarm conditions in building automation systems. IEEE pp. 257-262.
- Liu H, Huang M, Janghorban I, Ghorbannezhad P, Yoo C (2011) Faulty sensor detection, identification and reconstruction of indoor air quality measurements in a subway station. IEEE pp. 323-328.
- Van Every PM (2017) Advanced detection of HVAC faults using unsupervised SVM novelty detection and Gaussian process models. Energy and Buildings 149: 216-224.
- Yang X, Koehl M, Grussenmeyer P (2017) Parametric modelling of as-built beam framed structure in BIM environment. Ads. 42: 651-657.
- Dong Z (2019) Exploring participatory sensing and the Internet of Things to develop data-driven thermal comfort models on the USC Campus.
Citation: Asida SM (2020) A BIM-based Visualization Tool for Facilities Management: Fault Detection Through Integrating Real-Time Sensor Data into BIM. J Archit Eng Tech Res 9: 228. DOI: 10.4172/2168-9717.1000228
Copyright: © 2020 Asida SM. This is an open-access article distributed under the terms of the Creative Commons Attribution License, which permits unrestricted use, distribution, and reproduction in any medium, provided the original author and source are credited.
Select your language of interest to view the total content in your interested language
Share This Article
Recommended Journals
Open Access Journals
Article Tools
Article Usage
- Total views: 3459
- [From(publication date): 0-2020 - Jul 02, 2025]
- Breakdown by view type
- HTML page views: 2587
- PDF downloads: 872

