Research Article Open Access
A Chemometric Strategy for Simultaneous Determination of Cholesterol and Cholestanol in Human Serum Samples
Ali R. Jalalvand*Department of Chemical Engineering, Faculty of Energy, Kermanshah University of Technology, Kermanshah, Iran
- *Corresponding Author:
- Ali R. Jalalvand
Department of Chemical Engineering
Faculty of Energy, Kermanshah University of Technology
Kermanshah, Iran
Tel: +988337267520
Fax: +988337244201
E-mail: ali.jalalvand1984@gmail.com
Received date: July 27, 2016; Accepted date: September 29, 2016; Published date: October 05, 2016
Citation: Ali R. Jalalvand (2016) A Chemometric Strategy for Simultaneous Determination of Cholesterol and Cholestanol in Human Serum Samples. J Anal Bioanal Tech 7: 337. doi: 10.4172/2155-9872.1000337
Copyright: © 2016 Ali R. Jalalvand. This is an open-access article distributed under the terms of the Creative Commons Attribution License, which permits unrestricted use, distribution, and reproduction in any medium, provided the original author and source are credited.
Visit for more related articles at Journal of Analytical & Bioanalytical Techniques
Abstract
In this study, we have developed a novel and efficient method based on spectrophotometry in combination with first-order multivariate calibration for simultaneous quantification of cholesterol (CHL) and cholestanol (CHN) in human serum samples. Several multivariate calibration (MVC) models including partial least squares-1 (PLS- 1), principal component regression (PCR), classical least squares (CLS), orthogonal signal correction-PLS-1, net analyte preprocessing-PLS-1 (NAP/PLS-1), and OSC-CLS were constructed based on first-order spectrophotometric data for simultaneous quantification of CHL and CHN under simulated physiological conditions to select the best algorithm for analyzing real samples. The compositions of the calibration mixtures were selected according to a central composite design (CCD) and validated with an external validation set. The results confirmed the more superiority of PCR to other algorithms. The results of applying PCR for simultaneous quantification of CHL and CHN in human serum samples as real samples were also encouraging. It is expected that the suitable features of the developed method make it potentially advantageous for biosensing, and clinical applications.
Keywords
Cholesterol; Cholestanol; Simultaneous quantification; First-order multivariate calibration; Clinical applications
Introduction
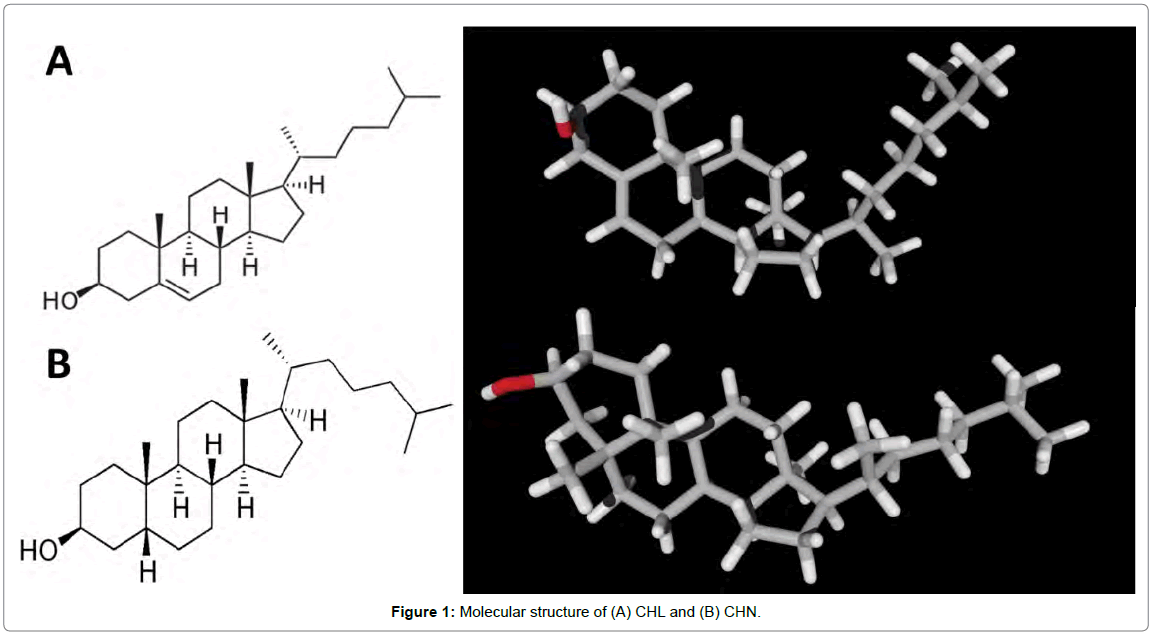
Cholesterol (CHL, Figure 1A) is a vital lipid which acts as an important structural constituent of plasma membranes, and is a precursor of steroid hormones and bile acids [1]. Quantification of CHL is interesting because its level in blood is an important parameter in the diagnosis and prevention of disease. Increased levels of CHL in plasma is associated with atherosclerosis, nephrosis, diabetes mellitus, myxedeme and obstruction jaundice. Decreased levels of CHL may be related to hyperthyroidism, anaemias, maladsorption and wasting syndromes. Normal levels are affected by stress, age, gender, hormonal balance and pregnancy.
Cholestanol (CHN, Figure 1B) is a 27-carbon stanol which could be formed from the biohydrogenation of CHL. The elevation of CHN in the serum is known to be one of the biochemical markers of cerebrotendinous xanthomatosis (CTX) [2,3] and liver and biliary tract diseases [4-7]. The concentration of CHN and the concentration ratio of CHN to CHL are increased in the sera of patients with cerebrotendinous xanthomatosis, obstructive jaundice and cholestatic hepatitis Figure 1.
Simultaneous quantification of CHL and CHN in serum is not easy, because CHL and CHN can be hardly separated and the concentration of CHL in normal serum is 500-1000 times more than CHN. Approaches for the simultaneous determination of CHL and CHN are gas chromatography (GC) [8,9], capillary GC [4,7,10], GC-mass spectrometry (GC-MS) [11], high-performance liquid chromatography (HPLC) with fluorescence detection [12-14], and HPLC with UV detection [15-18]. However, all of these approaches are good, but the treatment applied is time-consuming and expensive. Therefore, to introduce simpler methods, it would be appropriate to use well-established analytical methods in order to facilitate their wide applications in different laboratories. An attractive possibility is coupling multivariate calibration methods to spectrophotometry.
Recently, multivariate calibration has been applied to different types of data for the analysis of complex mixtures [19-23]. Several algorithms have been used for processing these data [24-26]. All these algorithms use the full spectral information and not only a characteristic peak value, and they allow a rapid quantification of mixture components, with no prior separation.
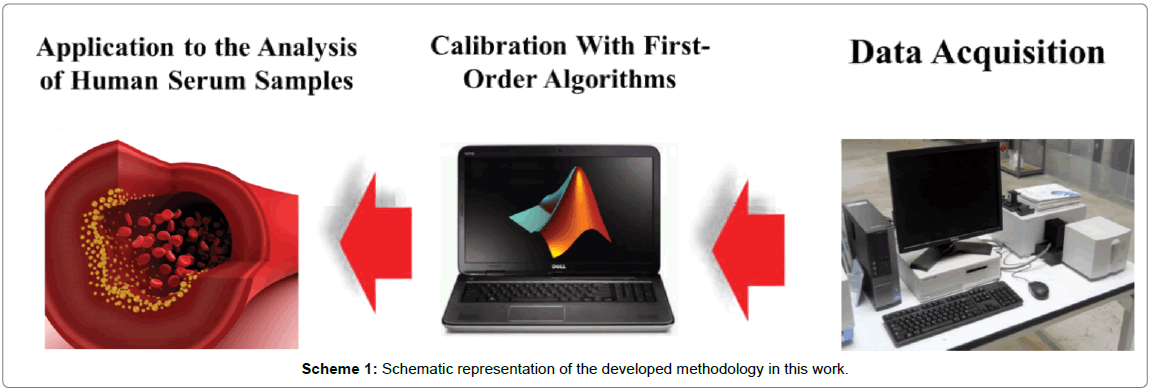
The main objective of this study is to develop a novel, sensitive, selective and simple spectrophotometric method assisted by chemometrics for simultaneous quantification of CHL and CHN in serum samples with no expensive and time-consuming pretreatments. To achieve this goal, we first applied the developed method for simultaneous quantification of CHL and CHN in synthetic samples and after checking its performance we used that for the analysis of human serum samples as real samples (Scheme 1). To the best of our knowledge, this work is the first report on simultaneous spectrophotometric quantification of CHL and CHN with the help of chemometrics.
Experimental and Theoretical Details
Chemicals, solutions, softwares and instrumentation
CHL, CHN, 4-amino antipyrine, cholesterol esterase, cholesterol oxidase, peroxidase and isopropyl alcohol were purchased from Sigma- Aldrich and used as received. Other chemicals were of analytical grade and purchased from other commercial sources. A phosphate buffer solution (PBS, 0.1 mol L-1) of pH 7.4 was prepared using Na2HPO4 and NaH2PO4 (pH adjustment was carried out by NaOH and H3PO4) and was used to adjust the pH of the solutions. Doubly distilled water (DDW) was used throughout.
Stock standard solutions of CHL and CHN were prepared by exact weighing and dissolving their solid powder in isopropyl alcohol with a concentration level of 200 and 100 mg/ml respectively, and were stored at dark in a refrigerator until using time. Working solutions were prepared by appropriate dilution of the stock standard solutions with PBS (0.1 mol L-1, pH 7.4, simulated physiological conditions).
CHL and CHN could be spectrophotometrically determined after hydrolysis and oxidation by cholesterol esterase and cholesterol oxidase, respectively, and formation of an indicator quinoneimine dye in the presence of phenol and peroxidase. The reagent to produce the quinoneimine dye from CHL and CHN could be prepared from cholesterol esterase 0.16 U/ml, cholesterol oxidase 0.11 U/ml, 4-amino antipyrine 0.25 mmol/l, phenol 25 mmol/l, and peroxidase 5.5 U/ml. 0.25 ml of the reagent was added to 2.5 ml of the solution containing CHL or CHN or both of them and was allowed to mix well and incubated at 37°C for 5 minutes. The solution turns to brownish red color and after that the absorbance of the solution was recorded from 400-700 nm.
All the recorded experimental data was smoothed, if necessary, and converted to data matrices by the use of several home-made m-files in MATLAB (Version 7.5, MathWorks, Inc.). All the m-files used in this study were run in MATLAB environment. Spectrophotometric experiments were performed using an Agilent 8453 UV-Vis diodearray spectrophotometer which was controlled by the Agilent UV-Vis ChemStation software and equipped with a 1-cm path length glass cell. Temperature control accessory for Agilent 8453 UV-Vis spectrophotometer was precisely set to (37.0 ± 0.1)°C. A JENWAY-3345 pH-meter equipped with a combined glass electrode was used to pH measurements. All computations were run on a DELL XPS laptop (L502X) with Intel Core i7-2630QM 2.0 GHz, 8 GB of RAM and Windows 8 as its operating system.
Preparation of serum samples
Five human serum samples were provided. To eliminate protein, according to the literature [27], 1.0 ml of human serum sample was poured in a 10.0 ml glass tube and 1.0 ml of 15% (w/v) zinc sulfate solution-acetonitrile (50/40, v/v) was added. The glass tube was vortexed for 20.0 min, maintained at 4.0°C for 15.0 min and centrifuged at 4000.0 rpm for 5.0 min. Then, the supernatant was collected in the same tube and this solution was used for the analysis.
Spectrophotometric procedure
A solution containing CHL or CHN or both of them with a predefined concentration and the reagent was transferred into the glass cell and embedded in cell holder of the spectrophotometer which its temperature was kept constant at 37.0 ± 0.1°C. After 5 min, the spectra were recorded between 400-700 nm.
Model efficiency estimation
For evaluating the performance of the first-order MVC models used in this work, each model was validated for the prediction of the concentrations of CHL and CHN in validation set, regarding root mean square errors of prediction (RMSEP), and relative error of prediction (REP).
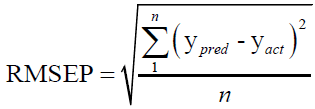 (1)
(1)
 (2)
(2)
where yact and ypred refer to actual and predicted concentrations, respectively, ymean refers to the mean of the actual concentrations and n is the number of samples in validation set.
Selection of the optimum number of latent variables
In multivariate calibration, usually we have two data sets: a calibration set which is used to build the regression model, and a validation set for checking the prediction ability of the developed model after optimization of all calibration parameters. Before calibration, the optimum number of latent variables must be determined in order to avoid overfitting, by the use of the well-known cross-validation method developed by Haaland and Thomas [28]. For estimating the optimum number of latent variables for the first-order algorithms used in this work leave-one-out cross-validation was used. The optimum number of factors could be estimated by calculating F(A)=PRESS (A<A*)/ PRESS (A), where PRESS=Σ (ci,act-ci,pred)2, A is a trial number of factors, A* refers to the minimum PRESS, and ci,act and ci,pred refer to the actual and predicted concentrations ofI the sample left out of the calibration set during cross validation, respectively. Then, the number of factors leading to a probability of less than 75% that F>1 is selected.
Analytical figures of merit (AFOM)
We are going to report the most important analytical figures of merit which could be used for comparison or quality studies. The selectivity involves the part of the total signal which is not lost due to spectral overlapping [29], and could be defined by resorting to net analyte signal (NAS) calculations [29]:
 (3)
(3)
Sensitivity measures the changes in response as a function of analyte concentration [29], and could be calculated by:
 (4)
(4)
The following equation could be used for estimation of the limit of detection (LOD) [30]:

where,  refers to the instrumental noise. The value of
  could be estimated from the standard deviation of NAS of several blanks. A better method for estimating the LOD is to consider type I and II errors, leading to the following definition of LOD [31]:
 (6)
(6)
where S0 refers to the standard error of the blank (the coefficient 3.3 corresponds to 0.05 as α and β probabilities for type I and II errors).
Results and discussion
Calibrations
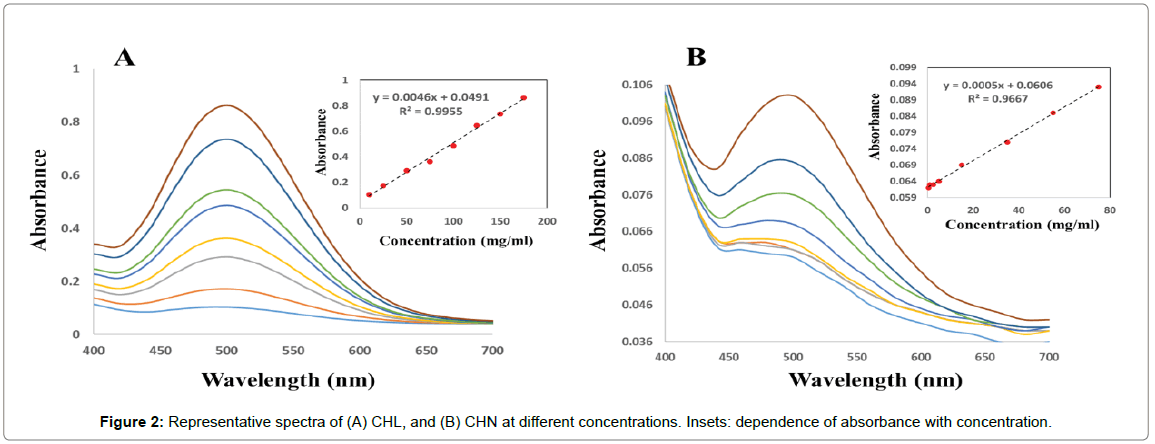
Univariate calibrations: Univariate calibration curves were constructed by several points (Figure 2A and 2B) as absorbance versus analyte concentration in the range 10 to 175 mg/ml, and 0.5 to 75 mg/ ml for CHL and CHN, respectively, and evaluated by linear regression. Both analytes showed linear dependences between absorbance and concentration at different concentrations intervals (insets of Figure 2A and 2B).
Multivariate calibrations
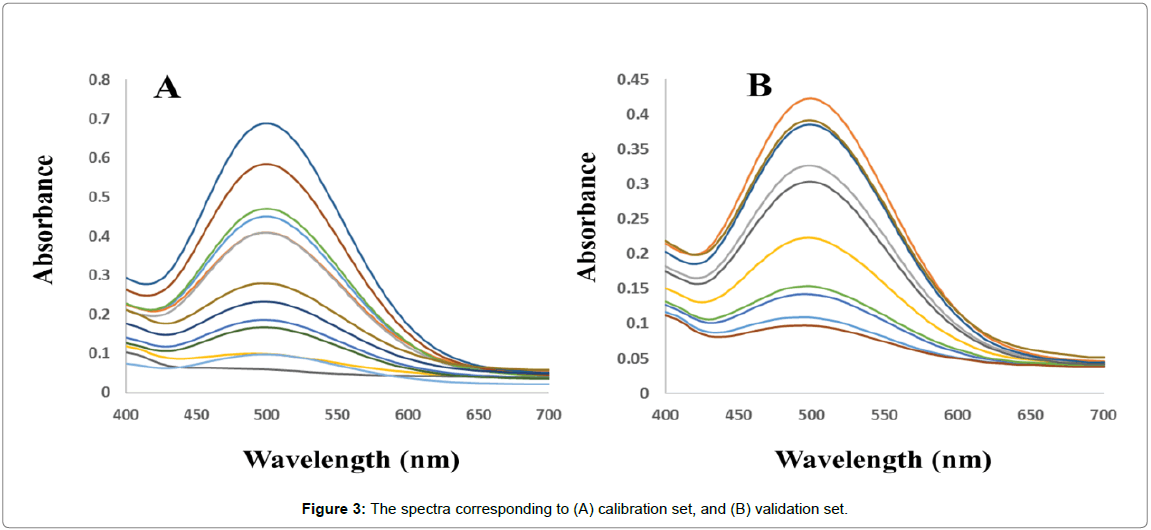
Calibration set: Thirteen calibration mixtures (the compositions of the calibration mixtures were selected according to a central composite design, Table 1) were prepared in the PBS (0.1 mol L-1, pH 7.4) which was spiked with appropriate amounts of analytes of interest considering the linear calibration ranges (previously obtained from univariate calibrations). Finally, the spectra of the solutions were recorded in random order (Figure 3A).
| Calibration Set | Validation Set | ||||
|---|---|---|---|---|---|
| Sample | Cholesterol (mg/ml) | Cholestanol (mg/ml) | Sample | Cholesterol (mg/ml) | Cholestanol (mg/ml) |
| C1 | 25 | 38.75 | V1 | 12.5 | 3.5 |
| C2 | 175 | 75 | V2 | 135 | 12 |
| C3 | 175 | 2.5 | V3 | 67 | 66 |
| C4 | 92.5 | 38.75 | V4 | 55 | 41 |
| C5 | 92.5 | 38.75 | V5 | 21 | 22 |
| C6 | 92.5 | 38.75 | V6 | 24 | 19 |
| C7 | 10 | 2.5 | V7 | 90 | 7.5 |
| C8 | 40 | 15 | V8 | 164 | 74 |
| C9 | 130 | 30 | V9 | 170 | 10 |
| C10 | 10 | 75 | V10 | 33 | 56 |
| C11 | 92.5 | 35 | |||
| C12 | 145 | 15 | |||
| C14 | 92.5 | 55 | |||
Table 1: Concentration data of calibration set (C1-C13) and validation set (V1-V10).
External validation set: An external validation set of ten binary mixtures (Table 1) was prepared in PBS (0.1 mol L-1, pH 7.4) with random concentrations of analytes of interest in the same concentration range used for calibration. The spectra of the solutions were recorded in random order (Figure 3B).
Comparison of the performance of the first-order algorithms used for simultaneous quantification of CHL and CHN in synthetic samples
PLS-1, PCR, CLS, OSC-CLS, OSC-PLS-1, and NAP-PLS-1 algorithms were separately run on calibration, and validation data sets. According to the results presented in Table 2, with satisfactory values for RMSEP and REP for CHL and CHN it is apparent that the PCR algorithm has found the best results. These results confirmed that the RMSEP and REP values found by PCR were apparently smaller than those obtained by the other algorithms.
| CHL (mg/ml) | ||||||
|---|---|---|---|---|---|---|
| Sample | PLS-1 | PCR | CLS | OSC-CLS | OSC-PLS-1 | NAP-PLS-1 |
| 1 | 11.89 | 12.43 | 11.67 | 12.01 | 12.88 | 12.94 |
| 2 | 136.81 | 135.3 | 137.23 | 136.23 | 136.1 | 134.33 |
| 3 | 68.98 | 66.81 | 67.43 | 68.43 | 68.02 | 68.24 |
| 4 | 56.38 | 55.03 | 56.65 | 56.04 | 55.66 | 55.98 |
| 5 | 19.99 | 21.08 | 19.88 | 21.99 | 21.73 | 20.06 |
| 6 | 25.22 | 23.88 | 25.67 | 25.03 | 24.86 | 24.98 |
| 7 | 91.77 | 89.94 | 91.98 | 91.51 | 91.21 | 88.86 |
| 8 | 166.76 | 164.2 | 167.09 | 166.23 | 165.66 | 166.10 |
| 9 | 172.71 | 170.11 | 173.06 | 172.32 | 171.87 | 172.05 |
| 10 | 34.04 | 32.84 | 34.32 | 33.96 | 33.65 | 33.86 |
| RMSEPa | 1.76 | 0.15 | 1.92 | 1.43 | 1.10 | 1.25 |
| REPb | 2.28 | 0.19 | 2.49 | 1.85 | 1.43 | 1.62 |
| LVc | (2,3) | (2,2) | (3,3) | (2,2) | (2,2) | (2,2) |
| CHN (mg/ml) | ||||||
| Sample | PLS-1 | PCR | CLS | OSC-CLS | OSC-PLS-1 | NAP-PLS-1 |
| 1 | 3.60 | 3.51 | 3.60 | 3.58 | 3.53 | 3.45 |
| 2 | 12.12 | 12.01 | 12.16 | 12.13 | 12.06 | 12.09 |
| 3 | 66.31 | 65.98 | 66.35 | 66.22 | 66.09 | 66.18 |
| 4 | 41.28 | 41.02 | 40.65 | 41.21 | 40.91 | 41.16 |
| 5 | 22.31 | 21.98 | 21.63 | 22.22 | 22.17 | 21.81 |
| 6 | 18.69 | 19.02 | 19.39 | 19.25 | 19.13 | 19.19 |
| 7 | 7.71 | 7.52 | 7.78 | 7.68 | 7.57 | 7.61 |
| 8 | 74.33 | 74.10 | 74.44 | 74.28 | 74.17 | 74.23 |
| 9 | 10.11 | 9.98 | 10.14 | 10.18 | 10.08 | 10.11 |
| 10 | 56.35 | 56.11 | 56.39 | 56.39 | 56.28 | 55.70 |
| RMSEPa | 0.26 | 0.04 | 0.31 | 0.22 | 0.13 | 0.17 |
| REPb | 0.83 | 0.15 | 1.02 | 0.73 | 0.43 | 0.56 |
| LVc | (3,3) | (2,2) | (3,2) | (2,2) | (2,2) | (2,2) |
a-Root Mean Square Error of Prediction in mg/ml.
b-Relative Error of Prediction in %.
c-No. of Latent Variables (CHL, CHN)
Table 2: Predicted concentrations of CHL and CHN in validation set by first-order algorithms used in this study.
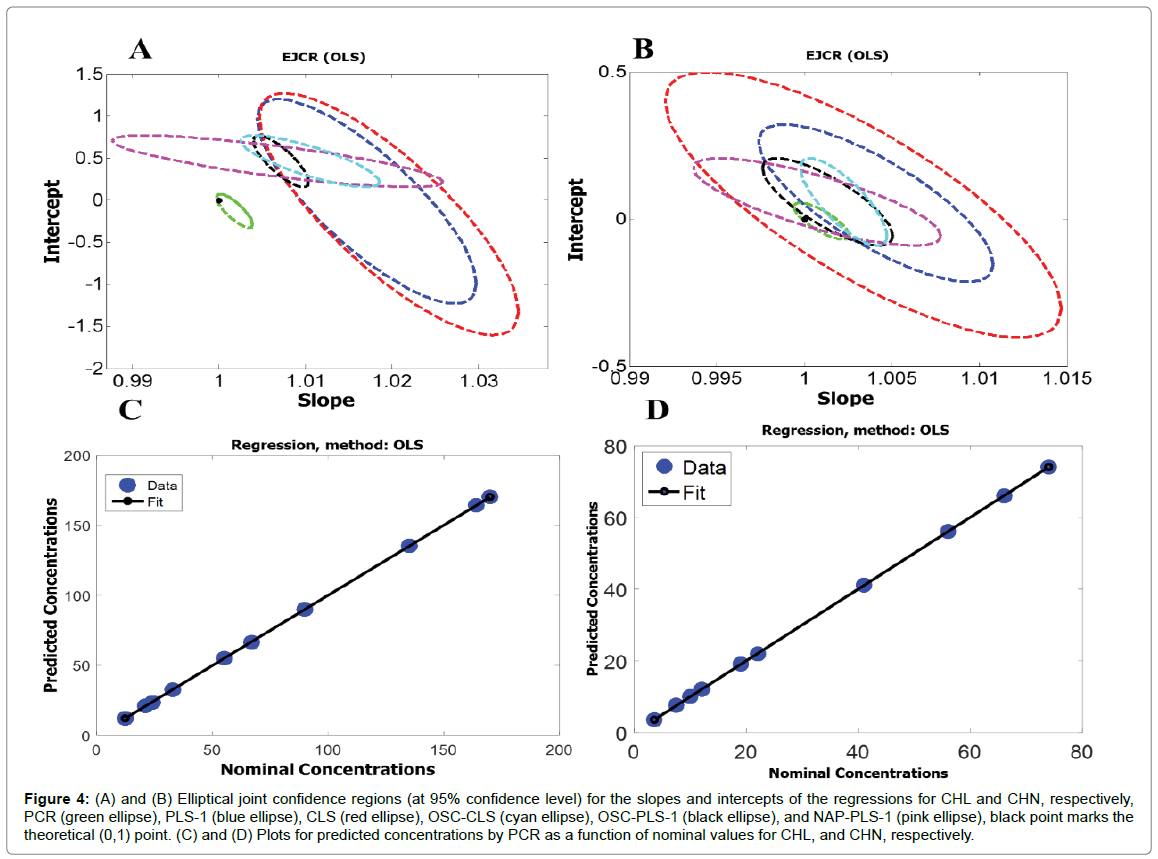
For further investigation of the accuracy of the first-order algorithms used in this study, the predicted concentrations of the validation set (Table 2) were regressed on the nominal ones. For this purpose, an ordinary least squares (OLS) analysis of predicted concentrations versus nominal ones was applied [32]. The calculated intercept and slope were compared with their theoretically expected values (intercept = 0, slope = 1), based on the elliptical joint confidence region (EJCR) test. If the ellipses contain the values 0 and 1 for intercept and slope (ideal point), respectively, confirming the predicted and nominal values do not show significant difference at the level of 95% confidence and the elliptic size shows the precision, smaller size refers to higher precision [33]. Figure 4A shows the ellipses of the EJCR analyses related to the ability of the first-order algorithms used in this study toward predicting concentrations of CHL. As can be seen, the ellipses related to PLS-1, CLS, OSC-CLS, OSC-PLS-1, and NAP-PLS-1 don’t contain the ideal point which confirms that these algorithms don’t have enough accuracy for predicting concentrations of CHL while the ellipse of PCR contains the ideal point which confirms good accuracy of PCR for predicting concentrations of CHL. Moreover, the smaller ellipse for PCR confirms higher precision of PCR relative to the other algorithms. Figure 4B shows the ellipses of the EJCR analyses related to the performance of the first-order algorithms toward predicting concentrations of CHN. If the ellipses are analyzed, it is notable that while the ellipses for CLS, PCR, and NAP-PLS-1 contain the ideal point, indicating acceptable accuracy of these algorithms, the ideal point falls on the OSC-PLS-1 ellipse, confirming slightly poorer prediction accuracy for OSC-PLS-1. But the ellipses related to PLS-1 and OSC-CLS don’t contain the ideal point which doesn’t confirm accurate quantification of CHN by these algorithms. The statistical results shown in Table 2 do also confirm the above conclusions. Figure 4C and 4D shows the plots for predicted concentrations by PCR as a function of nominal values for CHL and CHN, and as can be seen, the predicted concentrations by PCR for CHL and CHN are in good agreement with the nominal values (Figure 4).
Figure 4: (A) and (B) Elliptical joint confidence regions (at 95% confidence level) for the slopes and intercepts of the regressions for CHL and CHN, respectively, PCR (green ellipse), PLS-1 (blue ellipse), CLS (red ellipse), OSC-CLS (cyan ellipse), OSC-PLS-1 (black ellipse), and NAP-PLS-1 (pink ellipse), black point marks the theoretical (0,1) point. (C) and (D) Plots for predicted concentrations by PCR as a function of nominal values for CHL, and CHN, respectively.
Analytical figures of merit (AFOM) for PCR including sensitivity (SEN), analytical sensitivity (γ), selectivity (SEL), and limit of detection (LOD) are shown in Table 3. From Table 3, all parameters are seen to be good, indicating that the PCR offers a sensitive and selective approach for simultaneous quantification of CHL and CHN.
| Analytes | ||
|---|---|---|
| AFOM | CHL | CHN |
| SENa/AU (mg/ml)-1 | 0.0031 | 0.0078 |
| SELb | 0.035 | 0.097 |
| (γ)c/ mg/ml | 0.15 | 0.11 |
| LODd/ mg/ml | 4.3 | 0.22 |
a-SEL, sensitivity
b-SEL, selectivity
c-γ, analytical sensitivity (represents the minimum concentration difference which can be measured)
d-LOD, limit of detection
Table 3: Analytical figures of merit for PCR validation samples.
Interference study
The effects of common interfering substances were examined prior to the application of the proposed method for the analysis of real samples. The anti-interference ability of the proposed method was evaluated by the addition of various interferences into PBS (0.1 mol L-1, pH 7.4) containing CHL (100 mg/ml), CHN (50 mg/ml) and the reagent. It was found that 50-folds Ca2+, Al3+, SO32-, CO32-,SO42, Na+, K+ and HSO4-; 100-folds glucose; 50-folds dopamine, uric acid and ascorbic acid did not give any significant interference on the response. Thus, this study confirms that the developed method can tolerate a high concentration of interfering substances and, therefore, could be used as a selective method for simultaneous determination of CHL and CHN in the presence of common interfering substances.
Simultaneous quantification of CHL and CHN by PCR in human serum samples
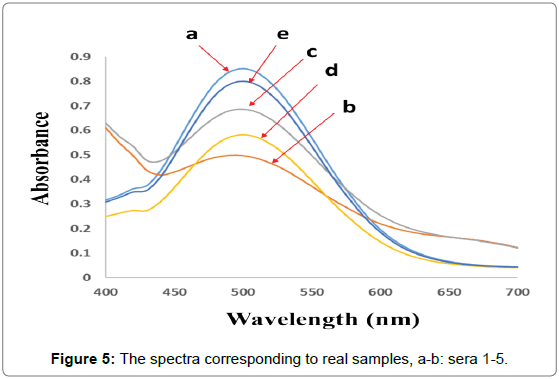
For checking the ability of the proposed method for simultaneous quantification of CHL and CHN in real samples, the PCR algorithm was selected for the analysis of five human serum samples provided by five volunteers. To check the feasibility of the proposed method, simultaneous quantification of CHL and CHN was performed in partially diluted human serum samples. Serum samples were partially diluted with PBS (0.1 mol L-1, pH 7.4) and the reagent was added and kept at 37.0 ± 0.1°C for 5 min then, the spectra were recorded between 400-700 nm (Figure 5). Final concentration of each analyte was obtained by multiplying the detected value by the appropriate dilution factor. The results of the analysis of human serum samples are reported in Table 4.
| Sample | Sex | CHL | CHN | CHL/CHN |
|---|---|---|---|---|
| (mg/ml) | (mg/ml) | Ratio | ||
| Serum 1 | M | 188 | 14.1 | 13.3 |
| Serum 2 | M | 190 | 4.7 | 40.4 |
| Serum 3 | M | 209 | 9.7 | 21.5 |
| Serum 4 | M | 123 | 3.1 | 39.7 |
| Serum 5 | F | 176 | 2.4 | 73.3 |
Table 4: Results of analysis of human serum samples by PCR.
Conclusion
In the present study, combination of spectrophotometry with chemometrics led us to introduce an efficient analytical method for simultaneous quantification of CHL and CHN in human serum samples. A strong overlapping was observed for the simultaneous quantification of these compounds and it was successfully resolved by using first-order multivariate calibration as an efficient chemometric strategy. This is the first example of the power of chemometrics for processing spectrophotometric data for the simultaneous quantification of CHL and CHN in human serum samples. Firstly, the MVC model was built with several algorithms and validated with an external validation set which led us to choose the PCR as the best algorithm for the simultaneous quantification of CHL and CHN. Finally, the application of the developed method to simultaneous quantification of CHL and CHN in human serum samples showed satisfactory results. This study allows us to propose the present method as a promissory, cheap and accessible alternative for clinical quantification of CHL and CHN in human serum samples.
Acknowledgements
Financial supports of this project is by Research Council of Kermanshah University of Technology are gratefully acknowledged.
References
- Hojo K, Hakamata H, Ito A, Kotani A, Furukawa C, et al. (2007) Electrochemical oxidation of cholesterol. Journal of Chromatogr A 1166: 135-141.
- Menkes JH, Schimshock JR, Swanson PD (1968) Cerebrotendinous Xanthomatosis-The Storage of Cholestanol Within the Nervous System. Arch Neurol 19: 47-53.
- Salen G (1971) Cholestanol Deposition in Cerebrotendinous Xanthomatosis: A Possible Mechanism. Ann Intern Med 75: 843-851.
- Koopman J, van der Molen JC, Wolthers BG, de Jager AEJ, Waterreus RJ, et al. (1984) Cerebrotendinous xanthomatosis: A review of biochemical findings of the patient population in the Netherlands. Clin Chim Acta 137 305-315
- Nikkilae K, Miettinen TA, Scand S (1988) Hyperlipidemia in chronic cholestatic liver disease. J Gastroenterol 23: 967-972.
- Nikkilae K (1992) New immunoseparation-based homogeneous assay for HDL-cholesterol compared with three homogeneous and two heterogeneous methods for HDL-cholesterol. Ann Med 24: 129-136.
- Nikkilae K, Hockerstedt K, Miettinen TA (1992) A Novel Fibrosis Index Comprising a Non-Cholesterol Sterol Accurately Predicts HCV-Related Liver Cirrhosis. Hepatology 15: 863-870.
- Salen G, Grundy SM (1973) The Metabolism of Cholestanol, Cholesterol, and Bile Acids in Cerebrotendinous Xanthomatosis. J Clin Invest 52: 2822-2835.
- Ishikawa TT, Brazier JB, Stewart LE, Fallot RW, Glueck CJ (1976) Molecular genetics of cerebrotendinous xanthomatosis in Jews of North African origin. J Lab Clin Med 87: 345-353.
- Salen G, Berginer V, Shore V, Horak I, Horak E, et al. (1987) New Engl J Med 316: 1229-1233.
- Seyama Y, Ichikawa K, Yamakawa T (1976) Quantative determination of choestrol in plasma with fragmatography; Biochemical diagnosis of cerebrotendinous xanthomatosis. J Biochem 80: 223-228.
- Matsuoka C, Nohta H, Kuroda N, Ohkura Y (1985) Determination of serum cholestanol by semi-micro high-performance liquid chromatography with electrochemical detection. J Chromatogr 341: 432-436.
- Iwata T, Yamaguchi M, Nakamura M (1987) Analysis of acylglycerols by HPLC with post-column derivatisation. IV. Simultaneous determination of mono-, di- and triacylglycerols. J Chromatogr 421: 427-432
- Tsuruta Y, Teranishi T, Date Y, Kohashi K (1993) Simultaneous determination of cholesterol and cholestanol in human serum by high-performance liquid chromatography using 3-(5,6-methylenedioxy-2-phthalimidyl)benzoyl azide as precolumn fluorescent labelling reagent. J Chromatogr 617: 213-220.
- Kasama T, Byun DS, Seyama Y (1987) Quantative analysis if serum by high performance liquid chromatography. Application to the biochemicsl diagnosis of cerebrotendinous xanthomatosis. J Chromatogr 400: 241-246.
- Kim KS, Kano K, Kasama T, Ishii Y, Yamashita H, et al. (1991) Cholestanol Induces Apoptosis of Corneal Endothelial and Lens Epithelial Cells. Biochim Biophys Acta 1085: 343-349.
- Kuriyama M, Fujiyama J, Kasama T, Osame M (1991) High levels of plant sterols and cholesterol precursors in cerebrotendinous xanthomatosis. J Lipid Res 32: 223-229.
- Hideka H, Nakamura T, Aosi T, Kojima H, Nakajima Y (1990) Increased plasma plant sterol levels in heterozygotes with sitosterolemia and xanthomatosis. J Lipid Res 31: 881-888.
- Gholivand MB, Jalalvand AR, Goicoechea HC, Skov Talanta TH (2014) Chemometrics-assisted simultaneous voltammetric determination of ascorbic acid, uric acid, dopamine and nitrite: Application of non-bilinear voltammetric data for exploiting first-order advantage 119: 553-563.
- Gholivand MB, Jalalvand AR, Goicoechea HC, Gargallo R, Skov Th, et al. (2015) Combination of electrochemistry with chemometrics to introduce an efficient analytical method for simultaneous quantification of five opium alkaloids in complex matrices. Talanta 131: 26-37.
- Jalalvand AR, Gholivand MB, Goicoechea HC, Skov Th (2015) Generation of non-multilinear three-way voltammetric arrays by an electrochemically oxidized glassy carbon electrode as an efficient electronic device to achieving second-order advantage: challenges, and tailored applications. Talanta 134: 607-618.
- Jalalvand AR, Gholivand MB, Goicoechea HC, Rinnan Å, Skov Th (2015) Advanced and tailored applications of an efficient electrochemical approach assisted by AsLSSR–COW–rPLS and finding ways to cope with challenges arising from the nature of voltammetric data. Chemom Intell Lab Syst 146: 437-446.
- Jalalvand AR, Gholivand MB, Goicoechea HC (2015) A novel modified electrode based on terbium oxide and carbon nanotubes for the simultaneous determination of methyldopa and paracetamol. Chemom Intell Lab Syst 148: 60-71.
- Martens H, Naes T (1989) Multivariate Calibration. Wiley, Chichester.
- Martens H, Martens M (2000) Multivariate Analysis of Quality-An Introduction. Wiley, Chichester.
- Wold S, Sjostrom M, L Eriksson (2001) PLS-regression: a basic tool of chemometrics. Chemom Intell Lab Syst 58: 109-130.
- Suh JH, Lee YY, Lee HJ, Kang M, Hur Y, et al. (2013) Dispersive liquid-liquid microextraction based on solidification of floating organic droplets followed by high performance liquid chromatography for the determination of duloxetine in human plasma. J Pharm Biomed Anal 75: 214-219.
- DM Haaland, EV (1988) Partial least-squares methods for spectral analyses. 1. Relation to other quantitative calibration methods and the extraction of qualitative information. Thomas Anal Chem 60: 1193-1202.
- Lorber A, Faber NK, Kowalski BR (1997) Determination of figures of merit for near-infrared and raman spectrometry by net analyte signal analysis for a 4-component solid dosage system. Anal Chem 69: 1620-1626.
- Booksh KS, Kowalski BR (1994) Theory of Analytical Chemistry. Anal Chem 66: 782A-791A.
- Boque R, Larrechi MS, Rius FX (1999) Multivariate detection limits with fixed probabilities of error Chemometrics and Intelligent Laboratory Systems. Chemom Intell Lab Syst 45: 397-408.
- Gonzalez AG, Herrador MA, Asuero AG (1999) Intra-laboratory testing of method accuracy from recovery assays. Talanta 48: 729-736.
- Arancibia JA, Escandar GM (2003) HPLC-DAD data coupled with second-order calibration method applied to food analysis´╝?Simultaneous determination of six benzoylurea insecticides in various fruit samples by selecting time region of chromatogram. Talanta 60: 1113-1121.
Relevant Topics
Recommended Journals
Article Tools
Article Usage
- Total views: 11789
- [From(publication date):
October-2016 - Jul 12, 2025] - Breakdown by view type
- HTML page views : 10852
- PDF downloads : 937

