A Comparative Study on Pelagic Primary Productivity in the Coastal Areas of Eritrean Red Sea
Received: 27-Jan-2018 / Accepted Date: 19-Feb-2018 / Published Date: 23-Feb-2018 DOI: 10.4172/2155-9910.1000247
Abstract
Primary Productivity is the process by which inorganic forms of carbon are synthesized by living organisms into simple organic compounds. Most carbon on Earth is in inorganic oxidized forms such as carbon dioxide (CO2), bicarbonate (HCO3-), and carbonate (CO3). Inorganic carbon must be chemically reduced to form the organic molecules which are the building blocks of life and the mechanism by which energy is stored in living organisms. Eritrea’s coastal and marine ecosystems are characterized by rich and diverse coral reefs, isolated mangrove forests, sea-grass beds, bays, beaches and pristine unpolluted waters that are at the critical juncture between development and conservation. These ecosystems represent a physical resource base for the potentially rich and unexploited marine fisheries. This study is basically aimed at the measurement of primary productivity in relation to fisheries. The study results will also high light the plankton assemblage of a coastal environment and this study will also examine the productivity of the coastal environment.
Keywords: Primary production; Phytoplankton; Winkler method; Massawa coast
Introduction
As a brief review, it is recognized that some organisms are capable of synthesizing organic molecules from inorganic precursors, and of storing biochemical energy in the process [1,2]. These are called Autotrophs; meaning “self-feeding organisms able to manufacture complex organic molecules from simple inorganic compounds such as water, CO2 and nutrients”; include plants, some protests, and some bacteria. Photoautotrophs use light energy to fix carbon, whereas Chemoautotrophs use the energy released through the oxidation of reduced inorganic substrates to fix carbon into organic compounds [1]. The process by which they do this usually is photosynthesis, and as its name implies, photosynthesis requires light [2]. Photosynthesis is the process by which plants and other autotrophs generate carbohydrates and oxygen from carbon dioxide, water, and light energy in chloroplasts.
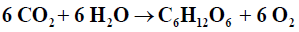
Blankenship [3] defined photosynthesis as: “a process in which light energy is captured and stored by an organism, and the stored energy is used to drive cellular processes” Oxygenic photosynthesis may be expressed as an oxidation-reduction reaction in the form followed by Falkowski [4]

The terms Production and Productivity are often used interchangeably and there is no generally accepted definition of Primary Production [5]. Photosynthesis results in Primary Productivity. Falkowski [4] define Primary Productivity as a time dependent process which is a rate with dimensions of mass per unit Time; whereas primary production is defined as a quantity with dimensions of mass. In Contrast, Underwood [5] defined primary production as a rate of assimilation of inorganic carbon into organic matter by autotrophs. In terms of number of species, phylogenetic diversity and contribution to total global Primary Production, the unicellular phytoplankton dominate Primary Production in the ocean [6].
Almost all oxygenic photosynthetic primary producers in the ocean are either cyanobacteria (Cyanophyta) or eukaryotic algae. The eukaryotic algae are a diverse polyphyletic group, including both unicellular and multi-cellular organisms. Phytoplankton, small floating life of the sea has little power of locomotion and simply drift where ocean current take it, are universally distributed in all adequately lighted bodies of water [7]. Phytoplankton are most important primary producers of the sea, their productivity, depends mostly on adequate supply of light and nutrients. However, phytoplanktons are non-evenly distributed both at space and time. The spatial and temporal abundance and composition is affected by biological, hydrographical and ecological processes [8]. Phytoplankton can be used as an indicator organism for the health of a particular body of water. The total fish biomass is a function of the available phytoplankton biomass and often areas, which are highly fisheries productive areas, are also high in Primary Production [9]. Whether one measures the rate at which photosynthesis occurs, or the rate at which the individual plant increases in mass, one is concerned with Primary Production [2].
There are some ecosystems that depend on primary production from other ecosystems. Many streams have few primary producers and are dependent on the leaves from surrounding forests as a source of food that supports the stream food chain. The oceans below the photic zone are a vast space, largely dependent on food from photosynthetic Primary Producers living in the sunlight waters above. In the marine environment climate and weather patterns affect the rate of photosynthesis, and therefore, the primary production in that area of the sea [1]. In the warm waters of the tropics, the seasons are less distinct and the weather is relatively constant throughout the year. This means that the thermocline is never broken up by winter storms and high winds. As a consequence there is a phytoplankton presence throughout the year, which is only limited by the abundance of nutrients. Light is variable on a number of spatial and temporal scales. Low latitudes receive more solar radiation than high latitudes and have less variation in solar radiation over the course of one year [10]. The angle of the sun above the horizon affects how much light is reflected off the surface of the ocean. Reflection of cloud cover also significantly reduces the input of solar radiation into the ocean. Conversely, Net Primary Productivity may be inhibited by too much light, which can lead to photo inhibition or conditions conducive to photo-respiration [11]. The only pigment common to all phytoplankton [12], chlorophyll a has been widely utilized to estimate Primary Productivity [12-17].
Chlorophyll fluorescence has been used as tool to determine the distribution of phytoplankton biomass in the ocean since the development of flow-through flourmeters [18,19]. Quantitative studies of phytoplankton biomass have been used by several authors as indicators of Primary Productivity. Winkler [20] devised a method of measuring the amount of oxygen dissolved in water by using dark and light bottles. Another approach was developed using radioactive carbon (C14) by Steeman Nielessen [21]. There are, however, few quantitative data concerning the Primary Production which ultimately sustains these fisheries [22]. Since chlorophyll a is essential for photosynthesis and is easily measured, numerous attempts have been made to relate its concentration to the rate of photosynthesis of phytoplankton populations [23].
The Red sea is bordered by Djibouti, Eritrea, Sudan, Egypt, Israel, Jordan, Saudi Arabia, and Yemen. It has surface area of 458,620 km2, of which 2.33% is protected and includes 3.8% of the world’s coral reefs (Sea around Us, 2007). It is characterized by dense, salty water formed by net evaporation with rates up to1.4-2.0 yr-1[24] and deep convention in the Northern sector resulting in the formation of a deep water mass flowing out in the Gulf of Aden underneath a layer of less saline inflowing water [25]. The phytoplankton, zooplankton and fish fauna bear more similarity to the Indian Ocean biota than to the Mediterranean Sea. Its complex reefs, together with extensive mangroves, sea grass and macro algae beds form highly productive habitats for unique species assemblages. Endemism is very high, especially among reef fishes and invertebrates, the latter including a number of dinoflagellates and euphaausiids [26,27].
Materials and Methods
Study Stations
The Red sea is unique. It is the only deep ocean that remains warm to great depths, yet its surface water remains pleasantly cool. While biologically part of the great indo-pacific region, it has its own character. Many of its species are endemic that is they are found nowhere else. During summer, air temperatures in the region typically exceed 40°C, warming Red sea surface waters to 30°C. Strong evaporation creates high surface salinity which ranges from 42% in the north to 37% in the south and 46% in the Arabian Gulf. The study Stations have been selected in three major areas in Massawa coast – Hirgigo Bay, Girar Bay, and Gergusum Beach based on their characteristic features.
Station1: Hirgigo bay (15°36’N, 39°28’E) (near the out let of the power plant). It is few hundred meters in the southern side of the Massawa coast. It only has power plant activities near to it. Vicinity of sewage discharge is also observed in this Station.
Station 2: Girar bay (15°40’N,39°28’E), a division from the major water system through which sea water flows to the Massawa salt processing plant (Salina Salt Factory) and is enclosed with low water circulation.
Station 3: Gergusum beach (15°39’N, 39°28’E), it is characterized by open water, high wave action, recreational swimming area; it is sandy beach and turbid water due to wave action and human activities (Figure1 and Table 1).

Figure 1: Study Stations.
| Equipment's | Bottles | Chemicals | Reagents | Accessories |
|---|---|---|---|---|
| Light and dark bottle | Meyer bottle | standard thiosulfate (S2O3) | Mn(II) chloride | Anchor |
| Line | Volumetric flask | Iodine ion (I-) to I2 | Sodium iodide and sodium hydroxide | Aluminum foil |
| Thermometer | Beakers | Starch | Sulfuric acid | Buoy |
| Refractometer | Volumetric | Mn(II) | Glass eye dropper dispensers bottle for starch indicator | |
| pH meter | Erlenmeyer flask | 10 mL reservoir-fill burette for thiosulfate titrations | ||
| Secchi disk | Burette |
Table 1: Materials.
Sampling technique
The surface Sea water was collected from the three Stations on Fortnight basis from February 2015 to April 2015. The light and dark bottles were filled with water taken from 2 m depth. To avoid intrusion of atmospheric oxygen, large turbulence was prevented by filling slowly and gently. This water contains planktonic organisms of the marine ecosystem. The light bottle represents areas which have photosynthesis and respiration activities, and the dark bottle represent areas with respiration only. The bottles are closed with stoppers to prevent any exchange of gas or organisms with the surrounding water, and then they are suspended at the particular depth.
Exposure and fixation
The bottles are suspended for two hours at the same depth from which the water was originally taken. Inside the bottles CO2 is being consumed, and O2 is being produced, and it was measured the change over time in either one of these gases. Before suspending the bottles, the initial O2 concentration was determined and expressed as mg of O2 per Liter of water (mg/L). Then, the final value had been measured in both the light and dark bottles after a timed duration of incubation. After the exposure time (2 hours) had been done and the bottles were taken out from the depth, and they were fixed using 2ml of manganese reagent and 2ml of alkaline iodide solution to avoid error. The determination was performed after one hour to cope with the general or normal Procedure, 3 or 2 hours later but not later than ten hours after fixation.
Titration
First 2 ml of 50% sulfuric acid was added to the sample in the Winkler’s bottle. Then the bottles were closed and shaken until the precipitate is dissolve. After that the sample was filled into an Erlenmeyer flask completely without any remaining precipitate. The end point was determined by using few drops of starch as a visual indicator solution, and it shows changes the color to blue. Then titration had been done with thiosulphate solution and at the end point of titration color was changed from blue to colorless. The volume of thiosulphate solution consumed in the titration was recorded in milliliter.
Calculation
The gross production (PG); Net production (PN) and respiration (R) was determined with in the following equation (Alemu and Gunther, 1990).
Oxygen in mlo2 L-1 to mg o2 L-1
MlO2L-1= B.T.112/ V-2
Where B= volume of thiosulfate used for titration
V= content of O2 sample in the sample in the bottle
T= factor of thiosulfate solution
T=10/A
Where: A is the volume of thiosulfate used thiosulfate standard
To change mlO2 to mgO2 L-1
MgO2L-1=mlO2L-1/ 0.7005
PN= (QL-Qc) a. b. c mg cm-3d-1/PQ
PG= (QL-Qb) a. b. c mg cm-3d-1/PQ-3d-1/RQ
R = (Qi-Qd) a. b. c mg cm
Where: PN= net primary production
PG= Gross primary production
R = Respiration
Qi= initial O2 content
QL=O2 content in the light bottles at the end of exposition time
Qd=Oxygen content in the dark bottles at the end of the exposition time
a = conversion factor from mg O2 to mg C (1mg O2=0.275 mgC)
b =conversion factor from 1L to 1m3(thus b=103Lm-3)
c =conversion factor to the time from the sun rise to sun set and
C=2d-1
PQ= photosynthetic quotient +O2/-CO2=1.25
RQ= Respiratory quotient = CO2/-O2=0.8
Data analysis
Chi-square test
Measurement of environmental parameters
Turbidity
Turbidity of water was determined using Secchi disk. The average depth at which the disk appears and disappears is measured using the following formula:
Transparency depth=depth of disappearance + depth of reappearance/2
Salinity
Salinity of the sea water was determined using Refractometer. Water sample was taken from the surface using pipet.
pH
Sample of sea water is brought from the desired depth and measured with a digital pH meter in laboratory.
Nutrients
Sample for nutrients analysis was taken from each Station at depth of 2m by water sampler bottle. Nutrient analysis was done for the three essential nutrients namely nitrogen in the form of nitrate, sulphur in the form Sulphide and ammonia using test kit (Sinous Test Kit).
Result
Gross primary production
The highest value of Gross Primary Production was recorded in Station 1 during February and lowest values were observed in Station two and three during March (Figure 2). Highest value of average Gross Primary Production was observed in Station 1 having 0.82mg/l and medium and lowest value were recorded in Station 2 and Station three having 0.32 mg/l and 0.18 mg/l respectively (Table 2).

Figure 2: Gross Primary Production (mg l d-1).
| Samples | Station 1 | Station 2 | Station 3 |
|---|---|---|---|
| February 1st half | 1.0 | 0.2 | 0.1 |
| February 2nd half | 1.4 | 0.9 | 0.5 |
| March 1st half | 0.3 | 0 | 0 |
| March 2nd half | 0.3 | 0 | 0 |
| April 1st half | 1.1 | 0.5 | 0.3 |
| Average | 0.82 | 0.32 | 0.18 |
Table 2: Gross Primary Production in mg/l.
Net primary production
No significant difference was observed in Net Primary Production among the three Stations during the study period. The highest and lowest value were recorded in station 1 and Station 2 respectively and the medium value was observed in station 2 having average value 0.1 mg/. The average value of 0.15 mg/l and 0.08 mg/l were observed in Station 1 and Station 3 respectively (Figure 3 and Table 3).

Figure 3: Net Primary Production (mg l d-1).
| Samples | Station 1 | Station 2 | Station 3 |
|---|---|---|---|
| February 1st half | 0.2 | 0.1 | 0.1 |
| February 2nd half | 0.2 | 0.2 | 0.1 |
| March 1st half | 0.1 | 0.1 | -0.1 |
| March 2nd half | 0.1 | -0.1 | 0.2 |
| April 1st half | 0.2 | 0.2 | 0.1 |
| Average | 0.15 | 0.1 | 0.08 |
Table 3: Net Primary Productions (mg/l).
Respiration
The highest value of respiration was observed in Station 1 with the average of 0.56 mg/l. No much difference was observed between Station 2 and Station 3 having average value of 0.3 mg/l and 0.1 mg/l respectively (Figure 4 and Table 4). Generally the highest primary production was observed in Hirgigo bay and lowest value were recorded in Gergusum and medium value was observed in Grar bay during the study period. But the difference is not significant (Figure 5 and Table 5).

Figure 4: Respiration (mg l d-1).

Figure 5: Comparisons of Primary Productions.
| Samples | Station 1 | Station 2 | Station 3 |
|---|---|---|---|
| February 1st half | 0.7 | 0.1 | 0.1 |
| February 2nd half | 0.8 | 0.7 | 0.4 |
| March 1st half | 0.2 | 0.1 | 0.1 |
| March 2nd half | 0.2 | 0 | 0.1 |
| April 1st half | 0.9 | 0.3 | 0.1 |
| Average | 0.56 | 0.18 | 0.1 |
Table 4: Respirations (mg/l).
| Period | Hirgigo Bay | Girar bay | Gergusum |
|---|---|---|---|
| February 1st half | 1.0 | 0.2 | 0.1 |
| February (2nd half) | 1.4 | 0.9 | 0.5 |
| March (1st half) | 0.3 | 0.01 | 0.01 |
| March (2nd half) | 0.3 | 0.01 | 0.01 |
| April (1st half) | 1.1 | 0.5 | 0.3 |
| Mean | 0.8 | 0.3 | 0.2 |
| SD | 0.5 | 0.3 | 0.2 |
| Variance | 0.2 | 0.1 | 0.04 |
| T-value | 0.04 no significant variance | ||
Table 5: Primary Production in mg/l.
Environmental parameter
Temperature: There was not much variation in the water temperature at the three stations and ranged between minimum of 26°C during March to a maximum of 30°C during April. The surface water temperature was greatly influenced by atmospheric temperature and other factors like cloudy and rainfall. No significant difference was observed (P>0.05) among the three stations. The highest temperature which recorded in April (30°C) is not much deviated from the lowest temperature recorded in March (26°C) (Table 6).
| Samples | Month | Station 1 | Station 2 | Station 3 |
|---|---|---|---|---|
| Session 1 | February 1st half | 27 | 27 | 27 |
| Session 2 | February 2nd half | 28 | 29 | 29 |
| Session 3 | March 1st half | 26 | 28 | 27 |
| Session 4 | March 2nd half | 27 | 27 | 27 |
| Session 5 | April 1st half | 28 | 30 | 28 |
Table 6: Temperature in °C.
Salinity: It is fluctuated from season to season or from place to place mainly due to precipitation and temperature, depths of the water also have an effect to the variation of salinity between the stations. The salinity varied between 38%-40% and 39%-41% at stations I and II respectively and salinity ranges between 38%-40% in station 3. The difference in the salinity among the three stations were not statistically significant (P>0.05) (Table 7).
| Samples | Month | Station 1 | Station 2 | Station 3 |
|---|---|---|---|---|
| Session 1 | February 1st half | 38 | 40 | 38 |
| Session 2 | February 2nd half | 40 | 40 | 40 |
| Session 3 | March 1st half | 38 | 39 | 39 |
| Session 4 | March 2nd half | 40 | 39 | 39 |
| Session 5 | April 1st half | 40 | 41 | 40 |
Table 7: Salinity in %.
Turbidity: During the study period from the results it has shown that station 2 and 3 were more turbid than station one, meaning the penetration of light was more in station 1. Station 3 is characterized with high wave action whereas stations 1 and 2 are characterized with calm water and muddy bottom having lowest value of 3.9 and 3.3 respectively. The highest value was recorded in station 1 having 4.1 (Table 8).
| Samples | Month | Station 1 | Station 2 | Station 3 |
|---|---|---|---|---|
| Session 1 | February 1st half | 4.1 | 3.3 | 3.7 |
| Session 2 | February 2nd half | 4.0 | 3.6 | 3.9 |
| Session 3 | March 1st half | 3.9 | 3.7 | 3.4 |
| Session 4 | March 2nd half | 3.9 | 3.5 | 3.5 |
| Session 5 | April 1st half | 4.1 | 4.0 | 3.6 |
Table 8: Light penetration depth in meter (m).
Nutrients: No significant difference in nutrients was observed among the three study Stations during the sampling periods. This presumably reflects the equal effect of environmental factors such as light, water motion, and biological parameters. The highest difference was observed in nitrate among the three stations valued from 0.0096 in Grar and 0.016 in Hirgigo (Figures 6-8 and Table 9).

Figure 6: Sulphide contents.

Figure 7: Nitrite contents.

Figure 8: Ammonia contents.
| Stations | Nutrients (mg/l) in milligram per litter | ||
|---|---|---|---|
| Nitrate | Sulphide | Ammonia | |
| Hirgigo | 0.016 | 0.026 | 0.1 |
| Grar | 0.0096 | 0.05 | 0.1 |
| Gergusum | 0.012 | 0.044 | 0.1 |
Table 9: Nutrients (mg/l).
Discussion
Primary productivity in marine environments represents the link between the physical (light, temperature and water dynamics), chemical (inorganic and organic nutrients) and biological (phytoplankton and higher trophic levels) components of the system [14]. Primary production at any one location will vary in space and time in response to factors limiting or stimulating photosynthesis and phytoplankton growth. Photosynthesis and growth in the sea are limited by nutrients, light or temperature. In the dynamic environment of a water column resources are patchy both in time and space. Consequently, phytoplankton may receive nutrients and light in pulses rather than a continuous supply. Generally, it is the interplay between nutrient and light availability that affects phytoplankton photosynthesis and primary production [28]. The upwelling of deep waters containing nitrate and phosphate produced from the remineralisation of organic matter is important in maintaining high primary productivity in many areas of the ocean. While temperate area are relatively more productive since there is sufficient mixing and availability of nutrients to the upper euphotic zone [29]. Conversely, thermal stratification and down welling will limit primary production in the subtropical gyres as the sunlight surface waters are largely isolated from nutrient rich waters below the thermocline [10].
Photosynthesis and primary production is limited to a thin layer at the ocean surface and whether phytoplankton cells are mixed into the dark waters below will affect primary productivity. As the mixed layer of a water column increases the average photon flux density i.e. light to which the cells are exposed will decrease as the circulating cell will spend longer in darkness. Therefore the total gross productivity of the phytoplankton population will decrease. However, the respiration rate of the population will be relatively constant, whatever the depth of mixing. Net photosynthesis and the resulting net primary productivity will only occur in mixed water where the mixing is less than the critical depth [30,31].
Among the three stations maximum primary productivity was found in station 1 with maximum value of 1.4 mg/l and minimum value of 0.3 mg/l. The lowest Primary Productivity was observed in station 3 with maximum value of 0.5 mg/l and minimum value of 0.01 mg/ and medium value was observed in Station 2 having maximum value of 0.9 mg/l and minimum of 0.01 mg/. Highest value of average Gross Primary Production was observed in station 1 having 0.82 mg/l and medium and lowest value were observe in station 2 and station 3. No significant difference was observed in Net Primary Production among the three Stations during the study period. The highest and lowest values were recorded in station 1 and Station 2 respectively and the medium value was observed in station 2.
The reason of high productivity in Station 1 is due to the highly abundant mangrove swamp which could possibly receive material inputs in nutrient form and since the station is highly confined it is calm there by an advantage of receiving enough light penetration. Mangrove swamps and coral reef have a great role in nutrient supply and nutrient cycling. Mangroves provide large quantity of organic matter to the adjacent coastal water in the form of detritus. The detritus serve as a nutrient source and is an extensive food web in which organism of commercial importance take part.
The highly productive and diverse microbial community living in tropical and sub-tropical mangrove ecosystem continuously transforms nutrient from dead mangrove vegetation into source of nitrogen, phosphate and other nutrient that can be used by the plant. Yet relatively high abundance of mangrove is present in Station 2, since it is found very proximate to the human settled area and salt factory, the deliberate supply of fine sediments, municipal effluent and fuel discharge from the naval base and its land locked nature also prohibited water circulation, making less productive station. Warm and highly stratified Upper Ocean, under the influence of peak insolation together with light winds, inhibits vertical mixing and upward transport of subsurface nutrients. Station 3 was characterized by high wave action with the effect of sediment digitation and recreational activity makes turbid the water. In our study atmospheric conditions, mainly irradiance, which varies considerably during winter owing to variability in the cloud cover, could be the main limiting factor of the winter primary production.
The elements nitrogen, phosphorus and sulphur are required in relatively large quantities to build a functioning phytoplankton cell. Other elements are required in trace amounts, such as many metals [32]. Due to their topography some Station like Hirgigo bay around mangrove swamp gets large amount of nutrients by tidal flushing and discharging of effluent. The nutrient concentration in the three Stations have not much difference, while the concentration of nitrite was found relatively higher in station 1, this is because nitrate rich water comes from deep ocean fixation which could contribute to the net primary production [33]. The Gulf of Aden water flowing in to the Red sea is enriched with nutrients and Particulate organic matter. The most intense inflow of nutrients is in summer, from July to September, through the Aden sub surface current, by which salts are imported into the lower part of euphotic zone of the Red Sea [34].
Substratum nature (sand, rocky, muddy) have significant influence in the productivity of pelagic ecosystem especially in terms of turbidity which reduce light penetration. There are also indirect factors such as grazing, Sedimentation, suspension, and mortality of phytoplankton in determining the effect of primary productivity.
The penetration of sun light in the water decreases with depth. The range of penetration is differing from Station to Station due to some factors; among the factors turbidity inhibits the penetration of light to the depth. Wave action and muddy bottom have a great contribution to make the water turbid. Station 3 is characterized with high wave action and growth of macro algae brings a balance to minimize the turbidity by trapping the sediment has a lowest value of 3.4. Station 1 and 2 are characterized with calm water and muddy bottom having lowest value of 3.9 and 3.3 respectively. The highest value was recorded in station 1 having 4.1 [35-40].
High evaporation and low precipitation maintain the Red Sea as one of the most saline water masses of the world oceans, with mean surface salinity of 42.5 ppt and a mean temperature of 30°C during summer [41-47]. There was no much variation observed among the three stations and sampling dates in salinity. The salinity varied between 38%- 40% and 39%-41% at stations I and II respectively and salinity ranges between 38%-40% in station 3. The difference in the salinity among the three stations were not statistically significant (P>0.05) [48-53].
Conclusion and Recommendation
Productivity of selected station around the coast of Massawa were measured using the Winkler bottle (oxygen) method which was first proposed in 1888 and the highest productivity was recorded in station one while the lowest in station 3 with medium value of station 2 [54-60]. Even though there is a slight difference in the value of primary production, but is not statistically significant. Difference in Primary productivity among these three stations. The value of primary production required from the three stations during the study time was termed as low productivity. This is primarily because, being a tropical basin where light is not usually a limiting factor, and the biological production is limited by the availability of nutrient. There is strong evidence that the production potential of the Red Sea is low [61-65]. It has been observed that over most of the basin, the development of a thermocline and halocline prevents the recycling of nutrient from deeper waters to the euphotic zone. With the little pelagic nutrient input and steady loss of the nutrients leads to low productivity of the red sea being this is the general nature of the red sea, some areas around mangrove swamps and coral reefs are productive relative to the areas of the region due to the entrance of new organic matter to adjacent coastal waters by tidal waters (currents) as well as efficient recycling of nutrient like the coral reefs. Since our sea is found in the nutrient poor region nutrient fixation is the possible solution to the deficiency of nutrient, so protection of mangrove and coral reefs enhance the primary production of the sea by fix certain important nutrients [66-70]. Prevention of coastal erosion and turbidity is also the basic function of corals and mangroves to be recommended for their future protection. During the study the sample locations of the three stations were conducted in specific areas and time throughout the sampling Period. But within each Station there are different and distinct habitats with probably different Productivity. In the future, well-equipped and funded projects should be conducted temporal and spatial studies to determine the average value of Productivity and chlorophyll estimation.
References
- Thornton DCO (2012) Primary Production in the Ocean, Advances in Photosynthesis Fundamental aspects. InTech.
- Miller GT (1971). All materials the Regents of the University of Michigan, USA.
- Blankenship RE (2002) Molecular Mechanisms of Photosynthesis, Blackwell Science Ltd, Oxford, United Kingdom.
- Falkowski PG, Raven JA (2007) Aquatic Photosynthesis (second edition), Princeton University Press, New Jersey, United States.
- Underwood GJC, Kromkamp J (1999) Primary Production by Phytoplankton and Microphytobenthos in Estuaries. Advances in Ecological Research 29: 93-153.
- Falkowski PG, Katz ME, Knoll AH, Quigg A, Raven JA, et al. (2004). The Evolution of Modern Eukaryotic Phytoplankton. Science 305: 354-360.
- Davis (1955) The marine and fresh water plankton. Michigan state university press, USA.
- Asteimer H, Heardt H (1984) Small scale patchiness of the chlorophyll-fluorescent in the sea; aspects instrumentation, data processing and interpretation. Mar Eco ProSer15: 233-245.
- Glud RN, Kuhl M, Kohls O, Ramsing NB (1999) Heterogeneity of oxygen production and consumption in a photosynthetic microbial mat as studied by planar optodes. Journal of Phycology 35: 270-279.
- Trujillo AP, Thurman HV (2005) Essentials of Oceanography (eighth edition), Pearson Prentice Hall, New Jersey, United States.
- Fogg GE, Thake B (1987) Algal cultures and phytoplankton Ecology (third edition), the University of Wisconsin Press, Madison, Wisconsin, United States.
- Jeffrey SW (1980), Algal pigment systems, Primary productivity in the sea, Plenum Press, New York, 33-57.
- Jamart BM, Winter DF, Banse K, Anderson GC, Lam RK (1977) A theoretical study of phytoplankton growth and nutrient distribution in the Paciï¬c Ocean off the northwestern US coasts. Deep-Sea Res 24: 753-773.
- Shulenberger E, Ried JL (1981) The Paciï¬c shallow oxygen maximum, deep chlorophyll maximum, and primary productivity, reconsidered. Deep-Sea Res 28: 901-919.
- Chapman P, Rae CMD, Allanson BR (1987) Nutrients, chlorophyll and oxygen relationships in the surface layers at the Agulhas Retroflection. Deep-Sea Res 34: 1399-1416.
- Gowen RJ, Tett P, Jones K (1992) Predicting marine eutrophication: the yield of chlorophyll from nitrogen in Scottish coastal waters. Mar Ecol Prog Ser 85: 153-161.
- Kolber ZS, Van Dover CL, Niederman RA, Falkowski PG (2000) Bacterial Photosynthesis in Surface Waters of the Open Ocean. Nature 407: 177-179.
- Lorenzen CJ (1966) A Method for the Continuous Measurement of in vivo Chlorophyll Concentration. Deep-Sea Research 13: 223-227.
- Platt T (1972) Local Phytoplankton Abundance and Turbulence. Deep-Sea Research 19: 183-187.
- Winkler LW (1888) Die Bestimmung des in Wasser gelösten Sauerstoffen. Berichte der Deutschen Chemischen Gesellschaft 21: 2843-2855.
- Steeman-Nielsen E (1952) The Use of Radioactive Carbon (C14) for Measuring Organic Production in the Sea ICES Journal of Marine Science 18: 117-140.
- Williams RB, Murdoch MB (1966) Phytoplankton production and chlorophyll concentration in the beaufort channel, north Carolina. Limnology and Oceanography 11: 73-82.
- Yentsch CS, Ryther JH (1959) Relaive significance of the net phytoplankton and nanoplankton in the waters of Vineyard Sound. ICES Journal of Marine Science 24: 231-238.
- Hastenrath S, Lamb PJ (1979) Climatic Atlas of the Indian ocean, The ocean Heat Budget, University of Wisconsin Press, Madison, US.
- Morcos SA (1970) Physical and chemical oceanography of the Red Sea. Oceanography and Marine Biology Annual Review 8:73-202.
- Roberts CM, Shepherd ARD, Ormond RFG (1992) Large-scale variation in assemblage structure of the Red Sea butterfly fishes and angel fishes. Journal of Biogeography 19: 239-250.
- Getahun A (1998) The Red sea as an Extension of the Indian ocean, Large marine Ecosystems of the Indian Ocean assessment, sustainability and Management Blackwell science, Cambridge, US.
- Sundareshwar PV, Morris JT, Koepfler EK, Fornwalt B (2003) Phosphorus Limitation of Coastal Processes. Science 299: 563-565.
- Barnes RSK, Hughes RN (1987) An Introduction to Marine Ecology (second edition), Blackwell Scientific Publications, Oxford.
- Sverdrup HU (1953) On Conditions for the Vernal Blooming of Phytoplankton. ICES Journal of Marine Science 18: 287-295.
- Kirk JTO (1983) Light and Photosynthesis in Aquatic Ecosystems Cambridge University Press, Cambridge, United Kingdom.
- Knoll AH (2003) Life on a Young Planet Princeton University Press, Princeton, New Jersey, United States.
- Sorokin, Yuri I (1994) Ecological Studies: Coral Reef Ecology. Springer 54-55.
- Khomitsa VA, Bibik VA (1979) Seasonal exchange in DO and phosphate between the Red sea and Gulf of Aden. Oceanology 19: 544-546.
- Sofianos SS, Johns W, Murray SP (2002) Heat and fresh water budgets in the Red Sea from direct observations at Bab el Mandab Deep Sea Research II 49: 1323-1340.
- Beckman W (1984) Mesozooplankton distribution on a transect from the Gulf of Adenmonsoon Ocean ologica Acta 7: 87-102.
- Bender M, Grande K, Johnson K, Marra J, Williams P, et al. (1987) A Comparison of Four Methods for Measuring Planktonic Community Production. Limnology and Oceanography 37: 1085-1098.
- Burkill PH, Mantoura RFC, Owens NJP (1993a) Biogeochemical cycling in the northwestern Indian Ocean: a brief overview Deep-Sea Research II 40: 643-649.
- Colman B, Rotatore C (1995) Photosynthetic Inorganic Carbon Uptake and Accumulation in Two Marine Diatoms Plant, Cell and Environment 18: 919-924.
- Devassy VP, Bhattathiri PMA, Qasim SZ (1978) In: Nutrient up take and regeneration ratios in the Red sea with reference to nutrient budgets. Oceanologica Acta 9:271-275.
- Duarte CM, Agustis (1998) The CO2 balance of unproductive aquatic ecosystems. Science 281:234-256.
- Ducklow HW, Harris RP (1993) Introduction to the JGOFS North Atlantic bloom experiment. Deep-Sea Research II 40: 1-8.
- Glud RN, Ramsing NB, Revsbech NP (1992) Photosynthesis and Photosynthesis Coupled Respiration in Natural Biofilms Quantified with Oxygen Microsensors Journal of Phycology 28: 51-60.
- Halim, Y (1984) Plankton of the Red Sea and the Arabian Gulf. Deep Sea Res 31: 969-982.
- Hall DO, Rao KK (1994) Photosynthesis 5th Edition, Cambridge All materials the Regents of the University of Michigan.
- Hancke K, Glud RN (2004) Temperature Effects on Respiration and Photosynthesis in Three Diatom-Dominated Benthic Communities. Aquatic Microbial Ecology 37: 265-281.
- Hecky RE, Kilham P (1988) Nutrient limitation of Phytoplankton in freshwater and marine environments: A review of recent evidence on the effects of enrichment Limino Oceanogr 33: 769-822.
- Hitchcock GL, Olson DB (1992) NE and SW monsoon conditions along the Somali coast during 1987 In: Oceanography of the Indian Ocean, Oxford and IBH Publishing Co, New Delhi.
- Howarth RB (1988) Nutrient limitation of net primary production in marine ecosystems. Annual Review of Ecology and Systematics 19: 89-110.
- Johnston AM, Raven JA (1996) Inorganic Carbon Accumulation by the Marine Diatom Phaeodactylum tricornutum. European Journal of Phycology 31: 285-290.
- Keller AA (1989) Modelling the effects of temperature, light and nutrients on Primary Productivity: An empirical and a mechanistic approach compared. Limino Oceanogr 34: 82-95.
- Kühl M, Glud RN, Ploug H, Ramsing NB (1996) Micro environmental Control of Photosynthesis and Photosynthesis-Coupled Respiration in an Epilithic Cyanobacteria Biofilm. Journal of Phycology 32: 799-812.
- Lassen C, Glud RN, Ramsing NB, Revsbech NP (1998) A method to improve thespatial resolution of photosynthetic rates obtained by oxygen micro sensors. Journal of Phycology 34: 89-93.
- Lenz J, Schneider G, El Hag AGD, Gradinger R, Fritsche P, et al. (1988) Planktological data from the central Red Sea and the Gulf of Aden. Ber Inst Meeresk Univ Kiel 180: 1-200.
- Parsons TR, Maita Y, Lalli CM (1984) A Manual of Chemical and Biological Methods for Seawater Analysis, Pergamon Press Ltd, Oxford, United kingdom.
- Pauly D, Christensen V, Walters C (2000) Eco path, ecosim and ecospace as tools for evaluating ecosystem impact of fisheries. ICES Journal of Marine Science 57: 697-706.
- Pennock JR, Sharp JH (1994) Temporal alternation between light and nutrient limitation of Phytoplankton in a coastal plane estuary Mar Ecol Prog Ser, 11:275-288.
- Revsbech, NP, Jorgensen BB (1983) Photosynthesis of Benthic Microflora Measured with High Spatial Resolution by the Oxygen Microprofile Method: Capabilities and Limitations of the method. Limnology and Oceanography 28: 749-756.
- Ryther JH, Dunstan WM (1971) Nitrogen, phosphorus, and eutrophication in the coastal marine environment Science 171: 1008-1013.
- Siedler, G (1969) General circulation of water masses in the Red Sea. Springer 131-137.
- Shaikh EA, Roff JC, Dowidar NM (1984) Phytoplankton ecology and production in the Red Sea off Jiddah, Saudi Arabia. Mar Biol 92: 405-416.
- Smith SL, Codispoti LA (1980) Southwest monsoon of 1979: chemical and biological response of Somali coastal waters. Science, 289: 597-600.
- Thiel H, Weikert H (1984) Biological oceanography of the Red Sea oceanic system. Deep Sea Res 31: 829-831.
- Thingstad TF, Rassoulzadegan F (1995) Nutrient Limitations, Microbial Food Webs, and Biological C-Pumps Suggested Interactions in a P-limited Mediterranean. Marine Ecology Progress Series 117: 299-306.
- Thornton DCO (2002) Diatom Aggregation in the Sea: Mechanisms and Ecological Implications. European Journal of Phycology 37: 149-161.
- Weikert H (1987) The vertical distribution of zooplankton in relation to habitat zones in the area of the Atlantis II Deep, central Red sea. MarE col Prog Ser 8: 129-143.
- Williams PJB (1998) The balance of plankton respiration and photosynthesis in the open oceans. Nature 394: 55-57.
- Wofsy S (1983) A simple model to predict extinction coefficients and phytoplankton biomass in eutrophic waters Limino Oceanogr 28: 1144-1155.
- Cimbleris A (1997) Respiration rates in bacteria exceeds phytoplankton production in unproductive aquatic systems. Nature 385: 148-151.
Citation: Zewde AA, Zhang L, Ghebresilasse H, Mantay IM (2018) A Comparative Study on Pelagic Primary Productivity in the Coastal Areas of Eritrean Red Sea. J Marine Sci Res Dev 8: 247. DOI: 10.4172/2155-9910.1000247
Copyright: © 2018 Zewde AA, et al. This is an open-access article distributed under the terms of the Creative Commons Attribution License, which permits unrestricted use, distribution, and reproduction in any medium, provided the original author and source are credited.
Select your language of interest to view the total content in your interested language
Share This Article
Recommended Journals
Open Access Journals
Article Tools
Article Usage
- Total views: 6663
- [From(publication date): 0-2018 - Aug 31, 2025]
- Breakdown by view type
- HTML page views: 5691
- PDF downloads: 972