A Performance Evaluation and Optimization of a 135-Mw Circulating Fluidized Bed (Cfb) Coal Based Thermal Power Plant Turbine Cycle Using Exergy Analysis
Received: 15-May-2018 / Accepted Date: 25-May-2018 / Published Date: 30-May-2018 DOI: 10.4172/2576-1463.1000205
Abstract
This study aims to conduct a performance evaluation of a 135 MW Circulating Fluidized Bed (CFB) Coal Based Thermal Power Plant using exergy analysis and use these assessments in order to provide an optimum operation of the said plant. The study includes on determining the effects of ambient condition on the exergy analysis of the plant. The necessary parameters such as temperature, pressure and mass flow rates were collected from the DCS (Distributed Control System) of the plant. These parameters are then inputted in the excel file prepared by the proponent in order to arrive at necessary thermodynamic values. The results in the exergy analysis of the plant showed that most of the exergy losses occur in the boiler with a total of 172222.8 kJ/s under low temperature ambient and 182602.3 kJ/s at high temperature ambient. The high exergy loss in boiler is caused by unutilized heat that was not fully transferred in to turbine cycle system and is just venter out in the atmosphere. Turbine cycle exergy only accounts to 5 to 6 percent of the total initial exergy available. Most of these exergy losses are located at IP/LP turbine (8564.64 kJ/s), condenser (4818.07 kJ/s), cold reheat pipe (4690.16 kJ/s), HP turbine (1697kJ/s) and Deaerator (1055.82 kJ/s). Moreover, based the exergetic efficiency, most of the components in the turbine cycle that involve phase change are most likely to have low efficiency these include the boiler (50.97%), condenser (42.68%), gland steam cooler (75.34%) and LPH no.7 (13.46%). The effect of ambient temperature on the generation of irreversibility in the plant is considerable. During high ambient temperatures, the boiler produces high irreversibility than that of the low ambient temperatures. However, if we look into the turbine cycle side, the most irrversibilities are seen during low ambient conditions which are around 6.54 percent whilst the hotter ambient condition poses only a tad lower value of 5.79 percent. The optimized parameter in maximizing the load is suggested on the results which are: Unit load = 40 MW and main steam temperature = 530 Mpa. Heat exchange between the component and the system is a significant part in the exergy analysis of the plant. Thus an exact approximation of the actual heat transfer would decently make the exergy analysis more accurate. Moreover, the program for thermodynamic value determination can be made from other programming platform aside from excel in order to create a faster generation of data and can be easily organize accordingly. Lastly based on the results provided by the exergy analysis on the plant, it recommended to formulate plans for improvements on plant components with high exergy loses especially the cold reheat pipe.
Keywords: Circulating Fluidized Bed (CFB); Distributed control system; Exergy; Exergy loss; Exergetic efficiency; Irreversibility
Introduction
In recent years, Philippines has conducted a robust construction projects of power generating stations which is aimed at addressing the power shortage that has plagued the country in the early 90’s and up to the recent time in the late 00’s. Most of these power generating stations are coal fired thermal plants that uses circulating fluidized bed technology. Conducting a performance evaluation of these power plants, specifically the 135 MW CFB coal fired power plant, is very timely since these constitutes a bulk of the country’s present and possible future total energy capacity and an optimum operation performance is needed in order to ensure a continuous power supply in the country.
Circulating fluidized bed work on the principle that air supply is from under the bed at high pressure. This lifts the bed material and the coal particles and keep it in suspension. The coal combustion takes place in this suspended condition. This is the fluidized bed. Special design of the air nozzles at the bottom of the bed allows air flow without clogging. Primary air fans provide the preheated fluidizing and combustion air. Nozzles in the furnace walls at various levels distribute the combustion air in the furnace. Fine particles of partly burned coal, ash and bed material are carried along with the flue gases to the upper areas of the furnace and then into a cyclone. In the cyclone the heavier particles separate from the gas and falls to the hopper of the cyclone. This returns to the furnace for recirculation. Hence the name Circulating Fluidized Bed combustion [1-3].
Thermodynamic analysis of power generation systems is one of the most important subjects in the field of energy engineering. The most commonly used method for evaluating efficiency of an energy conversion system is first law of thermodynamics. However, there is an increasing interest in the combined utilisation of the second and first law of thermodynamics using concept such as exergy and exergy destruction. Exergy analysis based on the first and second thermodynamic laws is a useful tool to analyze energy systems.
Exergy analysis reveals the inefficient thermodynamic processes. It can be used to determine the location of exergy loss and exergy destruction in the thermal systems. In addition, it can play an important role in providing guidelines for more effective use of energy source.
This study aims to conduct a performance evaluation of a 135 MW Circulating Fluidized Bed (CFB) Coal Based Thermal Power Plant using exergy analysis and use these assessments in order to provide an optimum operation of the said plant [4].
The principles of the First Law and Second Law of thermodynamics are employed in this study. Equations which are derived from these laws are used in the computation of energy and exergy flows of the system.
Energy and exergy analysis is performed to determine the value of thermal energy based on thermodynamic properties in each of state. Exergy analysis is a tool used to evaluate and measure thermal loss in terms of type, quality and quantity.
Methods
Plant setup overview
The plant subject to performance evaluation and optimization is a 135 MW coal-fired power plant which utilizes Circulating Fluidized Bed (CFB) technology as its combustion system. The plant is equipped with SG-420/13.9-M2305, a 420 tons per hour ultra-supercritical, intermediate reheat, natural circulation, circulating fluidized bed boiler with single drum, which is designed and manufactured by Shanghai Boiler Works Co., Ltd., a reheat-regenerative double cylinder condensing turbine and a 150 MW rated capacity air-cooled generator both manufactured by Alstom company (Figure 1).

Figure 1: 135 MW Circulating Fluidized Bed (CFB) power plant overall setup and process flow.
System setup
The area of concern in this study is particular on the steamwater loop of the abovementioned power plant. This includes the major components of the plant: Boiler and Turbine-generator and its corresponding auxiliaries.
Boiler house seats the combustion venue of the power plant and it is where the conversion of water into steam occurs. Accordingly, major heat exchanges happen in each part of the SG-420/13.9-M2305 boiler since it is designed to recover most of the combustion heat. For this reason, the said boiler is being modeled into separate sections in order to come up with a detailed energy and exergy balance.
System process flow
Steam exhaust from LP Turbine is directed towards the condenser thru the action of the negative pressure provided by the water-ring vacuum pumps which is maintained at -94 kpa. The condensate settles at the condenser hotwell and is pumped by the condensate extraction pump, a vertical centrifugal pump type, to a string of heat exchangers headed first to Gland Steam Cooler (GSC), a U-Tube heat exchanger intended for the cooling of gland steam, then to Low Pressure (LP) heaters No. 1 through No.5, each heated by bled steam from IP and LP turbine before entering the deaerator. The sprayed condensate is directly heated by extraction No.3 steam through trays in order to remove the oxygen from the system. The mixing streams settles down to the feedwater tank. The condensate waters which is now called Feedwater at this point is pumped to a series of two High Pressure (HP) Heaters by a Boiler Feed Pump in order to gain more heat before going to the primary and secondary economizer. The feedwater is further heated thru the boiler until converted into superheated steam with design full load pressure of 13.8 Mpa and temperature of 539 degrees C. The flow sequence thru the boiler secondary economizer is as follow: Boiler drum --- (Furnace walls, Cyclone Walls, Evaporator) --- Backpass Walls --- Low Temp.(LT) Superheater --- Medium Temp. (MT) Superheater --- Final Superheater. The superheated steam is led to the High Pressure (HP) Turbine converting heat energy into shaft work. The exhaust steam from HP turbine which is now called the Cold reheat steam is led back to the boiler and is heated in the reheater at the Heat Recovery Area (HRA) where the final super heater, primary and secondary economizer and the air preheater is also located. There are four tube groups set in the reheater primary arrangement. After heated by heating surface, reheat steam is led into steam turbine intermediate pressure cylinder by two ᶲ457 pipes. After expanding at the IP cylinder, the steam is led to LP turbine via IP internal arrangement for the final expansion thereby completing the steam-water cycle. The shaft work provided by the double cylinder turbine is converted into electrical energy by the coupled air-cooled generator (Figure 2).

Figure 2: Process flow of the steam-water loop.
Methodology flow
Sequence analysis consists of the actual data collected from the DCS (Distributed Control System) of a single unit of the 3 x 135 MW CFB power plant, the necessary calculations and outcomes, performance evaluation as well as optimization. Initial data mostly are operating data such as the parameters of pressure, temperature, and the mass flow rate of each component of the unit and ambient conditions. The calculation is done using known thermodynamic equations and relative engineering formulas deemed useful in this study. The outcomes of the calculation results are data, tables and diagrams. Based on these results, performance evaluation shall be conducted and optimum operating parameters shall be determined (Figure 3).

Figure 3: Methods flow procedure.
Effect of ambient temperature on a full-load performance
The influence of ambient condition especially the surrounding temperature is determined using a comparative exergy analysis on a 135 MW load. Extreme values of ambient temperature were recorded throughout 2017. The lowest temperature was observed to be 24°C while the highest is at 31°C. These two temperatures were the basis for the comparative study. Load variation occurs throughout the day since the power plant under investigation supplied variable load as compared to base load status of most coal-fired plants. By this, the proponent had sought to acquire data at different dates with an hourly load of 135 MW with a corresponding ambient temperature of either 24°C or 31°C. Five different data in each of the said temperatures were recorded and their consequent results were taken into average. In addition, it was being ensured that all the dates where the data was taken have the same operational condition which means all equipment running on one datum should be the same equipment running on another datum. Through this, the integrity of the results is safeguarded allowing only minimal room for inaccuracy.
Exergy analysis at different loads
Exergy analysis was performed at different loads namely at 135 MW (full load), 100 MW and 50 MW. Every components performance was evaluated at these loads. A comparative analysis was then taken out in order to identify at which plant load has the most inefficiencies. All of these plant loads were assessed under the same ambient temperature which was at 24°C.
Exergy analysis
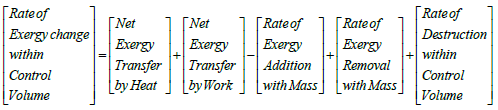
By combining the first and second law of thermodynamics, the mathematical equation of an exergy balance is shown on equation. An expression for an exergy analysis for an open system is
The general steady-state diagram for each component of the steam-water loop shall be treated in the Figure 4.

Figure 4: Steady-State diagram.
Boiler modeled as a single entity
Exergy analysis of the investigated plant is mainly focused on the steam-loop or the turbine cycle. Treating section 1, 2, 3, 4 and the reheater into a single entity would help simplify the performance analysis of the said cycle. Additionally, sectional exergetic values of the boiler are reflected at the excel file generated by the proponent and is served as a reference (Figure 5).

Figure 5: Boiler as single system.
Concept of fuel and product exergy
In energy transfer and conversion processes of a thermal system or equipment, the ratio between the exergy used or gained and payment or consumptive exergy is defined as the exergy efficiency of the system or equipment. In order to express every equipment’s production purpose, many scholars use “fuel-product” concept to define equipment function. Quantified the production purpose of an equipment or a component is “product” (P), and consumptive exergy for the “product” is called “fuel” (F).
Calculation of heat exchange between the system and environment
The heat exchange between each component and environment was assumed and modeled into macroscopic level of heat exchange wherein every component is fitted in an imaginary system established by the proponent having a steady state steady flow. The proponent assumes that all components have the same surface temperature considering that every plant systems that are subjected to high temperatures are insulated and all of these parts’ insulation surfaces have more or less the same temperature. There were two imaginary systems being established. First, the system housing all components located in the boiler. Second, the system housing all components located in the turbine side of the plant.
Optimization procedure
There are two types of optimization that will be covered in this study. First, the optimization based on the implicit results of the exergy analysis. This will include the optimization of individual components that produce high exergy losses by means of creating applicable measures so as to minimize these inefficiencies. Second is the optimization based on the relative results between the overall exergetic efficiency and with that of temperature and power. In particular, this aims to minimize the overall inefficiency of the plant and for this regard, maximizing the exergetic efficiency which is the results of the exergy analysis being conducted by optimizing operational parameter/s. Figure 6 below shows the procedural flow chart for the optimization process.

Figure 6: Flow chart for the optimization procedure.
Optimization: The area for optimization here in the study as said earlier is focused on minimizing the overall inefficiency of the plant or maximizing the overall exergetic efficiency.
Design variables: The design variables being considered in this study are the main steam temperature (MST) and unit load (PWR) which will be the independent variables while the exergy efficiency (%) on the other hand, will be the dependent variable.
Contraints: There are constraints being considered among the design variables since there are design limitations that need to be followed in order to put the plant in safe operating conditions. Below are constraints of the design varibles;
Lower Limit: Main Steam Temperature (MST) ≥ 480°C
Upper Limit: Main Steam Temperature (MST) ≤ 545
Lower Limit: Unit Load (PWR) ≥ 40 MW
Upper Limit: Unit Load (PWR) ≤ 142 MW
These upper and lower design operating limits are suggested by the manufacturer of the unit
Objective function: In this study, the objective function for optimization is maximizing the overall exergetic efficiency. In the steam-water loop, overall exergetic efficiency is the sum of the exergy loss coefficient in every single component of the system.
Results and Discussion
Plant performance using exergy analysis results
From the corresponding equations for each component, exergy and specific exergy is directly derived from obtained thermodynamic properties. Exergy analysis results on a 135 MW load under 24°C ambient temperature is shown on Table 1. A total of 196,174.67 kJ/s of exergy losses is generated out of burning 351292.4 kJ/s worth of coal. 43,059.7 kJ/s and 94830.29 kJ/s of what remained are converted into HP and IP/LP turbine work respectively. This amounts to 137889.7 kJ/s converted mechanical work or around 137.89 MW. Considering the generator’s efficiency of 98%, the net energy generated by the plant would be around 135.13 MW. Most of the exergy losses which amounts to 172222.8 kJ/s are found on the boiler side wherein all of these unavailable energy exits in the form of outlet flue gas and is vented out of the atmosphere through the chimney. Only 23,951.90 kJ/s exergy losses were accounted on the turbine side and the bulk of it were found on IP/LP turbine (8564.54 kJ/s), condenser (4818.07 kJ/s), cold reheat pipe (4690.16 kJ/s), HP Turbine (1697.63 kJ/s) and Deaerator (1055.82 kJ/s). Notice that the condenser exergy balance results using “Fuel and Product” exergy were highlighted. This is to emphasize the negative entropy generated by the component which occurred due to the fact that the exhaust steam which is cooled down by the circulating sea water has the higher exergy value compared to that of the cooling water. In addition, the exhaust steam is part of the steam-water loop and is designated as Product exergy in this study since it serves as an available energy intended to be used further in the entire turbine cycle whilst the cooling water is considered as fuel exergy. Yong and Lei (2012) generated the same results and noted that it is generally acknowledged that negentropy (negative entropy) is the product of condenser which is consumed by other equipment as their fuels. Cold reheat pipe is another component with the highest exergy loss in the turbine side. This is rather uncommon for this component of the turbine cycle considering that most of the major pipelines’ exergy losses are derived from pressure and temperature drops. Taking a note that the cold reheat pipe system includes desuperheater line, which normally decreases the temperature slightly before entering the reheater. However based on the actual exergy loss of this component, it might suggest that the desuperheater temperature control valve is not functioning well in regulating the temperature or in this case over attemperation which resulted to a much lower reheater inlet temperature. Another possible cause could have been the valve passing of the temperature control valve which resulted also on the latter. In general, most of the high exergy losses in the cycle occur in the turbomachine itself, open-type heat exchanger in the instance of deaerator wherein the condensate is in direct contact with the heating steam and lastly, the condenser where phase change transpires which results to high exergy loss. The rest of the components in the turbine cycle show lower exergy losses. These comprise Condensate Extraction Pump (CEP), Gland Steam Cooler (GSC), hot reheat pipe and the rest of closed-type heaters which are under 1000 kJ/s.
| Low Temperature | ||||||||
|---|---|---|---|---|---|---|---|---|
| Item | Component | Calculation Results of Exergy Analysis of the Plant | ||||||
| Fuel (KJ/S) | Product (KJ/S) | Exergy Loss (KJ/S) | Exergy Efficiency (%) | Exergy Loss Rate (%) | Exergy Loss Coeff. (%) | Unit Exergy Consump. (KJ/KJ) | ||
| 1 | SEC1 | 351292.4 | 179069.7 | 172222.8 | 0.5097 | 87.791% | 0.4903 | 1.96 |
| 2 | SEC2 | |||||||
| 3 | SEC3 | |||||||
| 4 | SEC4 | |||||||
| 5 | Reheater | |||||||
| 6 | Main Steam Pipe | 158249.88 | 158027.57 | 222.21 | 99.86% | 0.113% | 0.06% | 1 |
| 7 | HP Turbine | 44772.63 | 43075 | 1697.63 | 96.21% | 0.865% | 0.48% | 1.04 |
| 8 | Cold Reheat Pipe | 97710.17 | 93020.01 | 4690.16 | 95.20% | 2.391% | 1.34% | 1.05 |
| 9 | Hot Reheat Pipe | 126098.95 | 126002.16 | 95.8 | 99.92% | 0.049% | 0.03% | 1 |
| 10 | IP/LP Turbine | 103410.13 | 94845.59 | 8564.54 | 91.72% | 4.366% | 2.44% | 1.09 |
| 11 | Condenser | 3509.99 | 8458.66 | 4818.07 | 42.68% | 2.456% | 1.37% | 2.34 |
| 12 | CEP | 271.22 | 254.21 | 8.01 | 97.42% | 0.004% | 0.00% | 1.03 |
| 13 | GSC | 41.83 | 31.52 | 10.32 | 75.34% | 0.005% | 0.00% | 1.33 |
| 14 | LPH#7 | 232.89 | 31.35 | 201.54 | 13.46% | 0.103% | 0.05% | 7.43 |
| 15 | LPH#6 | 1783.27 | 1556.86 | 216.41 | 87.86% | 0.110% | 0.06% | 1.14 |
| 16 | LPH#5 | 3548.09 | 2995.18 | 552.92 | 84.42% | 0.282% | 0.16% | 1.18 |
| 17 | LPH#4 | 3285.82 | 2966.71 | 319.11 | 90.29% | 0.163% | 0.09% | 1.11 |
| 18 | Deserator | 16018.32 | 14962.5 | 1055.82 | 93.41% | 0.538% | 0.30% | 1.07 |
| 19 | BFP | 2152.8 | 1951.29 | 191.51 | 91.10% | 0.098% | 0.05% | 1.1 |
| 20 | HPH#2 | 8567.3 | 7980.7 | 585.6 | 93.15% | 0.299% | 0.17% | 1.07 |
| 21 | HPH#1 | 4958.29 | 4270.43 | 687.85 | 85.13% | 0.351% | 0.20% | 1.16 |
Table 1: Exergy Analysis on a 135 MW under low temperature condition.
Aside from just taking exergy loss as a determinant of plant performance, using other factors derived from Fuel and Product exergy model would be very effective in establishing a detailed status of the plant. Utilizing exergy efficiency, exergy loss rate, exergy loss coefficient and unit exergy consumption would give a comprehensive insight of the exergy analysis of the plant. In Table 1, the components with the lowest exergy efficiency are the boiler (50.97%), condenser (42.68%), gland steam cooler (75.34%) and LPH no.7 (13.46%). These values reflect each of the components performance by means of evaluating the ratio of the output with that of the input. In the foregoing discussion, some components with high exergy loss did not demonstrate the same in terms of lower exergetic efficiency which should have been the case considering the large amount of unutilized exergy. However, this sizeable amount of exergy loss should be viewed relatively with that of the entering stream of exergy when intra-component performance is being considered. For instance, the exergy loss of the cold reheat pipe in preceding discussion involves a 4690.16 kJ/s worth of exergy losses but the exergy efficiency is still high at 95.2 percent. Looking at the entering stream of exergy which is about 97,710.17 kJ/s and outlet stream of 93,020.01 kJ/s, the involved losses would be just a small chunk of what the component exergy comprises.
In parallel with exergy efficiency is the unit exergy consumption which indicates on how well the component consumes the incoming exergy. . It was highlighted by Yong and Lei that the degree of irreversibility of the system becomes higher when the unit exergy consumption becomes larger in value. This mirrors the exergy efficiency result of the boiler, condenser, gland steam cooler and LPH no.7 with corresponding unit exergy consumption values of 1.96, 2.34, 1.33 and 7.43 respectively. Boiler has been a common place for irreversibility in most combustion-type power plants. Taking for example the recent study conducted by Jamali et al. [5] on a Fixed Bed Coal-fired (FBC) power plant where they arrive on a result of 33 percent exergetic efficiency on their combustor, considerably lower compared to 50.97 percent of the boiler being evaluated in this study. This is because most of the heat being liberated during the combustion process were not fully recovered in the Heat Recovery Area (HRA) and are just discharged through the chimney. Condenser is another component that exhibited a lower exergetic efficiency and high unit exergy consumption. This is also rather common to all thermal plants since most of the heat rejected in the turbine cycle occurs in the condenser. As been discussed earlier, condenser is one component in the turbine cycle that involves phase change along with the other two components that have a large value of unit exergy consumption, the gland steam cooler and LPH (low pressure heater) no. 7. All of their main fuel exergy has undergone phase change which constitutes a huge drop of enthalpy before exiting as liquid phase.
When viewing components performance in relative with the overall plant, exergy loss rate and exergy loss coefficient would be a practical factor in the assessment. In Table 1, the components with high exergy loss rate and exergy loss coefficient are the boiler, IP/LP turbine, cold reheat pipe, condenser, and HP turbine with respective values of 87.805%, 4.336%, 2.456%, 2.391% and 0.866% for exergy loss rate and 49.03%, 2.44%, 1.34%, 1.37% and 0.48% for exergy loss coefficient. These values suggests that the abovementioned components are weak links of the power plant performance and considered as areas for plant improvements.
Effect of ambient temperature on exergy analysis
Table 2 shows the exergy analysis on a full load plant under high temperature condition which is at 31°C. High temperature ambient condition poses similar trends of exergy losses among all components in the turbine cycle as compared to a 24°C ambient temperature. The highest exergy loss is located at the boiler while other venues of high exergy loss are at IP/LP as well as HP turbine, condenser and cold reheat pipe. While the components that exhibited lower exergy losses are the Condensate Extraction Pump (CEP), GSC, hot reheat pipe and the closed-type heaters. Other determinants of plant performance in the exergy analysis of 135 MW load at high temperature condition demonstrated the same trends with that of a 24°C ambient temperature condition. However, the total exergy loss and overall exergetic efficiency of the plant poses different result. The total exergy loss under high temperature ambient condition which is at 206,436.75 kJ/s is a tad higher compared to the total exergy loss at low temperature condition which is around 196,174.67 kJ/s. When it comes to overall exergetic efficiency, the high temperature ambient condition resulted to a much lower efficiency compared with low temperature ambient condition with values of 41.24 percent and 44.16 percent respectively.
| High Temperature | ||||||||
|---|---|---|---|---|---|---|---|---|
| Item | Component | Calculation Results of Exergy Analysis of the Plant | ||||||
| Fuel (KJ/S) | Product (KJ/S) | Exergy Loss (KJ/S) | Exergy Efficiency (%) | Exergy Loss Rate (%) | Exergy Loss Coeff. (%) | Unit Exergy Consump. (KJ/KJ) | ||
| 1 | Boiler | 354800 | 172197.7 | 182502.3 | 48.53% | 8 8.454% | 51 .98% | 2.0604226 |
| 2 | ||||||||
| 3 | ||||||||
| 4 | ||||||||
| 5 | ||||||||
| 6 | Main Steam Pipe | 152711.58 | 152446.35 | 265.23 | 99.83% | 0.13% | 0.08% | 1.0017398 |
| 7 | HP Turbine | 44470.75 | 41973.13 | 2497.62 | 9 4.38% | 1.21% | 0.71% | 1.059505 |
| 8 | Cold Reheat Pipe | 92970 .03 | 88529.01 | 4441.03 | 95.22% | 2.15% | 1.26% | 1.050164 |
| 9 | Hot Reheat Pipe | 120658.46 | 120549.61 | 108.85 | 99.91% | 0.05% | 0.03% | 1.0009029 |
| 10 | IP/LP Turbine | 104135.04 | 9511 5.77 | 9020.27 | 91.34% | 4.37% | 2.57% | 1.0948347 |
| 11 | Condenser | 749.05 | 3125. 25 | 2365 | 23.97% | 1.15% | 0.67% | 4.1723107 |
| 12 | CEP | 268.5 | 259.98 | 8.52 | 96.82% | 0.00% | 0.00% | 1.0327911 |
| 13 | GSC | 25.03 | 38.44 | 53.27 | 153.62% | 0.03% | 0.02% | 0.6509566 |
| 14 | LPH#7 | 1 93.95 | 10.25 | 183.7 | 5.29% | 0.09% | 0.05% | 18.915308 |
| 15 | LPH#6 | 1 751.58 | 1583.82 | 167.76 | 90.42% | 0.08% | 0.05% | 1.1059209 |
| 16 | LPH#5 | 2960.01 | 2476.53 | 483.48 | 83.67% | 0.23% | 0.14% | 1.1952233 |
| 17 | LPH#4 | 3087.10 | 2751.42 | 335.68 | 89.13% | 0.16% | 0.10% | 1.1220036 |
| 18 | Deserator | 15138.58 | 1 3523 .51 | 1615.06 | 89.33% | 0.78% | 0.46% | 1.1194262 |
| 19 | BFP | 1674 | 1530.1 | 143.9 | 91.40% | 0.07% | 0.04% | 1.0940465 |
| 20 | HPH#2 | 8481.67 | 6646.76 | 1834.91 | 78.37% | 0.89% | 0.52% | 1.2760616 |
| 21 | HPH#1 | 4557.09 | 4347.93 | 309.16 | 93.36% | 0.15% | 0.09% | 1.0711046 |
Table 2: Exergy Analysis on a 135 MW under high temperature condition.
These results suggest that it is more likely to have larger irreversibilities in hotter conditions especially during summer than that of a colder one. Rudiyanto B et al. also arrived at the same results where they investigated four different ambient temperature points 17°C, 18°C, 19°C and 20°C.
The Figure 7 above shows the comparative bar graph of a 135 MW load under low temperature condition which is at 24 degree Celsius and high temperature condition at 31 degree Celsius. Based on the graph, irreversibilities in the boiler is much higher during hotter condition than that of colder condition.

Figure 7: Turbine Cycle Energy Loss including the boiler.
Figure 8 shows the bar graph of turbine cycle which excludes the boiler since a huge chunk of irreversibilities occurs in this component which prompts a huge disparity among the other data. So in order to have a good comparative analysis among the components boiler is taken out of the picture.

Figure 8: Turbine Cycle Exergy Loss excluding the boiler.
The above Figure 9 shows the exergetic stream of the whole plant under low ambient temperature condition. This illustrates also how are the chemical exergy of coal is being distributed along the way from combustion all the way to the useful work that is the work of turbine. Of the 351.29 MW, only 39.24 percent was converted to mechanical work and the rest is considered as waste exergy with the bulk of it exiting as flue gas which constitutes 53.24 percent of the initial exergy.

Figure 9: Sankey diagram of a 135 MW Load under low ambient temperature.
Figure 10 on the other hand is the Sankey diagram for high ambient temperature condition. In contrast to the previous diagrams which is under low temperature condition, the initial exergy is a bit larger at 354.8 MW while the converted mechanical work is 38.63 percent a little lower than its match. Moreover, the exiting stream of flue gas has increased to 55.6 percent from 53.24 percent. The turbine cycle exergy waste comprises 5.79 percent of the coal exergy while around 6.54 percent of it during low temperature condition.

Figure 10: Sankey diagram of a 135 MW Load under high ambient temperature.
Exergy analysis at different loads
Exergy Analysis performed at different loads would be beneficial especially during variable load condition of the plant. By this, it could be determined on which load is the plant more efficient. Tables 3 and 4 are exergy analysis results of a 100 MW and 50 MW load respectively [6,7].
| 100 MW | ||||||||
|---|---|---|---|---|---|---|---|---|
| Item | Component | Calculation Results of Exergy Analysis of the Plant | ||||||
| Fuel (KJ/S) | Product (KJ/S) | Exergy Loss (KJ/S) | Exergy Efficiency (%) | Exergy Loss Rate (%) | Exergy Loss Coeff. (%) | Unit Exergy Consump. (KJ/KJ) | ||
| 1 | SEC1 | 255455 | 127420.8 | 128035.1 | 49.88% | 91.46% | 36.45% | 2.00 |
| 2 | SEC2 | |||||||
| 3 | SEC3 | |||||||
| 4 | SEC4 | |||||||
| 5 | Reheater | |||||||
| 6 | Main Steam Pipe | 11544.9 | 115177.4 | 272.0087 | 99.75% | 0.19% | 0.08% | 1.00 |
| 7 | HP Turbine | 33877.35 | 31527.41 | 2249.94.2 | 93.36% | 1.61% | 0.64% | 1.07 |
| 8 | Cold Reheat Pipe | 70993.24 | 70640.37 | 352.8717 | 99. 50% | 1.61% | 0.10% | 1.00 |
| 9 | Hot Reheat Pipe | 89269.16 | 88946.43 | 322.7304 | 99.64% | 0.23% | 0.09% | 1.00 |
| 10 | IP/LP Turbine | 73150.87 | 69769.69 | 3381.18 | 95.38% | 2.42% | 0.96% | 1.05 |
| 11 | Condenser | 1713.9 | 4034.249 | 2289.748 | 42.48% | 1.64% | 0.65% | 2.35 |
| 12 | CEP | 261.22 | 250.8791 | 10.3409 | 96.04% | 0.01% | 0.00% | 1.04 |
| 13 | GSC | 41.83444 | 30.64883 | 11.18561 | 73.26% | 0.01% | 0.00% | 1.36 |
| 14 | LPH#7 | 296.4839 | 281.3189 | 15.165 | 94.89% | 0.01% | 0.00% | 1.05 |
| 15 | LPH#6 | 1395.792 | 858.7156 | 537.0763 | 61 .52% | 0.38% | 0.15% | 1.63 |
| 16 | LPH#5 | 2282.195 | 1777.5 | 504.6949 | 77.89% | 0.36% | 0.14% | 1.28 |
| 17 | LPH#4 | 2253.846 | 1892.914 | 360.9319 | 83.99% | 0.26% | 0.10% | 1.19 |
| 18 | Deserator | 10416.74 | 9540.634 | 876.1031 | 91 .59% | 0.63% | 0.25% | 1.09 |
| 19 | BFP | 1311.2 | 1094.627 | 216.5726 | 83 .48% | 0.16% | 0.06% | 1.2 |
| 20 | HPH#2 | 5710.958 | 5449.686 | 2612715 | 95.43% | 0.19% | 0.07% | 1.05 |
| 21 | HPH#1 | 3299.344 | 3002.775 | 296.5694 | 91.01% | 0.21% | 0.08% | 1.1 |
Exergy Eff.: 60.15%
Table 3: Exergy Analysis on a 100 MW load under low temperature condition.
| 50 MW | ||||||||
|---|---|---|---|---|---|---|---|---|
| Item | Component | Calculation Results of Exergy Analysis of the Plant | ||||||
| Fuel (KJ/S) | Product (KJ/S) | Exergy Loss (KJ/S) | Exergy Efficiency (%) | Exergy Loss Rate (%) | Exergy Loss Coeff. (%) | Unit Exergy Consump. (KJ/KJ) | ||
| 1 | SEC1 | 140578.9 | 81199.1 | 59479.8 | 57.72% | 87.275% | 16.93% | 1.732517 |
| 2 | SEC2 | |||||||
| 3 | SEC3 | |||||||
| 4 | SEC4 | |||||||
| 5 | Reheater | |||||||
| 6 | Main Steam Pipe | 50897.87 | 60786.44 | 111.4262 | 9 9.8 2 % | 0.15% | 0.03% | 1.001833 |
| 7 | HP Turbine | 19654.65 | 18150.81 | 1503.835 | 92.35% | 2.21% | 0.43% | 1.082852 |
| 8 | Cold Reheat Pipe | 36980.19 | 36004.57 | 975.6251 | 97.36% | 1.43% | 0.28% | 1.027097 |
| 9 | Hot Reheat Pipe | 45726.18 | 46292.06 | 434.1186 | 99.07% | 0.64% | 0.12% | 1.009378 |
| 10 | IP/LP Turbine | 35797.64 | 33820.18 | 1977.468 | 94.48% | 2.90% | 0.55% | 1.05847 |
| 11 | Condenser | 1616.689 | 2147.047 | 499.7575 | 75.30% | 0.73% | 0.14% | 1.328052 |
| 12 | CEP | 258.22 | 248.5777 | 9.642315 | 95.27% | 0.01% | 0.00% | 1.03879 |
| 13 | GSC | 52.29 | 47.69308 | 4.6 | 91.21% | 0.01% | 0.00% | 1.096386 |
| 14 | LPH#7 | 32.1226 | 18.95389 | 13.16871 | 59.00% | 0.02% | 0.00% | 1.69 4776 |
| 15 | LPH#6 | 8 21 .5534 | 352.4384 | 484.4387 | 42.90% | 0.71% | 0.14% | 2.331055 |
| 16 | LPH#5 | 10 45.645 | 726. 5419 | 334.4266 | 69.48% | 0.49% | 0.10% | 1.439208 |
| 17 | LPH#4 | 10 22.009 | 802.3727 | 234.9606 | 78.51% | 0.34% | 0.07% | 1.273734 |
| 18 | Deserator | 5 423. 26 | 3686.245 | 1752.338 | 67.97% | 2.57% | 0.50% | 1.471215 |
| 19 | BFP | 9 30.1 6 | 927.56 | 2.6 | 99.72% | 0.00% | 0.00% | 1.002803 |
| 20 | HPH#2 | 2594.963 | 2386.338 | 223.9488 | 91.96% | 0.33% | 0.05% | 1.087425 |
| 21 | HPH#1 | 1169.738 | 1174.771 | 110.2908 | 100.43% | 0.16% | 0.03% | 0.995716 |
Table 4: Exergy Analysis on a 50 MW load under low temperature condition.
In a 100 MW load, the total exergy loss is 139,993.52 kJ/s while its overall exergetic efficiency is around 60.15 percent. On the other hand, 50 MW load generates 65,152 kJ/s with an exergetic efficiency of 80.60%.
The Figure 11 above shows the comparative bar graph of exergy losses under 135 MW, 100 MW, and 50 MW loads. Based on the graph, irreversibilities in the boiler is much larger during high loads.

Figure 11: Turbine Cycle Exergy Loss at different loads (boiler included).
Figure 12 shows the bar graph of turbine cycle components (excluding the boiler) exergy losses at three different loads (135 MW, 100 MW and 50 MW). Most of the components generates large amount of exergy losses at higher loads.

Figure 12: Turbine Cycle Exergy Loss at different loads (boiler excluded).
Figure 13 illustrates that as the plant operates at higher loads the overall exergetic efficiency becomes lower.

Figure 13: Overall Exergetic Efficiency vs. Load.
Figure 14 shows a relative illustration of the preceding figure which implies that the total exergy losses has becomes larger at high loads.

Figure 14: Total Exergy Losses vs. Load.
Optimization
Optimization through implicit results of exergy analysis: Based on the exergy analysis results, the IP/LP Turbine, HP turbine, cold reheat pipe line, deaerator and condenser post the highest exergy loss rate among the components being considered in the steam cycle. Of the five components, the cold reheat pipe, condenser and the deaerator can be optimized by practical operational means.
Cold reheat pipe optimization: Most of the pipelines in the cycle usually poses a minimum amount of losses. However, based in the exergy results, cold reheat pipe is among the components that registered a high amount of exergy loss. It is mainly because the temperature drop between the inlet before desuperheater and its outlet is big. Normally, the outlet temperature is a few centigrade below the inlet. The most possible cause/s of this is the valve passing or the unreliable automation of the temperature regulation valve. This exergy loss can be minimize by resolving both problems of the temperature regulation valve.
Deaerator optimization: Deaerator is one of the components in the plant where phase change occur which poses a great deal of exergy loss. However, this exergy loss can be reduced in a few proportions by minimizing the venting of air in the atmosphere. This can be achieve by allowing minimal air ingress in the system. System leaks is one aspect that must be controlled since most of the air ingress occur on these leakages.
Condenser optimization: The same with the deaerator, condenser is also a venue of phase change in the turbine cycle which is likely that it registered a high inefficiency. Practical operations in the plant will help reduce a few amount of these exergy losses. High temperature rise between the inlet and outlet of the cooling water would mean higher inefficiency of the said component. This can be decreased by regular operation of the condenser tube cleaning system which prevents marine life in the water from getting into and clinging in the tubes and keeping the tubes clean.
Mathematical optimization: Data were collected from the DCS (Distributed Control System) which contains the unit load (MW) at 40 MW, 50 MW, 75 MW, 100 MW, 125 MW and 135 (MW) and their corresponding Main Steam Temperature (MST). All these data were inputted in the pre-programmed excel file made by the proponent and the overall exergetic efficiency were tabulated accordingly with the said independent variables.
Design variables: The decision variables represent (unknown) decisions to be made. This is in contrast to problem data, which are values that are either given or can be simply calculated from what is given. For this problem, the decision variables are main steam temperature (MST) and unit load (PWR).
Constraints: The following constraints are being included in the objective function were all the values are based on the design limit of the plant.
Lower Limit: Main Steam Temperature (MST) ≥ 480°C
Upper Limit: Main Steam Temperature (MST) ≤ 540°C
Lower Limit: Unit Load (PWR) ≥ 40 MW
Upper Limit: Unit Load (PWR) ≤ 142 MW
Objective function: Based on the gathered data, a multiple regression analysis is performed using Microsoft excel. The summary of this regression analysis is shown in Appendix D. The linear equation generated in the regression analysis is as follows:
Z = 465.5144 - 0.68923 (a) - 0.35948(b)
Where
z = exergetic efficiency
a = main steam temperature (°C)
b = unit load (MW)
The above linear equation is the objective function that is sought to be maximized.
Maximizing of objective function: Using excel solver all data were inputted and the maximum global optimization of value are a= 530°C, b = 40 MW.
Conclusion
Summary
In this paper, exergy analysis and effect of ambient temperature are investigated. This study also gives insight about the location and the magnitude of irreversibility along with efficiency of the 135- MW Circulating Fluidized Bed (CFB) coal-fired power plant under investigation.
Conclusion
Based on the results that the proponent crop up, the following conclusions were established [8-11]:
1. Most of the exergy losses occur in the boiler with a total of 172222.8 kJ/s under low temperature ambient and 182602.3 kJ/s at high temperature ambient. The high exergy loss in boiler is caused by unutilized heat that were not fully transferred in to turbine cycle system and is just venter out in the atmosphere. Turbine cycle exergy only accounts to 5 to 6 percent of the total initial exergy available. Most of these exergy loss are located at IP/LP turbine (8564.64 kJ/s), condenser (4818.07 kJ/s), cold reheat pipe (4690.16 kJ/s), HP turbine (1697kJ/s) and Deaerator (1055.82 kJ/s). Moreover, based the exergetic efficiency, most of the components in the turbine cycle that involve phase change are most likely to have low efficiency these include the boiler (50.97%), condenser (42.68%), gland steam cooler (75.34%) and LPH no.7 (13.46%).
2. The effect of ambient temperature on the generation of irreversibility in the plant is considerable. During high ambient temperatures, the boiler produces high irreversibility than that of the low ambient temperatures. However, if we look into the turbine cycle side, the most irreversibility’s are seen during low ambient conditions which is around 6.54 percent whilst the hotter ambient condition poses only a tad lower value of 5.79 percent.
3. The optimized parameter in maximizing the load is suggested on the results which are:
Unit load = 40 MW
Main steam temperature = 530 Mpa
Recommendations
1. Heat exchange between the component and the system is a significant part in the exergy analysis of the plant. Thus an exact approximation of the actual heat transfer would decently make the exergy analysis more accurate.
2. Moreover, the program for thermodynamic value determination can be made from other programming platform aside from excel in oder to create a faster generation of data and can be easily organize accordingly.
3. Lastly based on the results provided by the exergy analysis on the plant, it is recommended to formulate plans for improvements on plant components with high exergy loses especially the cold reheat pipe.
Acknowledgement
We would like to extend our heartfelt gratitude to the following persons: Dr. Leonel Pabilona, Dr. Eliseo Villanueva, PME and Dr. Sami Magomnang and the Mechanical Engineering Department Faculty of USTP for their never ending support.
References
- Bracco S, Silvia S (2010) Exergetic Optimization of Single Level Combined Gas Steam Power Plants Considering Different Objective Functions. Energy 35: 5365-5373.
- Evans RB (1980) Thermo economic isolation and essergy analysis. Energy 5: 805-822.
- El-Sayed YM, Evans RB (1970) Thermo economics and the design of heat systems. J Eng Power 92: 27-35.
- Gaggioli RA, El-Sayed YM (1987) A Critical Review of Second Law Costing Methods. Proceedings of the IV International Symposium on Second Law Analysis of Thermal Systems, 59-73. ASME, New York.
- Jamali JA (2017) Energy and Exergy Analyses of Boiler and its Parts of Lakhra Coal Power Plant (FBC) Jamshoro.
- Lazzaretto A, Tsatsaronis G (1997) On the Quest for Objective Equations in Exergy costing. In Proceedings of the ASME Advanced Energy Systems Devision; Ramalingam, ML, Lage JL, Mei VC, Chapman JN, Eds.; ASME: New York, NY, USA.
- Lei L, Yong L (2012) Exergy Analysis of 300MW Coal-Fired Power Plant. 23: 926-932.
- Lozano MA, Valero A (1993) Theory of the Exergetic Cost. Energy 18: 939-960.
- Mohagheghi M, Shayegan J (2009) Thermodynamic Optimization of Design Variables and Heat Exchangers Layout in HRSGs for CCGT, using Genetic Algorithm. Appl Therm Eng 29: 290-299.
- Tsatsaronis G (2007) Definitions and Nomenclature in Exergy Analysis and Exergoeconomics. Energy 32: 249-253.
- Woudstra N, Woudstra T, Pirone A, Van der Stelt T (2010) Thermodynamic Evaluation of Combined Cycle Plants. Energy Convers Manag 51: 1099-1110.
Citation: Belitor JNP, Pabilona L, Villanueva E (2018) A Performance Evaluation and Optimization of a 135-Mw Circulating Fluidized Bed (Cfb) Coal Based Thermal Power Plant Turbine Cycle Using Exergy Analysis. Innov Ener Res 7: 205. DOI: 10.4172/2576-1463.1000205
Copyright: © 2018 Belitor JNP, et al. This is an open-access article distributed under the terms of the Creative Commons Attribution License, which permits unrestricted use, distribution, and reproduction in any medium, provided the original author and source are credited.
Select your language of interest to view the total content in your interested language
Share This Article
Recommended Journals
Open Access Journals
Article Tools
Article Usage
- Total views: 8433
- [From(publication date): 0-2018 - Nov 05, 2025]
- Breakdown by view type
- HTML page views: 7389
- PDF downloads: 1044