Research Article Open Access
Analytical Expression of Concentration Profiles of Methanol and Pinene in Air Stream and Bio-Film Phase
Meena V and Rajendran L*
Department of Mathematics, The Madura College, Madurai, Tamilnadu, India
- *Corresponding Author:
- L. Rajendran
Department of Mathematics
The Madura College, Madurai-625011
Tamilnadu, India
Tel: +91 9442228951
E-mail: raj_sms@rediffmail.com
Received Date: November 12, 2014; Accepted Date: November 29, 2014; Published Date: December 04, 2014
Citation: Meena V, Rajendran L (2014) Analytical Expression of Concentration Profiles of Methanol and Pinene in Air Stream and Bio-Film Phase. J Anal Bioanal Tech 5:228. doi: 10.4172/2155-9872.1000228
Copyright: ©2014 Meena V, et al. This is an open-access article distributed under the terms of the Creative Commons Attribution License, which permits unrestricted use, distribution, and reproduction in any medium, provided the original author and source are credited.
Visit for more related articles at Journal of Analytical & Bioanalytical Techniques
Abstract
In this paper, mathematical models of biofilteration of mixtures of hydrophilic (methanol) and hydrophobic (α-pinene) volatile organic compounds (VOC’s) are discussed. This model is based on the system of diffusion equations containing a nonlinear term related to the Michaelis- Menten kinetic of the enzymatic reaction. The model describes the mass transfer in air-biofilm interface and chemical oxidation in the air stream phase. An approximate analytical expression of concentration profiles of methanol and α-pinene in air stream and bio-film phase have been derived using the Adomian decomposition method for all possible values of parameters. Furthermore, in this work, the numerical simulation of the problem is also reported using the Matlab program to investigate the dynamics of the system. Graphical results are presented and discussed quantitatively to illustrate the solution. Good agreement between the analytical and numerical data is noted.
Keywords
Methanol; Biofilters; VOC’s; Mathematical modeling; Non-linear differential equations; Adomian decomposition method
Introduction
Different cleaning technologies of gaseous effluents have been developed. Among these technologies, biological methods are increasingly applied for the treatment of air polluted by a wide variety of pollutants. Biofilteration is certainly the most commonly used biological gas treatment technology. Biofilteration involves naturally occurring microorganisms immobilized in the form of biofilm on a porous medium such as peat, soil, compost, synthetic substances or their combination. The medium provides to the microorganisms a hospitable environment in terms of oxygen, temperature, moisture, nutrients and pH. As the polluted airstream passes through the filterbed, pollutants are transferred from the vapor phase to the biofilm developing on the packing particles [1,2].
Recently Li et al. [3] as well as other research groups [4-10] have discussed that emission of VOCs into the atmosphere. Currently, biological control processes have become an established technology for air pollution control. This process has many advantages over traditional methods such as lower operating fees and less secondary pollution, which is rather true for the removal of readily biodegradable VOCs at low concentrations. So these processes are investigated largely and widely. Bioreactors for VOC removal can be classified as biofilters, bio scrubbers, biotrickling filters, or rotating drum biofilters, and choice of reactors should be based on many factors including the characteristics of the target VOC’s [11-15].
In order to control the emission of volatile organic compounds such as methanol and α-pinene from industries, biofilters are currently used instead of chemical complex absorption method [16-21]. Biofilters offer two major advantages for energy-starved countries, namely (i) Their power consumption is very low (1.8–2.5 Kwh/1000 m3) compared with other technologies and (ii) Their capital and operating costs are low. Sun et al. [22] described a mathematical model of dynamic physical and biological processes occurring in a packed trickle-bed air biofilters to analyze the relationship between biofilter performance and biomass accumulation in the reactor [22].
For the treatment of mixed VOCs, the presence of methanol and α-pinene in the air stream significantly influenced the removal of pollutants [23-25]. The removal capacity for methanol and α-pinene per unit volume of the bed decreased linearly with increasing loading rates of methanol and α-pinene. Some researchers have studied the biofitration of pure methanol [26-28] and pure α-pinene [29,30]. Moradi et al. [31-34] studied the removal behavior of p-nitrophenol and naphthalene by single-wall carbon nanotubes and calcite crystal surfaces by varying the parameters such as agitation time, initial concentration, and pH of the solution.
Recently, a few researchers have studied the biofitration of mixtures of pure methanol and pure α-pinene. Also researchers have tried to understand the interactions between these compounds, despite the fact that this situation exists in larger amount of air emissions. Madjid et al. [20] developed a mathematical model for methanol and α-pinene removal in VOC’s biofilteration. Kim et al. [35] developed the steady state solution of biofilter model only for the limiting cases (first order and zero order kinetics). Also, Kim et al. [36,37] obtained the nonsteady solution of biofilter model using numerical methods. To the best of our knowledge, this is the first study reporting an exact analytical expression of concentrations of substrate in the biofilm phase and air phase. The purpose of this communication is to derive approximate analytical expressions for the concentrations in both the phases using the Adomian decomposition method [38-43]. This analytical result will be useful for optimize the parameters on the performance of the biofilters in removing hydrophobic compounds such as α-pinene.
Mathematical Formulation of the Boundary Value Problem
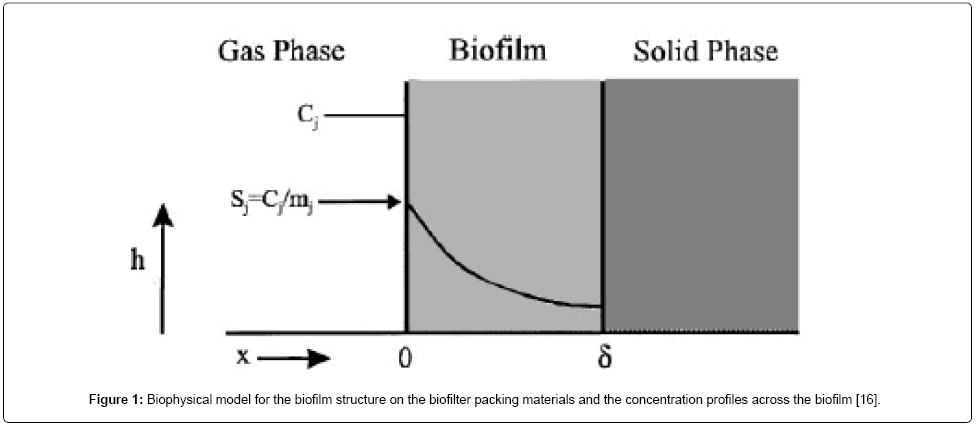
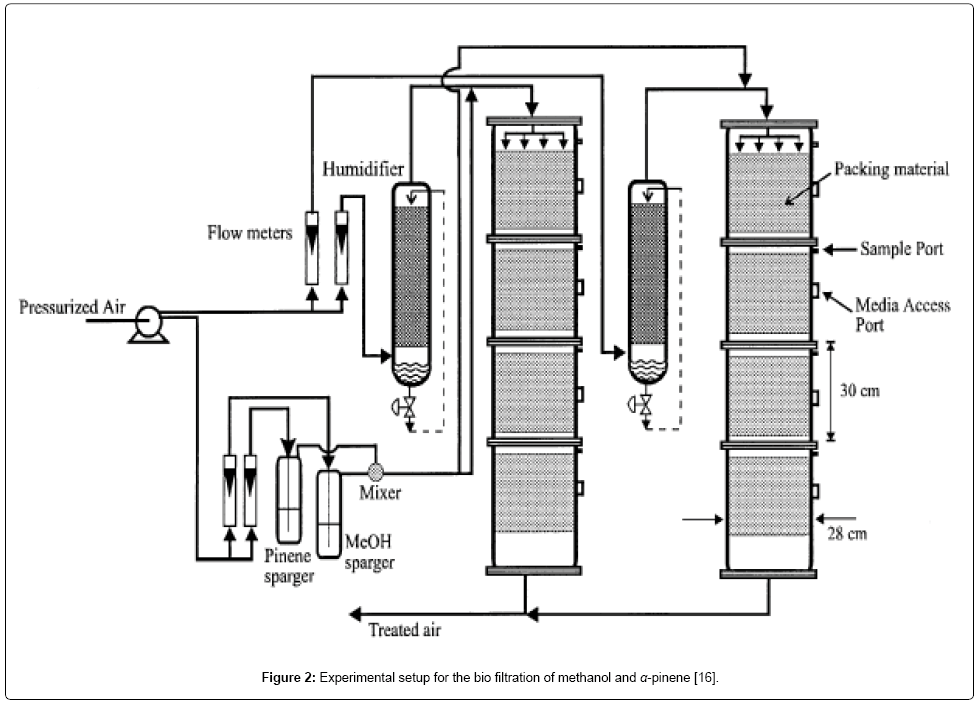
The mathematical model relating the biofiltration of hydrophilic and hydrophobic VOC’s is based on the biophysical model proposed by Madjid Mohseni et al. [20]. It includes two main processes of diffusion of the compounds methanol and α-pinene through the biofilm and their degradation in the biofilm. Figure 1 illustrates a schematic diagram of a single particle, in the biofilter, covered with a uniform layer of biofilm in which the simultaneous biodegradation of methanol and α-pinene takes place. The experimental setup for the biofilteration of this organic compound is given in Figure 2. The assumptions made in deriving the governing equations explaining the removal of mixed VOCs (methanol and α-pinene) in the biofilters are [20]: (i) there are no radial concentration gradients across the biofilter and the air flow follow the plug flow model. (ii) The biofilm grows on the exterior surface of the particles. Microorganisms do not grow in the interior pores of the particles and hence, no biodegradation occurs in the pores. (iii) The biofilm uniformly covers the packing media and its thickness is very small compared to the size of the particles; hence, rectangular geometry can be used. (iv) Methanol and α-pinene are the only substrates affecting the biodegradation rate. Oxygen is not a limiting substrate within the range of concentrations tested in this work [29]. (v) There is no gas-phase boundary layer at the air/ biofilm interface and hence, the gas-phase mass transfer can be neglected. (vi) The concentrations of methanol and α-pinene in the gas phase are related to their concentrations in the biofilm through air/biofilm partition coefficient. (vii) The overall biofilm density, is constant for any period of experiments run because the biomass accumulation in the column is slow and also because under steady-state conditions the decay rate can be assumed to be equal to the growth rate. (viii) The microbial communities degrading methanol and α-pinene are different. Evidence for the existence of separate methanol and α-pinene degrading populations has been supported by recent unsteady-state results on methanol and α-pinene mixtures reported by Mohseni and Allen (2000) [20]. Also, it allowed for the activity of α-pinene degraders to vary along the column depending on the concentration of methanol in the air stream.
Mass balance in the biofilm phase
The removal of methanol and α-pinene in the biofilm at steady state is described by the following system of nonlinear differential equations (Mohseni et al. [20]):
 (1)
(1)
 (2)
(2)
where Sm and Sp represent the concentration of methanol and α-pinene respectively. μmax, K, Y, De and x are maximum specific growth rate, half saturation constant, yield coefficient, effective diffusion coefficient and the distance respectively. Subscripts m and p represent methanol and α-pinene respectively. The dry cell density in the biofilm X represents the overall population of microorganisms that consist of methanol and α-pinene degraders. The coefficient for the effect of methanol on α-pinene biodegradation is defined as follows:
 (3)
(3)
where Ki and Cm are the inhibition constant and the concentration of methanol in the air phase respectively. The boundary conditions are
 (4)
(4)
 (5)
(5)
Mass balance in gas phase
The concentrations of methanol and α-pinene in the air, along the biofilter column, are described by
 (6)
(6)
 (7)
(7)
where Cm and Cp represents the concentration of methanol and α-pinene in the air phase. Ug, As, Dem, Dep and h are the superficial gas velocity, biofilm surface area, effective diffusivity of methanol, effective diffusivity of α-pinene and position along the height of the biofilters respectively. The corresponding initial conditions are
 (8)
(8)
where the subscript i represent the concentration of the VOCs at the biofilters inlet.
Dimensionless mass balance equation in the biofilm phase
The non-linear differential equations (1) and (2) are made dimensionless by defining the following dimensionless parameters:
 (9)
(9)
 (10)
(10)
Using the above dimensionless variables, Eqns. (1) and (2) reduces to the following dimensionless form:
 (11)
(11)
 (12)
(12)
The corresponding boundary conditions for the above Eqns. (11) and (12) can be expressed as
 (13)
(13)
 (14)
(14)
Dimensionless mass balance in the gas phase
The differential Eqns. (6) and (7) are made dimensionless by defining the following parameters:
 (15)
(15)
Using Eqn. (15), the Eqns. (6) and (7) can be expressed in the dimensionless form as follows:
 (16)
(16)
 (17)
(17)
The corresponding initial conditions for the above Eqns. (16) and (17) can be expressed as
 (18)
(18)
Analytical Expression for the Concentration of Methanol and α-pinene using the Adomian Decomposition Method (ADM)
In the recent years, many authors have been applied the ADM [40- 42] to various problems and demonstrated the efficiency of the ADM for handling non-linear and solving various chemistry and engineering problems. Using ADM (refer Appendix A in Supplementary information), we can obtain the concentration of methanol and α-pinene in the biofilm phase (See Appendix B in Supplementary information) as follows:
 (19)
(19)
 (20)
(20)
And also solving Eqns. (6-7) and (16-17) using analytical method, we can obtain the concentration of methanol and α-pinene in the air phase.
 (21)
(21)
 (22)
(22)
Analytical Expression for the Concentrations of Methanol and α-pinene for Unsaturated (First Order) Kinetics
Now we consider the limiting case where the substrate concentrations of methanol and α-pinene in biofilm phase are relatively low. In this case  .The Eqns. (1) and (2) now reduces to the following form.
 (23)
(23)
 (24)
(24)
The analytical expression for concentrations of methanol and α-pinene in the biofilm phase becomes
 (25)
(25)
 (26)
(26)
Using the Eqns. (6-7) and (25-26) we obtain the analytical expression of the concentrations of methanol and α-pinene in the air phase.
 (27)
(27)
 (28)
(28)
Analytical Solutions for the Concentrations of Methanol and α-pinene for Saturated (Zero Order) Kinetics
Next we consider the limiting case where the substrate concentrations of methanol and α-pinene in biofilm phase is relatively high. In this case  and Eqns. (1) and (2) reduce to the following form:
 (29)
(29)
 (30)
(30)
Then the analytical expressions for concentration of methanol and α-pinene in the biofilm phase are as follows:
 (31)
(31)
 (32)
(32)
Using the Eqns. (6-7) and (31-32), we obtain the analytical expression of the concentrations of methanol and α-pinene in the air phase.
 (33)
(33)
 (34)
(34)
Removal Ratio of Methanol and α-pinene
The percentage of the methanol removal ratio is
 (35)
(35)
where  are the initial (before treatment) and the final (after treatment) concentrations of methanol in the air phase, respectively. The percentage of the α-pinene removal ratio is
 (36)
(36)
where  are the initial (before treatment) and the final (after treatment) concentrations of α-pinene in the air phase respectively.
Numerical Simulation
In order to investigate the accuracy of the ADM solution with a finite number of terms, the system of differential equations was solved numerically. To show the efficiency of the present method, our analytical results are compared with numerical results graphically. The analytical solution of the concentrations of methanol and α-pinene in air phase and biofilm phase are compared with simulation results in Figures 3-6. Upon comparison, it gives a satisfactory agreement for all values of the dimensionless parameters  . The detailed Matlab program [44] for numerical simulation is provided in Appendix C and D in Supplementary information.
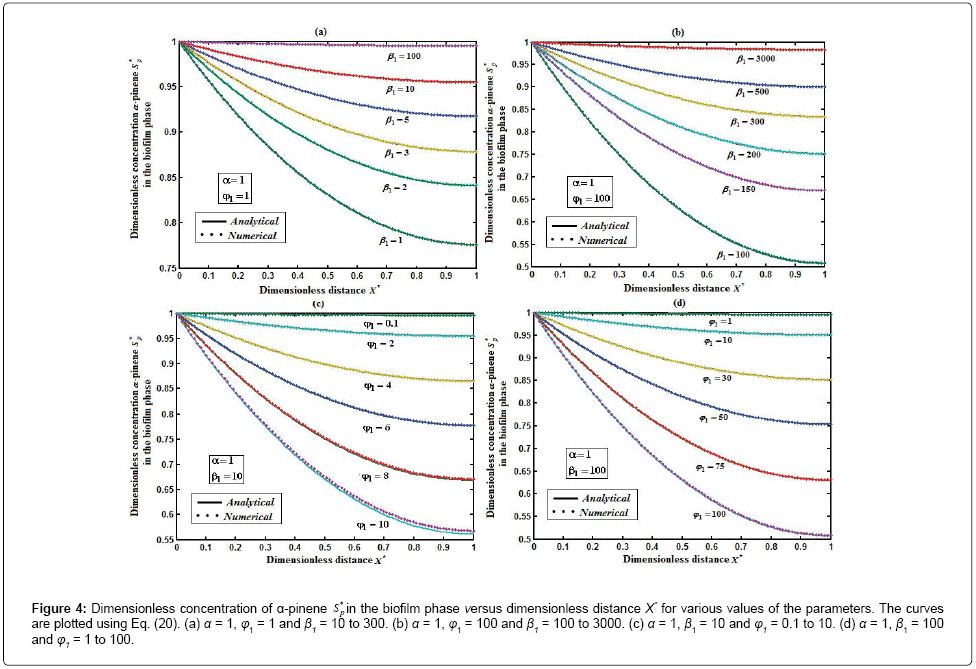
Figure 4: Dimensionless concentration of α-pinene S* p in the biofilm phase versus dimensionless distance X* for various values of the parameters. The curves are plotted using Eq. (20). (a) α = 1, φ1 = 1 and β1 10 to 300. (b) α = 1, φ1 = 100 and β1 = 100 to 3000. (c) α = 1, β1 = 10 and φ1 = 0.1 to 10. (d) α = 1, β1 = 100 and φ1 = 1 to 100.
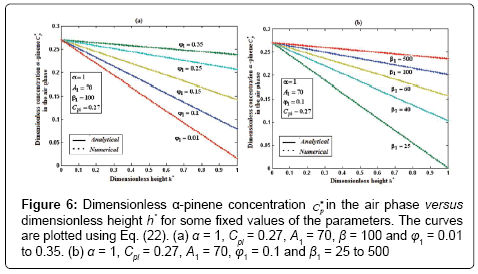
Figure 6: Dimensionless α-pinene concentration Cp* in the air phase versus dimensionless height h* for some fixed values of the parameters. The curves are plotted using Eq. (22). (a) α = 1, Cpi = 0.27, A1 = 70, β = 100 and φ1 = 0.01 to 0.35. (b) α = 1, Cpi = 0.27, A1 = 70, φ1 = 0.1 and β1 = 25 to 500
Results and Discussion
Eqns. (19- 22) represent the simple and new analytical expression of the concentrations of methanol and α-pinene in biofilm phase  and in the air phase
  . The concentrations of methanol and α-pinene in the biofilm phase and the air phase depend upon the parameters φ and β. The variation in the dimensionless variable φ can be achieved by varying either the thickness or dry cell density of the biofilm. The parameter β depends upon the initial concentration and half saturation constant.
Figure 3 represents the concentration of methanol  (x) in the biofilm phase versus dimensionless distance X* for different values of φ and β. From Figures 3a & 3b, it is inferred that the concentration of methanol increases when the initial concentration of methanol β increases for the fixed values of φ. For large value of dimensionless parameter β, the concentration of methanol remains constant. In Figures 3c & 3d, we present the concentration of methanol in the biofilm phase for various values of φ and for some fixed values of β. Maximum specific growth rate of methanol biodegradation φ decreases the concentration of methanol slowly and reaches the constant level. The minimum value of
  are 1-(φ / 2(1+β)) and 1-(α φ1 / 2(1+β1)) respectively.
Figure 4 exhibits the concentration of α-pinene  in the biofilm phase versus dimensionless distance X* for different values of α, φ1, and β1. From Figures 4a & 4b, it is inferred that the concentration of α-pinene increases when the initial concentration of α-pinene (β1) increases for the fixed values of dry cell density φ1. For large value of β1, the concentration of α-pinene is uniform. In Figures 4c & 4d, we show that the concentration of α-pinene in the biofilm phase for various values of cell density φ1 and for some fixed values of dimensionless parameter β1. From this figure, we conclude that the concentration of α-pinene
  increases when thickness of the film decreases. The concentration of α-pinene is equal to one
 when (φ / 2(1+β)) < 2.
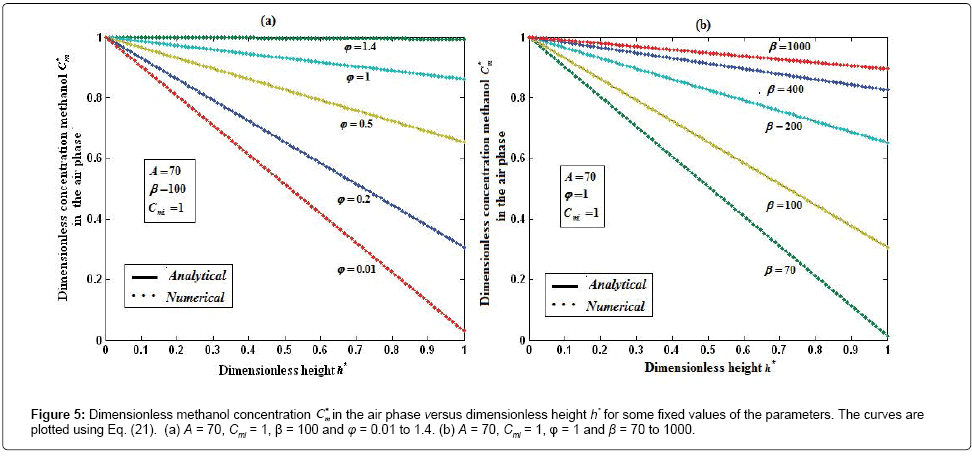
Figures 5a and 5b show the dimensionless concentration of methanol  versus dimensionless height h*. From Figure 5a, it is described that the concentration of methanol slowly reaches the constant when the biofilm thickness or φ increases. In Figure 5b, it is labeled that the concentration of methanol decreases when half saturation constant of methanol β decreases for the fixed value of other parameter.
Figures 6a & 6b demonstrate that the concentration of α-pinene  in the air phase versus dimensionless height h*. From Figure 6a, it is inferred that the concentration of α-pinene slowly reaches a constant level when the diffusion coefficient φ1 increases for the fixed value of other parameter. In Figure 6b, it is labeled that the concentration of α-pinene attains the steady state values when the initial concentration of α-pinene (β1) increases.
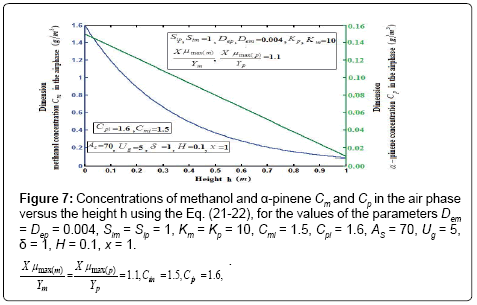
Figure 7 shows the profile of dimension concentration of methanol and α-pinene in the air phase versus height h for some fixed value of the parameters. From these figures it is inferred that the concentration linearly proportional to the height of the biofilter. And also the concentration of  and
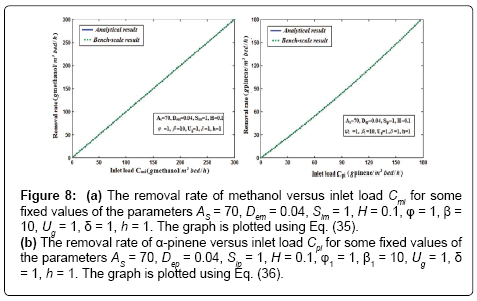
and  are decrease when the height of the biofilter increases. Figures 8a & 8b illustrates the removal ratio of methanol and α-pinene in the air phase. From this figure it is observed that the removal ratio is directly proportional to the inlet loading. Our analytical results are compared with the experimental result and excellent agreement is noted.
Figure 8: (a) The removal rate of methanol versus inlet load Cmi for some fixed values of the parameters AS = 70, Dem = 0.04, Sim = 1, H = 0.1, φ = 1, β= 10, Ug = 1, δ= 1, h = 1. The graph is plotted using Eq. (35). (b) The removal rate of α-pinene versus inlet load Cpi for some fixed values of the parameters AS = 70, Dep = 0.04, Sip = 1, H = 0.1, φ1 = 1, β1 = 10, Ug = 1, δ= 1, h = 1. The graph is plotted using Eq. (36).
Conclusion
In this paper, steady state nonlinear differential equations in biofiltration model have been solved analytically. Approximate analytical expressions pertaining to the concentrations of methanol and α-pinene in the biofilm phase for all the values of parameters are obtained using the Adomian decomposition method. The obtained concentrations of methanol and alpha-pirene were compared and validated using numerical simulation and experimental results. These results were in agreement, therefore providing a good understands of the system and the optimization of the parameters in the biofiltration model. The extension of the procedure for the removal of methane and α-pinion in the biofilm model for non- steady state condition seems possible.
Acknowledgements
This work was supported by the Department of Science and Technology (DST) (No.SB/S1/PC-50/2012). The authors are thankful to The Principal, The Madura College, Madurai and The Secretary, Madura College Board, Madurai for their encouragement. We thank the reviewers for their valuable comments to improve the quality of this manuscript.
References
- Ottengraf SPP (1987) biological system for waste gas elimination. Tibtech 5: 132-136.
- Wani AH, Branion RM, R Lau AK (1997) biofiltration: a promising and cost effective control technology for odours VOC’s and air toxic. J Environ Sol Healtha 32: 2027-2055.
- Li G, Hu H, Hao J, Zhang H (2002) [Use of biological activated carbon to degrade benzene and toluene in a biofilter]. Huan Jing Ke Xue 23: 13-18.
- Sun YM, Quan X, Yang FL, Chen JW, Lin QY, et al. (2005) Effect of organic gas components on biofitration and microbial density in biofilter. J Appl Environ Biol 11: 82-85.
- Yang CP, Suidan MT, Zhu XQ, Kim BJ (2003a) Comparison of single-layer and multi-layer rotating drum biofilters for VOC removal. Environ Prog 22: 87-94.
- Yang C, Suidan MT, Zhu X, Kim BJ (2003) Biomass accumulation patterns for removing volatile organic compounds in rotating drum biofilters. Water Sci Technol 48: 89-96.
- Yang CP, Suidan MT, Zhu XQ, Kim BJ (2004) Removal of a volatile organic compound in a hybrid rotating drum biofilter. J Environ Eng 130: 282-291.
- Yang C, Chen H, Zeng G, Yu G, Luo S (2010) Biomass accumulation and control strategies in gas biofiltration. Biotechnol Adv 28: 531-540.
- Madjid Mohseni Tonekaboni (1998) Biofitration of hydrophilic and hydrophobic volatile Organic compounds using wood-based media. Toronto: University of Toronto.
- Thakur Prabhat Kumar, Rahul, Mathur Anil Kumar, Balomajumder Chandrajit (2011) Biofiltration of volatile organic compounds (VOCs) – An overview. Research Journal of Chemical Sciences 1: 83-92.
- Yang CP (2004) Rotating drum biofitration. Department of Civil and Environmental Engineering, University of Cincinnati, Cincinnati, Ohio, USA.
- Yang CP, Chen H, Zeng GM, Qu W, Zhong YY, et al. (2006) Modeling biodegradation of toluene in rotating drum biofilter. Water Sci Technol 54: 137-144.
- Yang C, Chen H, Zeng G, Zhu X, Suidan MT (2008) Performance of rotating drum biofilter for volatile organic compound removal at high organic loading rates. J Environ Sci (China) 20: 285-290.
- Yang C, Suidan MT, Zhu X, Kim BJ, Zeng G (2008) Effect of gas empty bed contact time on performances of various types of rotating drum biofilters for removal of VOCs. Water Res 42: 3641-3650.
- Zhu X, Suidan MT, Pruden A, Yang C, Alonso C, et al. (2004) Effect of substrate Henry's constant on biofilter performance. J Air Waste Manag Assoc 54: 409-418.
- Mohseni MD, Allen G (2000) Biofiltration of mixtures of hydrophilic and hydrophobic volatile organic compounds. Chemical Engineering Science 55: 1545-1558.
- Ramirez-Lopez EM, Corona-Hernandez J, Avelar-Gonzalez FJ, Omil F, Thalasso F (2010) Biofiltration of methanol in an organic biofilter using peanut shells as medium. Bioresour Technol 101: 87-91.
- Eldon R, Rene M, Lopez E, María C, Veiga, et al. (2010) Steady- and transient-state operation of a two-stage bioreactor for the treatment of a gaseous mixture of hydrogen sulphide, methanol and a-pinene. Journal of Chemical Technology and Biotechnology 85: 336-348.
- Dhamwichukorn S, Kleinheinz GT, Bagley ST (2001) Themophilic biofiltration of methanol and alpha-pinene. J Ind Microbiol Biotechnol 26: 127-133.
- Mohseni M, Allen DG (2000) Biofiltration of mixtures of hydrophilic and hydrophobic volatile organic compounds. Chemical Engineering Science 55: 1545-1558.
- Siddiqui AM, Hameed M, Siddiqui BM, Ghori QK (2010) Use of Adomian decomposition Method in the study of parallel plate flow of a third grade fluid. Communications in Nonlinear Science and Numerical Simulation 15: 2388- 2399.
- Sun YM, Quan X, Yang FL, Chen JW, Lin QY, et al. (2005) Effect of organic gas components on biofitration and microbial density in biofilter. J Appl Environ Biol 11: 82-85.
- Rene ER, Jin Y, Veiga MC, Kennes C (2009) Two-stage gas-phase bioreactor for the combined removal of hydrogen sulphide, methanol and alpha-pinene. Environ Technol 30: 1261-1272.
- Mohseni M, GAllen D (2011) Transient performance of biofilters treating mixtures of hydrophilic and hydrophobic volatile organic compounds. Journal of the Air & Waste Management Association 49: 1434-1441.
- Berenjian A, Chan N, Malmiri HJ (2012) Volatile organic compounds removal methods: a review. American Journal of biochemistry and biotechnology 8: 220-229.
- Shareefdeen Z, Baltzis BC, Oh YS, Bartha R (1993) Biofiltration of methanol vapor. Biotechnol Bioeng 41: 512-524.
- Premkumar R, Krishnamohan N (2010) Removal of methanol from waste gas using biofiltration. Journal of Applied Sciences Research 6: 1898-1907.
- Arriaga S, Serrano MA, Barba AP (2012) Methanol vapor biofiltration coupled with continuous production of recombinant endochitinase Ech42 by Pichia Pastoris. Process Biochemistry 47: 2311–2316.
- Mohseni M (1998) Biofiltration of alpha-pinene and its application to the treatment of pulp and paper air emissions. Tappi journal 81: 205- 211.
- Cabeza IO, Lopez I, Giraldez RM, Stuetz MJ, Díaz, et al. (2013) Biofiltration of a-pinene vapours using municipal solid waste (MSW) – Pruning residues (P) composts as packing materials. Chemical Engineering Journal 233: 149-158.
- Moradi O, Yari M, Moaveni P, Norouzi M (2012) Removal of p-nitrophenol and naphthalene from petrochemical wastewater using SWCNTs and SWCNT-COOH surfaces, Fullerenes, Nanotubes and Carbon Nanostructures 20: 85-98.
- Moradi O (2011) The Removal of Ions by Functionalized Carbon Nanotube: Equilibrium, Isotherms and Thermodynamic Studies. Chem Biochem Eng Q 25: 229-240.
- Moradi O, Yari M, Zare K, Mirza B, Najafi F, et al. (2012) Carbon Nanotubes: Chemistry Principles and Reactions. Fullerenes, Nanotubes and Carbon Nanostructures 20: 138-151
- Moradi O (2013) Adsorption behavior of Basic Red 46 by Single Walled Carbon Nanotubes Surfaces. Fullerenes Nanotubes and Carbon Nanostructures 21: 286-301.
- Lim KH (2001) Waste air treatment with a biofilter for the case of excess adsorption capacity. Journal of chemical engineering of japan 34: 776-775.
- Lim KH, Lee E J (2003) Biofilter Modeling for Waste Air Treatment: Comparisons of Inherent Characteristics of Biofilter Models. Korean J Chem Eng 20: 315-327.
- Lee EJ, Lim KH (2012) A dynamic adsorption model for the gas-phase biofilters treating ethanol: Prediction and validation. Korean J Chem Eng 29: 1373-1381
- Biazar J, Babolian E, Islam R (2004) Solution of the system of ordinary differential equations by Adomian decomposition method. Applied Mathematics and Computation147: 713-719.
- Amani AR, Sadeghi J (2008) Adomian decomposition method and two coupled scalar fields. The International Conference Differential Geometry - Dynamical Systems Bucharest-Romania 2008; 11-18. Balkan Society of Geometers, Geometry Balkan Press.
- Adomian G Rach R (1993) Analytic solution of non-linear boundary-value problems in several dimensions by decomposition. Journal of Mathematical Analysis and Applications 174: 118-137.
- Duan JS, Rach R (2011) A new modification of the Adomian decomposition method for solving boundary value problems for higher order nonlinear differential equations. Applied Mathematics and Computation 218: 4090-4118.
- Rajendran L, Rasi M, Sunil Kumar (2014) Analytical expression for the concentration of nitric oxide removal in the gas and biofilm phase in a biotrickling filter (In press).
- Rajendran L, Sivasankari M (2013) Analytical expression of concentration of VOC and oxygen in steady state in biofiltration model. Applied Mathematics 314-325.
- MATLAB 6.1, The Math Works Inc., Natick, MA, 2000.
Relevant Topics
Recommended Journals
Article Tools
Article Usage
- Total views: 14793
- [From(publication date):
February-2015 - Aug 31, 2025] - Breakdown by view type
- HTML page views : 10153
- PDF downloads : 4640

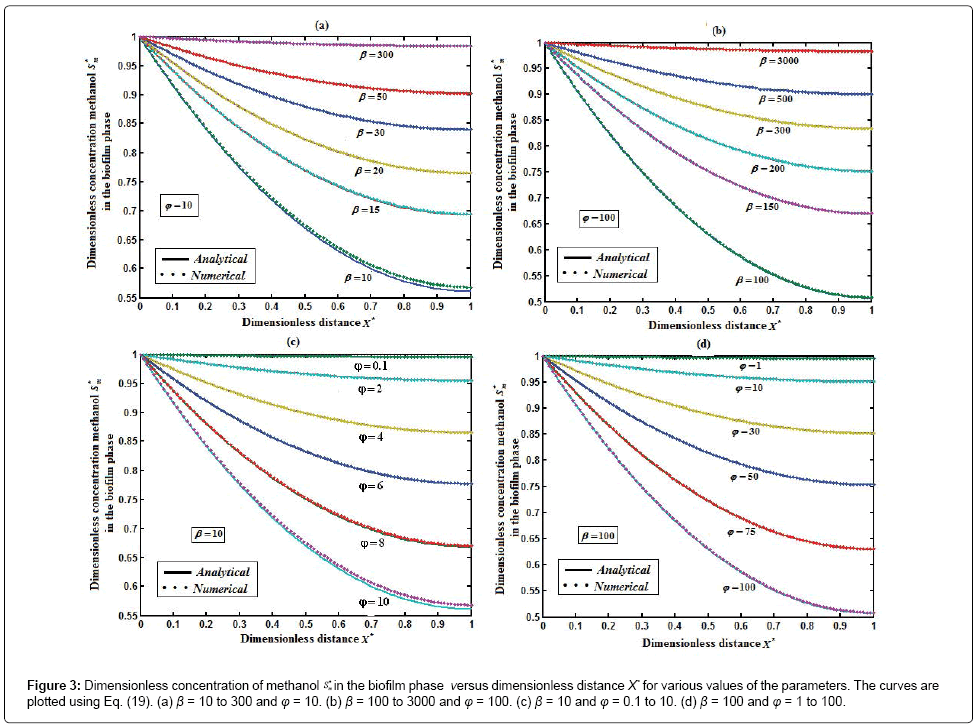
 in the biofilm phase versus dimensionless distance X* for various values of the parameters. The curves are plotted using Eq. (19). (a) β= 10 to 300 and φ = 10. (b) β= 100 to 3000 and φ = 100. (c) β= 10 and φ = 0.1 to 10. (d) β= 100 and φ = 1 to 100.