Research Article Open Access
Classification of Cannabis Cultivars Marketed in Canada for Medical Purposes by Quantification of Cannabinoids and Terpenes Using HPLC-DAD and GC-MS
Dan Jin1,2, Shengxi Jin2*, Yang Yu2, Colin Lee2 and Jie Chen1,3
1Biomedical Engineering Department, University of Alberta, Edmonton, Alberta, Canada
2Labs-Mart Inc., Edmonton, Alberta, Canada
3Electrical and Computer Engineering Department, University of Alberta, Edmonton, Alberta, Canada
- *Corresponding Author:
- Jie Chen
Biomedical Engineering Department, University of Alberta, Edmonton, Alberta, Canada
Tel: +17804929820
E-mail: jc65@ualberta.ca
Received date: February 10, 2017; Accepted date: February 17, 2017; Published date: February 20, 2017
Citation: Jin D, Jin S, Yu Y, Lee C, Chen J (2017) Classification of Cannabis Cultivars Marketed in Canada for Medical Purposes by Quantification of Cannabinoids and Terpenes Using HPLC-DAD and GC-MS. J Anal Bioanal Tech 8:349. doi: 10.4172/2155-9872.1000349
Copyright: © 2017 Jin D, et al. This is an open-access article distributed under the terms of the Creative Commons Attribution License, which permits unrestricted use, distribution, and reproduction in any medium, provided the original author and source are credited.
Visit for more related articles at Journal of Analytical & Bioanalytical Techniques
Abstract
For over a century, research on cannabis has been hampered by its legal status as a narcotic. The recent legalization of cannabis for medical purposes in North America requires rigorous standardization of its phytochemical composition in the interest of consumer safety and medicinal efficacy. To utilize medicinal cannabis as a predictable medicine, it is crucial to classify hundreds of cultivars with respect to dozens of therapeutic cannabinoids and terpenes, as opposed to the current industrial or forensic classifications that only consider the primary cannabinoids tetrahydrocannabinol (THC) and cannabidiol (CBD). We have recently developed and validated analytical methods using high-pressure liquid chromatography (HPLC-DAD) to quantify cannabinoids and gas chromatography with mass spectroscopy (GC-MS) to quantify terpenes in cannabis raw material currently marketed in Canada. We classified 32 cannabis samples from two licensed producers into four clusters based on the content of 10 cannabinoids and 14 terpenes. The classification results were confirmed by cluster analysis and principal component analysis in tandem, which were distinct from those using only THC and CBD. Cannabis classification using a full spectrum of compounds will more closely meet the practical needs of cannabis applications in clinical research, insdustrial production, and patients’ self-production in Canada. As such, this holistic classification methodology will contribute to the standardization of commercially-available cannabis cultivars in support of a continuously growing market.
Keywords
Cannabis; Classification; Cannabinoids; Terpenes; HPLC-DAD; GC-MS; Cluster analysis; Principal component analysis
Introduction
As of 2014, 545 compounds have been identified in cannabis, among which there are 104 cannabinoids [1]. Cannabinoids have been indicated for sixteen potential therapeutic uses, ranging from pain management to neurological disorders [2]. Although the research focus is mainly on psychoactive THC, other non-psychoactive cannabinoids, such as CBD, cannabigerol (CBG), and cannabichomene (CBC), also have broad therapeutic potential without the negative effects of THC and may enhance the beneficial effects of THC [3]. Apart from cannabinoids, a significant number of compounds produced in cannabis are terpenes, which are responsible for cannabis’s distinctive odour [4]. Although clinical studies are still nascent, terpenes are receiving increasing attention for their synergistic interactions with cannabinoids in the treatment of pain, inflammation, depression, anxiety, addiction, epilepsy, cancer, and infections [3]. Cannabis, as an herbal medicine, is suggested to be greater than the sum of its individual components [3].
Cannabis for medical purposes is becoming a global trend and is especially popular in North America. Canada and an increasing number of states in the US have legalized medical cannabis. As of January 2017, 28 states and Washington D.C. have legalized the medical use of cannabis [5] In Canada, 38 licensed producers are authorized to produce and sell dried marijuana, fresh marijuana, cannabis oil, or starting materials to eligible persons in Canada [6]. Effective as of August 2016, the new Access to Cannabis for Medical Purposes Regulations (ACMPR) permits self-production of a limited amount of cannabis for medical purposes as a supplement to purchasing cannabis from licensed producers [7]. However, due to the highly varied and complex composition of active components in cannabis, the suitability of each cultivar for treating particular conditions requires further investigation. In addition, a long history of hybridization has resulted in hundreds of cannabis cultivars, among which many have similar chemical compositions. In this respect, cannabis cultivar classification is a foundational requirement for standardizing and controlling the quality of cannabis for medical applications.
Currently, there are three classification systems for cannabis. The first, a botanical perspective, attempts to classify cannabis into different species or subspecies based on appearance, THC content, and geographical origins (gene pools) [8-13]. The second, a chemotaxonomic perspective, describes five chemotypes (chemical phenotypes) based on the ratio of two major cannabinoids THC and CBD, which is decided by their corresponding allelic loci [14-21]. Recently, a third perspective seeks to categorize cultivars based on both cannabinoids and terpenes for drug standardization and clinical research purposes [22,23]. However, there is no currently available systematic classification covering the majority of commercially available cultivars. In this project, we aim to classify a portion of cannabis cultivars currently marketed in Canada based on the content of dozens of potentially therapeutic cannabinoids and terpenes. Cannabis cultivar classification will be the foundation for industrial production, clinical research, and informative guidance for individual growers in Canada.
In this work, we used a HPLC method recommended by American Herbal Pharmacopoeia (AHP) [24] to quantify 10 cannabinoids (Cannabidiolic Acid (CBDA), Cannabigerolic Acid (CBGA), CBG, CBD, Tetrahydrocannabivarin (THCV), Cannabinol (CBN), Tetrahydrocannabinolic Acid (THCA), Δ9-THC, Δ8-THC, CBC). We also developed a GC-MS method to quantify 14 terpenes (α-Pinene, β-Myrcene, β-Pinene, Δ3-Carene, Limonene, p-Cymene, Eucalptol, Linalool, Fenchone, Fenchol, Borneol, α-Terpineol, Pulegone, β-Caryophyllene) that have been indicated for pharmacological activities [3,25,26]. We validated these methods for specificity (selectivity), linearity, accuracy, precision (repeatability and intermediate precision), limit of detection (LOD), and limit of quantification (LOQ). We then applied these two quantification methods on 32 medical cannabis samples provided by licensed producers, followed by two classification methods. Hierarchical cluster analysis was first carried out and principal component analysis (PCA) was applied to confirm whether the cultivars in the cluster analysis would also be grouped together by PCA. PCA also revealed the compounds that were responsible in grouping cultivars between clusters. These classification results may have value for clinical researchers in the discrimination and selection of cultivars. They may also assist licensed producers in optimizing cultivar selection with regards to medicinal effects.
Materials and Methods
Sample collection
A total of 32 cannabis samples (dried flower buds) were collected from two licensed producers in Canada. Sample names were provided by the licensed producers and different names may not necessarily represent distinct cultivars. Samples arrived in sealed plastic bags and were stored in a dry and cool storage facility prior to analysis. All samples were pulverized into fine powder. Approximately 1 g of each sample was used for extraction.
Solvents and chemicals
All 10 cannabinoid standards except CBDA were purchased from Cayman Chemical Co. (Ann Arbor, Michigan 48108 USA). CBDA and the internal standard (ISTD) diazepam were purchased from Sigma- Aldrich Company (Oakville, Ontario, Canada). All standards were analytical grade and were provided as 1 mg/mL solution in methanol or acetonitrile.
All 14 terpenes standards and ISTD tridecane were purchased from Sigma-Aldrich Company (Oakville, Ontario, Canada). All standards were analytical grade and came as a pure liquid or white powder.
Hexanes, chloroform, and acetonitrile were purchased from Fisher Scientific Company (Ottawa, Ontario, Canada). Ammonium formate was purchased from Sigma-Aldrich Company (Oakville, Ontario, Canada). Methanol was purchased from EMD Millipore (Etobicoke, Ontario, Canada). Formic acid was purchased from Caledon Laboratory Chemicals (Halton Hills, Ontario, Canada). Water was HPLC grade, produced in-house using a Millipore filtration system which purified water to 18 mΩ resistivity.
HPLC systems and cannabinoids assay
The HPLC-DAD system used in this study was a modular Agilent 1100 Series comprised of the following components: Solvent Degasser (G1322A), Bin Pump (G1312A), WPALS (G1367A), Column. Compartment (G1316A), Hewlett Packard 1100 Series PhotoDiode- Array Detector (DAD) (G1315A), and Agilent Z0RBAX RX-C18 (4.6 mm × 150 mm, 3.5 μm) Column.
The stock standard solution was prepared by adding 1 mL of 1 mg/mL THCA, CBDA, CBGA, Δ9-THC, Δ8-THC, CBD, CBG, CBC, THCV, and CBN standards into a 10 mL volumetric flask. This mixed standard solution was dried under a gentle stream of nitrogen, and then a 1:1 ratio of water and acetonitrile spiked with 20 ppm diazepam as ISTD was added to volume. The resulting concentration of each cannabinoid in the stock solution was 100 ppm (μg/mL). 100 ppm of the mixed standard solution was further diluted to create calibration standard solutions with cannabinoid concentrations of 50 ppm, 25 ppm, 5 ppm, 1 ppm, and 0.5 ppm.
The analytical method was adapted from a published method in AHP monograph (revision 2014) [27] by modifying the dilution factor. In the original method, 200 mg of sample was extracted with methanol/ chloroform (9/1, v/v) and the extract was diluted by a factor of 10. In this method, we diluted the extract by a factor of 40 in two steps. A 100 μL aliquot of the filtrate of the extract was first diluted to a volume of 1 mL. Then, a 30 μL aliquot of the diluted extract was evaporated under a gentle stream of nitrogen. The residue was then dissolved in 120 μL of a mixture of water/acetonitrile (5/5, v/v) with 20 ppm ISTD. Finally, 100 μL of the solution was transferred into an amber vial with a spring glass insert for HPLC analysis. Quantifications of cannabinoids were achieved by comparing the ratio of sample/ISTD with the ratio of the external standard (ESTD)/ISTD at the target concentration. Cannabinoid analysis results were reported as mass fraction (w/w %).
GC-MS systems and terpenes assay
The GC-MS system used in this study was an Agilent 7890A GC system comprised of the following components: Agilent 7890A GC (G3440A), Agilent 5975C inert MSD with Triple-Axis Detector, K`Prime GC Sample Injector (MXY 02-01B), and a GC Column (Phenomenex, Zebron, ZB-624 30 m × 0.25 mm ID, 1.40 μm film thickness). A temperature gradient program was used for the separation of terpenes (Table 1). The injector temperature was 250°C. Injection volume was 2 μL. Split ratio is 20:1. The carrier gas (helium) flow rate was 1.2 mL/min. Run time was 20 minutes. SIM was carried out to quantify terpenes.
| Rate (°C/min) | Value(°C) | Hold Time (min) | Run Time (min) | |
|---|---|---|---|---|
| (Initial) | 50 | 0.1 | 0.1 | |
| Ramp 1 | 25 | 100 | 0.2 | 2.3 |
| Ramp 2 | 20 | 120 | 0.2 | 3.5 |
| Ramp 3 | 5 | 160 | 0.2 | 11.7 |
| Ramp 4 | 20 | 200 | 0.1 | 13.8 |
| Ramp 5 | 50 | 260 | 5 | 20.0 |
Table 1: GC temperature gradient program parameters.
ISTD was prepared by weighing 216.8 mg of tridecane and dissolving it into 1 L of extraction solvent, resulting in an ISTD concentration of 216.8 ppm. A stock standard solution of each terpene was prepared separately by weighing approximately 200 mg of each terpene and dissolving it into 10 mL of ISTD-spiked extraction solvent. A 500 ppm mixed working standard was prepared by taking a calculated volume of each of the stock standards and adding extraction solvent to a final volume of 100 mL. The 500 ppm standard solution was further diluted to create calibration standards with terpenes concentrations of 250 ppm, 100 ppm, 50 ppm, 25 ppm, 5 ppm, and 1 ppm, respectively.
About 500 mg dried sample was extracted with 5.0 mL 1:1 ratio of hexane and ethyl acetate and put on shakers for 20 minutes. After being centrifuged at 10,000 rpm for 5 minutes, a 100 μL of the supernatant was transferred into an amber vial with a spring glass insert for GC analysis. Fifteen compounds (including the ISTD tridecane) were divided into 12 groups in the SIM method, with each group assigned with corresponding quantifier and qualifiers. Quantifications of terpenes were achieved by comparing the ratio of sample/ISTD with the ratio of ESTD/ISTD at the target concentration. Terpene analysis results were reported as w/w%.
Method validation
Both HPLC and GC-MS methods were validated for specificity (selectivity), linearity, accuracy, precision (repeatability and intermediate precision), LOD and LOQ as instructed by the ICH Harmonised Tripartite Guideline for Validation of Analytical Procedures Q2 (R1) [28]. Specificity (selectivity) was determined by injecting a solvent blank to confirm that there were no false signal peaks at the targeted retention time. Each cannabinoid and terpene standard was individually injected to determine retention times. A linear regression (calibration) curve for each compound was constructed by plotting the peak-area ratio of STD/ISTD (y) against concentration (x, ppm). The slope, y-intercept and coefficient of determination were calculated from the standard curves.
To test accuracy (recovery), spiked samples were prepared by adding three levels of known concentrations of standards into three replicates of a known sample. Each spiked sample was injected three times (N=3). The spiked levels ranged from low, medium, to high concentrations of each analyte, as the contents of cannabinoids and terpenes vary significantly in the natural samples. Precision includes repeatability and intermediate precision, otherwise referred to as intraday precision and interday precision. Although ICH requires sampling from authentic samples, it was impractical in this case to obtain blank matrices completely free from cannabinoids and terpenes. In addition, contents of these compounds vary significantly in samples and some may below the LOQs. However, it was also impractical to spike every standard into samples to bring each analyte above the LOQ. In this work, we chose to spike mixed cannabinoid standard or mixed terpene standard into a solvent blank as blank matrices. Repeatability was determined by assaying a spiked blank matrices 12 times as intraday precision. Twelve data points (N=12) were used to calculate the relative standard deviation (%RSD) of the set. To obtain inter-day precision, six assays were repeated on two different days. Both intra-day and inter-day data were calculated together to determine intermediate precision (N=12).
Statistical analysis was applied to the linear regression line in order to determine the standard deviation (SD) and slope (S). From these values, LOD and LOQ were calculated by using the following equations:
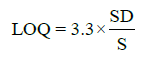 (1)
(1)
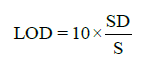 (2)
(2)
Quantification and classification
Each sample was quantified for both cannabinoid and terpene content, which were then subjected to cluster analysis and PCA in order to enable cannabis cultivar classification. The software used for both analysis was JMP® 13.0.0. Observations (cultivars in this case) were grouped using hierarchical clustering. The distances between clusters were calculated using Ward’s minimum variance equation [2]:
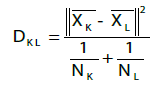 (3)
(3)
where
DKL is Ward’s distance between clusters K and L;
K and L subscripts are positive integers up to the number of observations;
xK is the mean vector for the Kth cluster CK;
xL is the mean vector for the Lth cluster CL;
||x|| is the square root of the sum of the squares of the elements of x (the Euclidean length of the vector x);
NK is the number of observations in CK; and
NL is the number of observations in CL.
PCA is a commonly used multivariate technique to detect patterns in high-dimensional data. PCA can also identify the critical compounds for discriminating cannabis cultivars, which is useful in choosing cultivars with specific abundant bioactive components. PCA projects the original chemical data into a new coordinate system, which is produced by calculating eigenvalues and eigenvectors from the covariance matrix of the original matrix. The eigenvectors (principal components, shortened as PCs) are orthogonal to each other and are ordered by significance: the first PC explains the most variance and the last PC explains the least [29]. For better visual interpretation of the data, the first two or three PCs are reserved, resulting in a lossy data compression process.
Results and Discussion
Method validation for cannabinoids (HPLC)
A solvent blank was injected and no false signal peak was observed at the targeted retention time area. Five levels of cannabinoid standard solutions were injected. Specificity was demonstrated by well-separated peaks (Figure 1).

Figure 1: HPLC chromatograms for 10 cannabinoids at 50 ppm.
Regression (calibration) curves were visibly linear (Figure 2). Additionally, the correlation coefficients for all 10 cannabinoids ranged from 0.9993 to 1.0000 (Table 2). The %RSD of accuracy (recovery) ranged from 91.3% to 104.4%. The precision (%RSD) for all compounds were less than 1.39%. Inter-day injection precisions were found to be less than 1.45%. The method was precise in terms of repeatability and intermediate precision. Cannabinoids’ LODs ranged from 0.07 to 0.99 ppm and LOQs ranged from 0.21 to 3.00 ppm (Table 2).

Figure 2: Calibration Curve of CBDA.
| S. No | Cannabinoids | Coefficient of determination (R2) | Repeatability RSD% (N=12) |
Intermediate Precision RSD% (N=12) |
Recovery% (N=3) | LOD (ppm) | LOQ (ppm) | ||
|---|---|---|---|---|---|---|---|---|---|
| Low Conc 5 ppm |
Medium Conc 10 ppm |
High Conc 25 ppm |
|||||||
| 1 | CBDA | 0.9995 | 0.31 | 0.76 | 99.0 | 98.4 | 96.7 | 0.81 | 2.46 |
| 2 | CBGA | 0.9993 | 0.57 | 0.56 | 99.2 | 93.1 | 92.3 | 0.99 | 3.00 |
| 3 | CBG | 0.9997 | 0.53 | 1.14 | 97.4 | 96.2 | 94.1 | 0.60 | 1.82 |
| 4 | CBD | 0.9997 | 0.48 | 1.16 | 98.0 | 98.2 | 95.6 | 0.59 | 1.80 |
| 5 | THCV | 1.0000 | 0.60 | 0.91 | 95.1 | 98.4 | 94.4 | 0.09 | 0.28 |
| 6 | CBN | 0.9998 | 0.48 | 1.44 | 91.3 | 93.7 | 93.2 | 0.48 | 1.44 |
| 7 | THCA | 0.9995 | 0.38 | 0.51 | 99.0 | 97.9 | 98.1 | 0.77 | 2.34 |
| 8 | Δ9-THC | 0.9999 | 1.22 | 1.03 | 104.4 | 99.4 | 97.3 | 0.40 | 1.21 |
| 9 | Δ8-THC | 0.9996 | 0.52 | 1.10 | 102.7 | 100.0 | 97.5 | 0.68 | 2.07 |
| 10 | CBC | 1.0000 | 1.39 | 1.45 | 94.5 | 93.8 | 93.9 | 0.07 | 0.21 |
Table 2: Method Validation results for cannabinoids (HPLC).
Method validation for terpenes (GC-MS)
A solvent blank was injected and no junk peak was observed at the targeted retention time area. Six concentrations of terpene standards were injected. Specificity was demonstrated by well-separated peaks (Figure 3).

Figure 3: GC-MS chromatograms for 14 terpenes at 50 ppm.
Regression (calibration) curves were visibly linear (Figure 4). Additionally, the correlation coefficients for all 14 terpenes ranged from 0.9993 to 1.0000 (Table 3). The %RSD of accuracy (recovery) ranged from 93.0 to 104.8%. The method precisions (%RSD) for all compounds were less than 2.1%. Inter-day injection precisions were found to be less than 1.34%. The method was precise in terms of repeatability and intermediate precision. For all terpenes, LODs ranged from 0.82 to 3.69 ppm, and LOQs ranged from 2.47 to 11.2 ppm (Table 3) respectively.

Figure 4: Calibration curve of a-pinene.
| S. No | Terpenes | Coefficient of determination (R2) | Repeatability RSD% (N=12) |
Intermediate Precision RSD% (N=12) |
Recovery% (N=3) | LOD (ppm) | LOQ (ppm) | ||
|---|---|---|---|---|---|---|---|---|---|
| Low Conc. 50 ppm |
Medium Conc. 150 ppm |
High Conc. 250 ppm |
|||||||
| 1 | α-Pinene | 0.9993 | 2.1 | 0.87 | 93.0 | 94.4 | 96.3 | 3.69 | 11.2 |
| 2 | β-Myrcene | 0.9994 | 1.3 | 0.45 | 98.8 | 97.8 | 95.4 | 3.52 | 10.7 |
| 3 | β-Pinene | 0.9993 | 1.3 | 0.88 | 94.0 | 97.1 | 93.6 | 3.70 | 11.2 |
| 4 | Δ3-Carene | 0.9995 | 1.2 | 0.81 | 94.2 | 98.6 | 94.6 | 3.21 | 9.72 |
| 5 | Limonene | 0.9998 | 1.5 | 0.39 | 97.2 | 99.9 | 96.5 | 2.20 | 6.67 |
| 6 | p-Cymene | 0.9996 | 1.7 | 1.34 | 97.3 | 100.7 | 95.4 | 2.82 | 8.55 |
| 7 | Eucalptol | 0.9997 | 2.0 | 0.98 | 96.6 | 100.2 | 94.6 | 2.36 | 7.14 |
| 8 | Linalool | 0.9999 | 1.9 | 0.37 | 99.1 | 102.1 | 98.0 | 1.58 | 2.99 |
| 9 | Fenchone | 1.0000 | 1.9 | 0.47 | 96.9 | 101.4 | 97.4 | 0.99 | 2.99 |
| 10 | Fenchol | 0.9999 | 1.7 | 0.60 | 98.2 | 103.4 | 100.8 | 1.28 | 3.86 |
| 11 | Borneol | 0.9997 | 1.5 | 1.34 | 98.5 | 104.8 | 100.1 | 2.62 | 7.94 |
| 12 | α-Terpineol | 1.0000 | 1.5 | 0.50 | 98.6 | 103.5 | 100.4 | 0.82 | 2.47 |
| 13 | Pulegone | 0.9999 | 1.7 | 0.71 | 97.0 | 103.8 | 97.9 | 1.73 | 5.24 |
| 14 | β-Caryophyllene | 0.9999 | 1.5 | 0.49 | 100.0 | 102.7 | 102.0 | 1.30 | 3.95 |
Table 3: Method validation results for terpenes (GC-MS).
Quantification of cannabinoids and terpenes
In this work, each cultivar was labelled with an identifier for convenience (Table 4). Quantitative data for cannabinoids and terpenes are listed in Tables 4 and 5, respectively. Hierarchical cluster analysis was applied first and PCA was used to confirm the grouping results.
| File ID | Cultivar | CBDA | CBGA | CBG | CBD | THCV | CBN | THCA | Δ9-THC | Δ8-THC | CBC | T-THC | T-CBD |
|---|---|---|---|---|---|---|---|---|---|---|---|---|---|
| LM1 | AD | 0.03 | 0.11 | NQ | NQ | NQ | 0.05 | 4.49 | 0.18 | NQ | NQ | 4.67 | 0.03 |
| LM2 | ADEB | *NQ | 0.11 | NQ | NQ | NQ | 0.04 | 3.03 | 0.12 | NQ | NQ | 3.14 | NQ |
| LM3 | ATH | 0.88 | 0.06 | 0.05 | 0.10 | 0.06 | 0.04 | 1.01 | 0.16 | 0.05 | NQ | 1.17 | 0.97 |
| LM4 | BW | 0.03 | 0.09 | 0.29 | NQ | NQ | 0.04 | 5.72 | 0.11 | 0.08 | 0.03 | 5.84 | 0.03 |
| LM5 | BD | 0.03 | 0.08 | 0.02 | NQ | NQ | 0.03 | 4.44 | 0.08 | NQ | NQ | 4.52 | 0.03 |
| LM6 | BDEB | 0.03 | 0.11 | 0.04 | NQ | NQ | 0.04 | 5.47 | 0.10 | NQ | NQ | 5.57 | 0.03 |
| LM7 | CT | 5.22 | 0.17 | NQ | 0.30 | 0.34 | 0.09 | 0.18 | 0.05 | 0.06 | 0.05 | 0.24 | 5.52 |
| LM8 | CT+LSD | 1.57 | 0.12 | NQ | 0.10 | 0.09 | 0.06 | 1.62 | 0.15 | 0.09 | NQ | 1.77 | 1.67 |
| LM9 | CC | 1.97 | 0.07 | 0.03 | 0.14 | 0.25 | 0.06 | 1.25 | 0.19 | 0.05 | NQ | 1.44 | 2.11 |
| LM10 | DQ | 0.03 | 0.20 | 0.05 | NQ | NQ | 0.04 | 3.71 | 0.07 | 0.08 | NQ | 3.79 | 0.03 |
| LM11 | EMD | NQ | 0.06 | NQ | NQ | NQ | 0.03 | 2.57 | 0.07 | NQ | NQ | 2.64 | NQ |
| LM12 | EMD#1 | 0.03 | 0.10 | 0.04 | NQ | NQ | 0.05 | 4.34 | 0.15 | NQ | NQ | 4.50 | 0.03 |
| LM13 | EMD#2 | NQ | 0.05 | 0.05 | NQ | NQ | 0.04 | 2.48 | 0.13 | NQ | NQ | 2.61 | NQ |
| LM14 | ER | 0.03 | 0.10 | NQ | NQ | NQ | 0.05 | 2.54 | 0.28 | NQ | NQ | 2.82 | 0.03 |
| LM15 | GLA | 0.03 | 0.19 | 0.03 | NQ | NQ | 0.04 | 6.11 | 0.25 | NQ | NQ | 6.36 | 0.03 |
| LM16 | GLA#1 | 0.03 | 0.14 | NQ | NQ | NQ | 0.04 | 4.22 | 0.23 | 0.10 | NQ | 4.45 | 0.03 |
| LM17 | GLA#2 | 0.03 | 0.10 | NQ | NQ | NQ | 0.05 | 3.51 | 0.26 | NQ | NQ | 3.77 | 0.03 |
| LM18 | KOG | 0.04 | 0.23 | 0.06 | NQ | NQ | 0.05 | 6.60 | 0.15 | 0.17 | 0.05 | 6.75 | 0.04 |
| LM19 | KOGEB | 0.04 | 0.27 | 0.06 | NQ | NQ | 0.05 | 6.88 | 0.13 | 0.21 | 0.05 | 7.01 | 0.04 |
| LM20 | KOGEBE | 0.04 | 0.29 | 0.06 | NQ | NQ | 0.05 | 6.95 | 0.14 | 0.18 | 0.05 | 7.08 | 0.04 |
| LM21 | LAA | 0.04 | 0.05 | NQ | NQ | NQ | 0.08 | 5.27 | 0.38 | 0.17 | 0.05 | 5.65 | 0.04 |
| LM22 | OGK | 0.03 | 0.10 | 0.08 | NQ | NQ | 0.05 | 4.96 | 0.11 | NQ | NQ | 5.07 | 0.03 |
| LM23 | PLA | 0.03 | 0.15 | 0.02 | NQ | NQ | 0.04 | 3.63 | 0.05 | 0.14 | NQ | 3.68 | 0.03 |
| LM24 | PLA#1 | 0.03 | 0.15 | NQ | NQ | NQ | 0.05 | 4.26 | 0.14 | 0.13 | NQ | 4.40 | 0.03 |
| LM25 | PLA#2 | NQ | 0.04 | NQ | NQ | NQ | 0.05 | 2.78 | 0.13 | 0.16 | NQ | 2.91 | NQ |
| LM26 | PLA#3 | NQ | 0.03 | NQ | NQ | NQ | 0.04 | 2.42 | 0.09 | 0.08 | NQ | 2.51 | NQ |
| LM27 | QK | 0.04 | 0.14 | 0.09 | NQ | NQ | 0.04 | 5.85 | 0.11 | 0.10 | 0.02 | 5.97 | 0.04 |
| LM28 | SD | 0.04 | 0.47 | 0.05 | 0.06 | NQ | 0.05 | 6.07 | 0.59 | 0.15 | 0.03 | 6.66 | 0.10 |
| LM29 | SDEB | 0.04 | 0.47 | 0.05 | NQ | NQ | 0.05 | 5.61 | 0.59 | 0.24 | NQ | 6.20 | 0.04 |
| LM30 | SQ | 0.03 | 0.22 | 0.04 | NQ | NQ | 0.04 | 4.78 | 0.14 | NQ | NQ | 4.92 | 0.03 |
| LM31 | STC | 0.03 | 0.20 | NQ | NQ | NQ | 0.04 | 4.76 | 0.16 | NQ | NQ | 4.92 | 0.03 |
| LM32 | WB | 2.78 | 0.12 | 0.03 | 0.16 | 0.06 | 0.05 | 0.63 | 0.13 | 0.06 | 0.04 | 0.76 | 2.94 |
*NQ: Not quantifiable ��? below LOD or LOQ
Table 4: Quantitative data for cannabinoids w/w (%).
| File ID | Cultivar | *T1 | T2 | T3 | T4 | T5 | T6 | T7 | T8 | T9 | T10 | T11 | T12 | T13 | T14 |
|---|---|---|---|---|---|---|---|---|---|---|---|---|---|---|---|
| LM1 | AD | 0.011 | 0.094 | 0.018 | NQ | 0.069 | NQ | NQ | 0.043 | 0.003 | 0.019 | 0.008 | 0.016 | 0.003 | 0.331 |
| LM2 | ADEB | 0.010 | 0.016 | 0.017 | NQ | 0.052 | NQ | NQ | 0.043 | 0.002 | 0.018 | 0.006 | 0.017 | 0.002 | 0.414 |
| LM3 | ATH | 0.032 | 0.063 | 0.014 | 0.004 | NQ | 0.007 | NQ | 0.008 | NQ | 0.007 | 0.006 | 0.010 | 0.002 | 0.063 |
| LM4 | BW | 0.009 | 0.042 | 0.016 | NQ | NQ | NQ | NQ | 0.033 | NQ | 0.015 | 0.005 | 0.014 | 0.002 | 0.187 |
| LM5 | BD | 0.415 | 0.188 | 0.190 | NQ | 0.088 | NQ | 0.004 | 0.047 | 0.003 | 0.036 | 0.013 | 0.031 | 0.001 | 0.119 |
| LM6 | BDEB | 0.458 | 0.205 | 0.209 | NQ | 0.129 | NQ | 0.005 | 0.052 | 0.004 | 0.044 | 0.016 | 0.039 | 0.002 | 0.141 |
| LM7 | CT | 0.047 | 0.132 | 0.021 | 0.007 | NQ | 0.037 | NQ | 0.048 | 0.003 | 0.020 | 0.011 | 0.021 | 0.002 | 0.056 |
| LM8 | CT+LSD | 0.032 | 0.020 | 0.019 | NQ | 0.013 | 0.005 | 0.002 | 0.030 | 0.002 | 0.016 | 0.009 | 0.022 | 0.002 | 0.103 |
| LM9 | CC | 0.015 | 0.047 | 0.005 | NQ | NQ | 0.002 | NQ | 0.015 | NQ | 0.010 | 0.007 | 0.010 | 0.002 | 0.041 |
| LM10 | DQ | 0.007 | 0.018 | 0.011 | NQ | NQ | NQ | NQ | 0.039 | NQ | 0.012 | 0.005 | 0.010 | 0.002 | 0.066 |
| LM11 | EMD | 0.028 | 0.029 | 0.029 | NQ | 0.107 | NQ | NQ | 0.013 | 0.002 | 0.033 | 0.010 | 0.025 | 0.002 | 0.195 |
| LM12 | EMD#1 | 0.052 | 0.114 | 0.044 | NQ | 0.071 | NQ | 0.006 | 0.029 | 0.003 | 0.038 | 0.013 | 0.019 | 0.003 | 0.208 |
| LM13 | EMD#2 | 0.023 | 0.023 | 0.020 | NQ | 0.063 | NQ | NQ | 0.010 | 0.002 | 0.026 | 0.010 | 0.022 | 0.003 | 0.174 |
| LM14 | ER | 0.039 | 0.046 | 0.028 | 0.006 | NQ | 0.004 | NQ | 0.006 | NQ | NQ | 0.007 | 0.015 | 0.002 | 0.072 |
| LM15 | GLA | 0.025 | 0.044 | 0.044 | 0.012 | 0.028 | NQ | 0.006 | 0.061 | 0.001 | 0.010 | 0.005 | 0.033 | 0.008 | 0.321 |
| LM16 | GLA#1 | 0.067 | 0.102 | 0.048 | 0.006 | 0.034 | 0.002 | 0.003 | 0.035 | 0.002 | 0.015 | 0.007 | 0.022 | 0.005 | 0.197 |
| LM17 | GLA#2 | 0.082 | 0.103 | 0.046 | NQ | 0.029 | NQ | 0.002 | 0.026 | 0.002 | 0.016 | 0.008 | 0.016 | 0.004 | 0.171 |
| LM18 | KOG | 0.036 | 0.283 | 0.070 | NQ | 0.239 | NQ | NQ | 0.094 | 0.004 | 0.063 | 0.016 | 0.049 | 0.003 | 0.363 |
| LM19 | KOGEB | 0.034 | 0.155 | 0.065 | NQ | 0.187 | NQ | NQ | 0.104 | 0.005 | 0.069 | 0.019 | 0.056 | 0.002 | 0.640 |
| LM20 | KOGEBE | 0.038 | 0.171 | 0.072 | NQ | 0.233 | NQ | NQ | 0.140 | 0.005 | 0.074 | 0.019 | 0.058 | 0.003 | 0.700 |
| LM21 | LAA | 0.022 | 0.261 | 0.041 | NQ | 0.136 | NQ | 0.003 | 0.021 | 0.004 | 0.045 | 0.016 | 0.018 | 0.003 | 0.198 |
| LM22 | OGK | 0.026 | 0.045 | 0.045 | NQ | 0.156 | NQ | 0.003 | 0.071 | 0.007 | 0.040 | 0.010 | 0.035 | 0.002 | 0.202 |
| LM23 | PLA | 0.029 | 0.052 | 0.051 | NQ | 0.184 | NQ | 0.002 | 0.075 | 0.008 | 0.041 | 0.009 | 0.034 | 0.002 | 0.210 |
| LM24 | PLA#1 | 0.024 | 0.055 | 0.040 | NQ | 0.104 | NQ | NQ | 0.076 | 0.006 | 0.043 | 0.013 | 0.037 | 0.003 | 0.199 |
| LM25 | PLA#2 | 0.015 | 0.036 | 0.025 | NQ | 0.073 | NQ | 0.003 | 0.038 | 0.003 | 0.027 | 0.009 | 0.023 | 0.003 | 0.153 |
| LM26 | PLA#3 | 0.013 | 0.019 | 0.020 | NQ | 0.053 | NQ | NQ | 0.023 | 0.002 | 0.018 | 0.006 | 0.014 | 0.003 | 0.129 |
| LM27 | QK | 0.012 | 0.110 | 0.020 | NQ | 0.063 | NQ | NQ | 0.119 | 0.002 | 0.020 | 0.006 | 0.019 | 0.003 | 0.413 |
| LM28 | SD | 0.337 | 0.129 | 0.080 | NQ | NQ | 0.002 | NQ | 0.034 | NQ | 0.011 | 0.012 | 0.012 | 0.002 | 0.082 |
| LM29 | SDEB | 0.796 | 0.301 | 0.179 | NQ | 0.056 | NQ | 0.004 | 0.058 | 0.002 | 0.021 | 0.022 | 0.022 | 0.003 | 0.156 |
| LM30 | SQ | 0.021 | 0.037 | 0.033 | NQ | 0.097 | NQ | NQ | 0.071 | 0.003 | 0.033 | 0.010 | 0.029 | 0.003 | 0.257 |
| LM31 | STC | 0.123 | 0.119 | 0.039 | NQ | 0.027 | NQ | 0.002 | 0.015 | 0.002 | 0.013 | 0.007 | 0.012 | 0.003 | 0.167 |
| LM32 | WB | 0.035 | 0.044 | 0.009 | 0.003 | NQ | 0.010 | NQ | 0.005 | NQ | 0.004 | 0.006 | 0.004 | 0.002 | 0.020 |
*NQ: Not quantifiable â�?�? below LOD or LOQ; *T1=α-Pinene, T2=β-Myrcene, T3=β-Pinene, T4=Δ3-Carene, T5=Limonene, T6=p-Cymene, T7=Eucalyptol, T8=Linalool, T9=Fenchone, T10=Fenchol, T11=Borneol, T12=α-Terpineol, T13=Pulegone, T14=β-Caryophyllene
Table 5: Quantitative data for terpenes w/w (%).
Cluster analysis
Total THC (Δ9-THC+THCA as T-THC) and total CBD (CBD+CBDA as T-CBD) were calculated and used in cluster analysis because THCA and CBDA become THC and CBD after decarboxylation [24]. The levels of T-THC ranged from 7.08% (LM20) to 0.24% (LM7). The levels of T-CBD ranged from undetectable amounts (LM2, 11, 13, 25, 26) to 5.52% (LM7). Cluster analysis based only on T-THC and T-CBD classified 32 samples into four clusters, which is presented as a constellation plot in Figure 5. Cluster 1 and cluster 2 are THC dominant (chemotype I) with average T-THC more than 3% and average T-CBD less than 1% (Table 6). Cluster 3 has an approximately equal amount of T-THC and T-CBD (chemotype II) at around 1.5% each (Table 6). Cluster 4 has only one cultivar and is CBD dominant (chemotype III) with T-CBD more than 5% and T-THC less than 1% (Table 6).

Figure 5: Constellation Plot-cluster analysis based on total THC and total CBD.
| Cluster | Cultivar Count | T-THC Ave. (w/w %) | T-CBD Ave. (w/w %) |
|---|---|---|---|
| 1 | 17 | 3.84 | 0.02 |
| 2 | 10 | 6.31 | 0.04 |
| 3 | 4 | 1.29 | 1.92 |
| 4 | 1 | 0.24 | 5.52 |
Table 6: Average levels of total THC and total CBD in each cluster in Figure 5.
However, if samples are grouped into clusters based on the full chemical profile (10 cannabinoids and 14 terpenes), the classification results changed (Figure 6). After involving more cannabinoids and terpenes, samples were classified into four clusters, with cluster 1, 2, 3 being THC dominant and cluster 4 being CBD dominant (Table 7). Furthermore, cultivars clustered together not only have similar THC and CBD content, but also have similar full profiles. Classification based on the full chemical profile may offer more flexible and reliable choices for clinical researchers and licensed producers in terms of choosing cannabis cultivars. For example, if LM28 is clinically studied and recommended for a particular condition, LM29 in the same cluster likely can be an alternative if LM28 is not available, due to the two cultivars’ similarities.

Figure 6: Constellation Plot-cluster analysis based on full chemical profile.
| Cluster | Count | Total THC Ave. (w/w%) | Total CBD Ave. (w/w%) |
|---|---|---|---|
| 1 | 20 | 3.55 | 0.40 |
| 2 | 9 | 5.53 | 0.04 |
| 3 | 2 | 6.43 | 0.07 |
| 4 | 1 | 0.24 | 5.52 |
Table 7: Average levels of total THC and total CBD in each cluster in Figure 6.
Principal component analysis (PCA)
Although Figure 7 gives a clear profile of all cannabinoids and terpenes levels in each cluster, some compounds are more important to the classification. In this case, 10 cannabinoids and 14 terpenes are the original 24 variables (24 dimensions) in PCA. By calculating the covariance matrix between these 24 dimensions, PCA can generate 24 new variables (24 PCs), that are orthogonal to each other and can explain 100% of the total variance of the original data. In this work, the first three PCs explain 65.3% of the total variance. Each PC is correlated with the original 24 variables. The first column in the loading matrix (Table 8) are the correlations of PC1 with each compound. The higher the absolute value, the high the correlation. For example, PC1 is more correlated with THCA, Limonene, Fenchol, Terpineol, Borneol, Linalool, β-Caryophyllene, Fenchone, β-Myrcene, which indicates that PC1 is more of a “THCA+terpenes” item. This conclusion indicates that cultivars within close proximity along PC1 have similar combination of THCA and these terpenes, whereas separated clusters have distinct amounts of these compounds. For instance, Clusters 1, 2 and 3 are separated along PC1 (Figure 8) due to different combinations of THCA and these terpenes – this separation corresponds with cannabinoids and terpenes content in Figure 7. In addition, PC2 is more correlated with CBN, p-Cymene, CBC, CBDA, CBD, and THCV, which makes PC2 a “cannabinoids” item. For example, Clusters 1, 2, 3 (THC dominant) are separated from Cluster 4 (CBD dominant) along PC2 mostly due to the distinct CBDA content in Cluster 4. Additionally, Cluster 4 (LM7) may be related with higher percentages of p-Cymene (0.037%) compared to cultivars in Cluster 1, 2, and 3. However, Cluster 1 only contains one cultivar, which suggests that additional data is required to make a reliable conclusion. Finally, PC3 is more correlated with α-Pinene and Δ9-THC, which explains the separation between Cluster 2 and Cluster 3 along PC3 (Figure 9). More specifically, LM20 in Cluster 2 has 0.038% α-Pinene and 0.14% Δ9-THC while LM29 in Cluster 3 has 0.337% α-Pinene and 0.59% Δ9-THC, which also matches with average cluster content of α-Pinene and Δ9-THC in Figure 7. The loading plot for PC1 and PC2 (Figure 8) gives an intuitive explanation whereby the longer the radial separation of the compound from the center, the more important the compound is in distinguishing cultivars in PC1 and PC2. The mathematical explanation is that the radial equals the square sum of the compound’s correlations with PC1 and PC2 (Table 8). In conclusion, if cultivars are separated along PC1, they contain a distinct amount of THCA and terpenes (Limonene, Fenchol, Terpineol, Borneol, Linalool, β-Caryophyllene, Fenchone, β-Myrcene). If cultivars are separated along PC2, they contain different amount of cannabinoids (CBN, CBC, CBDA, CBD, and THCV) and p-Cymene. If they are separated along PC3, most likely the α-Pinene and THC contents are differentiable.

Figure 7: Cannabinoid and terpene contents in each cluster based on a full profile.

Figure 8: PCA of 32 cannabis cultivars (PC1 and PC2), scatter plot on the left and loading plot on the right. *Dot represents cultivar from Cluster 1 in the cluster analysis. Cross represents cultivar from Cluster 2 in the cluster analysis. Square represents cultivar from Cluster 3 in the cluster analysis. Triangle represents cultivar from Cluster 4 in the cluster analysis.

Figure 9: PCA of 32 cannabis cultivars (PC1 and PC3), scatter plot on the left and loading plot on the right. *Dot represents cultivar from Cluster 1 in the cluster analysis. Cross represents cultivar from Cluster 2 in the cluster analysis. Square represents cultivar from Cluster 3 in the cluster analysis. Triangle represents cultivar from Cluster 4 in the cluster analysis.
| S. No | PC1 | PC2 | PC3 | |
|---|---|---|---|---|
| 1 | THCA | 0.8567 | -0.1382 | 0.1237 |
| 2 | Limonene | 0.8432 | 0.1535 | -0.3894 |
| 3 | Fenchol | 0.8335 | 0.2800 | -0.3638 |
| 4 | α-Terpineol | 0.8052 | 0.2273 | -0.2980 |
| 5 | Borneol | 0.7640 | 0.4396 | 0.2640 |
| 6 | Linalool | 0.7438 | 0.2725 | -0.2908 |
| 7 | β-Caryophyllene | 0.7070 | 0.0750 | -0.4148 |
| 8 | Fenchone | 0.6332 | 0.1422 | -0.3827 |
| 9 | β-Myrcene | 0.6152 | 0.4238 | 0.4825 |
| 10 | Δ8-THC | 0.5065 | 0.4541 | 0.1443 |
| 11 | CBN | *-0.1634 | 0.8297 | -0.0112 |
| 12 | p-Cymene | -0.5247 | 0.7599 | 0.0133 |
| 13 | CBC | 0.2543 | 0.7580 | -0.1432 |
| 14 | CBDA | -0.5951 | 0.7568 | -0.0153 |
| 15 | CBD | -0.6232 | 0.7362 | 0.0493 |
| 16 | THCV | -0.5624 | 0.6991 | -0.0224 |
| 17 | α-Pinene | 0.3298 | 0.0486 | 0.8362 |
| 18 | Δ9-THC | 0.1593 | 0.0418 | 0.8012 |
| 19 | β-Pinene | 0.5746 | 0.0329 | 0.5819 |
| 20 | CBGA | 0.4417 | 0.3003 | 0.5266 |
| 21 | Eucalyptol | 0.2127 | -0.2522 | 0.4494 |
| 22 | Pulegone | 0.0372 | -0.1933 | 0.2270 |
| 23 | Δ3-Carene | -0.3958 | 0.1525 | 0.1674 |
| 24 | 24. CBG | 0.1627 | -0.0546 | -0.0734 |
*Absolute loading values less than 0.3 were dimmed.
Table 8: Loading matrix for the first three PCs.
After grouping these cultivars and visualizing the clusters in fewer dimensions using PCA, the grouping results were compared to the constellation plot from the cluster analysis (Figures 8 and 9). The cultivars circled in each group in the scatter plot were the same cultivars in each cluster as in the constellation plot. Because Cluster 1 and Cluster 2 and Cluster 4 were separated in PC1 and PC2 scatter plot, and Cluster 2 and Cluster 3 were separated in PC1 and PC3 scatter plot, visually the two grouping results match.
Conclusions
Existing approaches for cannabis classification may be inadequate because they analyze cannabis from botanical perspectives or based on only the two primary cannabinoids THC and CBD. In this work, an HPLC method for cannabinoids and a GC-MS method for terpenes were developed and validated. We quantified 10 cannabinoids and 14 terpenes in 32 medical cannabis samples from two licensed producers in Canada. Samples were classified using both cluster analysis and PCA. In cluster analysis, samples were grouped into four clusters, where clusters 1, 2 and 3 are THC dominant, and cluster 4 is CBD dominant. The result was different from cluster analysis using only THC and CBD content, which supports the hypothesis that classification based exclusively on THC and CBD may be insufficient when considering all medically relevant compounds in cannabis. PCA results confirmed the cluster results and also indicated which cannabinoids and terpenes are critical in discriminating cultivars. Currently, a systematic cultivar classification involving all commercially available cultivars in Canada has not been accomplished. However, this is necessary as these relationships will allow clinicians to identify the right cannabis cultivar with the right components to achieve optimal treatment outcomes. The ultimate goal is to develop a systematic classification and standardization method using chemical and genetic analysis techniques in tandem that can link cultivars with morphological characteristics, chemical composition, and medicinal applications.
Acknowledgements
The authors are highly grateful for full funding and facilities support from Labs- Mart Inc. for conducting sample collection and the experimental process. Labs-Mart Inc. is a third-party testing lab that has no affiliation with any licensed producers.
References
- Mahmoud ElSohly A (2014) Constituents of Cannabis Sativa. Handbook of Cannabis.
- http://www.hc-sc.gc.ca/dhp-mps/marihuana/med/infoprof-eng.php
- Russo EB (2011) Taming THC: potential cannabis synergy and phytocannabinoid�?�terpenoid entourage effects. British Journal of Pharmacology 163:1344-1364.
- Brenneisen R (2007) Chemistry and analysis of phytocannabinoids and other Cannabis constituents. Forensic Science and Medicine: Marijuana and the Cannabinoids. Humana Press Inc., Totowa, New Jersey, USA.
- http://medicalmarijuana.procon.org/view.resource.php?resourceID=000881
- http://www.hc-sc.gc.ca/dhp-mps/marihuana/info/list-eng.php
- http://www.hc-sc.gc.ca/dhp-mps/marihuana/about-apropos-eng.php
- Anderson LC (1980) Leaf variation among Cannabis species from a controlled garden. Botanical Museum Leaflets 28: 61-69.
- Small E (1972) Interfertility and chromosomal uniformity in Cannabis. Canadian Journal of Botany 50: 1947-1949.
- Small E, Cronquist A (1976) A practical and natural taxonomy for Cannabis. Taxon 25: 405-435.
- Hillig KW (2004) A chemotaxonomic analysis of terpenoid variation in Cannabis. Biochemical systematics and ecology 32: 875-891.
- Hillig KW (2005) Genetic evidence for speciation in Cannabis (Cannabaceae). Genetic Resources and Crop Evolution 52: 161-180.
- Hillig KW, Mahlberg PG (2004) A chemotaxonomic analysis of cannabinoid variation in Cannabis (Cannabaceae). American Journal of Botany 91: 966-975.
- Mandolino G, Carboni A (2004) Potential of marker-assisted selection in hemp genetic improvement. Euphytica 140: 107-120.
- United Nations Office on Drugs and Crime Vienna (2009) Recommended methods for the identification and analysis of cannabis and cannabis products. United Nations Office on Drugs and Crime: New York, USA.
- Ross SA, Mehmedic Z, Urphy TP, ElSohly MA (2000) GC-MS analysis of the total δ9-thc content of both drug-and fiber-type cannabis seeds. Journal of Analytical Toxicology 24: 715-717.
- Turner CE, Elsohly MA, Cheng PC, Lewis G (1979) Constituents of Cannabis sativa L., XIV: Intrinsic problems in classifying Cannabis based on a single cannabinoid analysis. Journal of Natural Products 42: 317-319.
- Mandolino G, Bagatta M, Carboni A, Ranalli P, de Meijer E (2003) Qualitative and quantitative aspects of the inheritance of chemical phenotype in Cannabis. Journal of Industrial Hemp 8: 51-72.
- De Meijer E, Hammond K (2005) The inheritance of chemical phenotype in Cannabis sativa L.(II): cannabigerol predominant plants. Euphytica 145: 189-198.
- De Meijer E, Hammond K, Sutton A(2009) The inheritance of chemical phenotype in Cannabis sativa L.(IV): cannabinoid-free plants. Euphytica 168: 95-112.
- Zuardi AW, Hallak JEC, Crippa JAS (2012) Interaction between cannabidiol (CBD) and�?? 9-tetrahydrocannabinol (THC): influence of administration interval and dose ratio between the cannabinoids. Psychopharmacology 219: 247-249.
- Fischedick JT, Hazekamp A, Erkelens T, Choi YH, Verpoorte R (2010) Metabolic fingerprinting of Cannabis sativa L., cannabinoids and terpenoids for chemotaxonomic and drug standardization purposes. Phytochemistry 71: 2058-2073.
- Hazekamp A, Fischedickm JT(2012) Cannabis -from cultivar to chemovar, Drug Test. Analysis, Wiley Online Library.
- American Herbal Pharmacopoeia (2014) Cannabis Inflorescence, Cannabis spp., Standards of identity, analysis and quality control.
- Brenneisen R (2007) Chemistry and analysis of phytocannabinoids and other Cannabis constituents. From:Forensic Science and Medicine: Marijuana and the Cannabinoids. Humana Press Inc., Totowa, New Jersey, USA.
- John M, McPartlandM, Ethan Russo B (2001) Cannabis and Cannabis Extracts: Greater Than the Sum of Their Parts? Journal of cannabis Therapeutics 1: 103-132.
- https://www.ich.org/fileadmin/Public_Web_Site/ICH_Products/Guidelines/Quality/Q2_R1/Step4/Q2_R1__Guideline.pdf
- Milligan GW (1980) An Examination of the Effect of Six Types of Error Perturbation on Fifteen Clustering Algorithms. Psychometrika 45: 325-342.
- Kimberly Colson L, Jimmy Y, Christian F (2015) Nuclear Magnetic Resonance - A Revolutionary Tool for Nutraceutical Analysis, Botanicals, Methods and Techniques for Quality and Authenticity. CRC Press.
Relevant Topics
Recommended Journals
Article Tools
Article Usage
- Total views: 8682
- [From(publication date):
February-2017 - Jul 16, 2025] - Breakdown by view type
- HTML page views : 7462
- PDF downloads : 1220