Coastal Marine Sediment Heavy Metals Contamination of a Transgressive Mud Beach, Ondo State, Southwest, Nigeria
Received: 07-Feb-2019 / Accepted Date: 01-Mar-2019 / Published Date: 09-Mar-2019
Abstract
The coastal zone of Nigeria is a home to over 80% of the country’s industries, which have introduced significant levels of heavy metals into the marine environment. All the available literature shows that, this area of transgressive beach, of the Bight of Benin, Southwest, Nigeria, is among the poorly studied in term of heavy metal accumulation and distribution. Ten selected heavy metals (As, Cd, Cr, Cu, Fe, Mn, Ni, Pb, V and Zn) were investigated monthly from six locations for one annual cycle of 2016. Samples were subjected to digestion and Atomic Absorption Spectrophotometer to determine the concentrations of heavy metals. The results showed that all the heavy metals except for Cd did not pose any apparent risk to biota at all levels. The Contamination Factors (CF) of As, Cd and Mn, indicated a moderate contamination (1<CF<3). Degree of contamination (Cdeg) ranged from 5.2 to 12.5 in both seasons. The PLI were less than one in all the sampling stations and seasons. The Enrichment Factor (EF) values for Cd and As obtained for all the locations ranged from 1.9 to 24.9 indicating a significant enrichment of Cd and As in sediment. The Index of Geoaccumulation (Igeo) of all the investigated metals were negative across the sampling stations except Cd, implying that there was low heavy metals contamination across the study area. The heavy metals in sediments of Ondo State coastal marine water might be derived from the mechanically weathered rock materials and anthropogenic activities.
Keywords: Rock; Bight of Benin; Anthropogenic; Geoaccumulation; Enrichment factor
Introduction
Enrichment of heavy metals in marine sediments are of critical concern due to their toxicity to biological systems as well as associated public health risks. Unlike other contaminants, metals are nondegradable and may persist in the environments over billions of years with potentials of becoming bioaccumulated and biomagnified up the food chain [1]. Metals such as Fe, Cu, and Zn for instance may become toxic at high concentrations [2] while As, Cd, and Pb which have no important biological roles tend to be teratogenic, carcinogenic or mutagenic [3].
Sediment constitutes the mixture of classic materials and mineral species from the parent rocks and organic debris that are transported by detrital process and deposited in the bottom of the water [4]. The accumulation of sediment on the ocean floor occurs through complicated physicochemical and biological processes [5]. The level of heavy metals in sediment affects the hydrological cycle and reflects the quality of an aquatic system [6].
The contamination of the sediment may result naturally from the introduction of heavy metals from the geologic weathering of the bedrock and direct atmospheric deposition. The interactions between the water and crustal materials with which the water is in contact also introduce heavy metals into the sediment [7]. The anthropogenic activities such as transportation, energy generation and utilization, dredging, fishing, oil exploration, farming, infrastructural development and mining are crucial for several socio-economic reasons [8], however, they stand as the major sources of heavy metals when their wastes eventually find their ways into the aquatic system [4]. This alters the sediment quality and affect the aquatic organisms. The direct discharge of industrial waste products that contain heavy metals into the water could also act as the source of contamination of the sediment [9].
Just as many parts of the world, the coastal zone of Nigeria is a home to over 80% of the country’s industries, with the western part being the hub of commercial oil exploration and drilling. Majority of the industries in the coastal zone have introduced significant levels of trace metals into the marine environment through the discharge of untreated effluents either directly or via estuaries.
In recent years, heavy metal pollution of the aquatic environment has become a worldwide problem due to their toxicity (direct toxicity to man and aquatic life), persistence and accumulation problems (indirect toxicity in the food chain) [10]. Ahmadipour et al. [11] reported that heavy metals have great ecological relevance due to their toxicity and tendency to accumulate in both sediment and biota. The increased concentration of heavy metals in the sediment has adverse health implication due to possibility of entering the food chain through aquatic organism uptake and direct consumption of aquatic organisms by man [12]. Polluted sediment can act as a metal pool, thereby release metals to the overlying water via natural or anthropogenic processes, causing potential adverse health effects to the ecosystem and debasing of the water quality [13]. Unlike organic pollutants, heavy metals cannot be biologically degraded or destroyed, thus they may either accumulate locally or be transported over long distance in an environmental medium [14]. They can undergo complexion, ion exchange and precipitation reactions [6].
The study of the contamination level, enrichment and accumulation of heavy metals is important to assess the possible influence of both natural and anthropogenic activities on the bottom sediment of the ocean [15]. All the available literature shows that, this area of transgressive beach, of the Bight of Benin, Southwest, Nigeria, is among the poorly studied in term of heavy metal accumulation and distribution. In the present study, sediment of Ondo State coastal marine water area, Southwestern Nigeria were sampled and analyzed for heavy metal concentrations using Atomic Absorption Spectroscopy (AAS) technique. The study aimed to assess the contamination and accumulation status of the heavy metals in the sediment using a variety of environmental contamination indices including contamination factor (CF), degree of contamination (Ddeg), pollution load index (PLI), index of geoaccumulation (Igeo) and enrichment factor (EF) analysis.
Materials and Methods
Description of the study area
Ondo State coast, Southwest Nigeria is strategically located along the Gulf of Guinea as the Transgressive Mud Beach (TMB) lying to the east of the West African lagoon system and to the west of the Benin Flank of the Niger Delta Basin [16] spanning about 115 km, it is one of the longest coastlines in Nigeria which favors fishing activities in the coastal areas. The major anthropogenic activities around the Ondo coastal area include transportation services, crude oil exploration and exploitation, domestic, commercial and agricultural activities. The study area lies within the tropical rain forest zone and bounded roughly by latitudes 05.56°-06.30° N and longitudes 004.40°-005.43°E with an average altitude of about 22 ± 5 m above the sea level (Figure 1). The climate of the area is characterized by two main seasons, namely: dry and wet seasons. The dry season spans through the month of November to March while wet season occurs from April to October with an average annual rainfall of about 380 ± 12 mm [17]. Six sampling locations were chosen based on the proximity of the anthropogenic activities (such as oil exploration, market activities, fishing and the areas of incursion of the estuaries into the Atlantic Ocean).

Figure 1: Map of the study area showing the sampling stations (red triangles) and major settlements in the area.
Sample collection and preparation
The sediment samples were collected monthly over an annual cycle from January 2016 to December 2016 at approximately 2.0 and 5.3 nautical miles from the coastline at 5m depth and 10m depth respectively of the ocean-bed using a vanVeen grab sampler. Sediment samples were collected with plastic spatula from the middle of the grab bulk sediment, in order to avoid contamination with the sampler. Each sample was bulked together to form a composite sample out of which a representative sample was obtained.
The samples were transported to the laboratory and air dried at room temperature for two weeks and then ground in a pre-washed mortar and pestle. In order to remove coarse debris and since finegrained sediments tend to have relatively high metal contents due in part to the high specific surface of smaller particles [18], the samples were screened through a 160 μm stainless steel sieve mesh size. All glassware and equipment were washed with acetone an to avoid possible contamination.
Elemental analysis
The digestion of the sediment samples was carried out following the method of Khuntong et al. (2015) [19]. The sediment samples were soaked in the 15 mL mixture of conc. nitric acid (HNO3) and conc. hydrochloric acid (HCl4) (1:3) in the Foss Tecator digestion vessel and placed on a heating electric plate at about 334-350 °C for 3 hours or more until a clear solution was obtained. The mixed solution was then boiled until the evaporation of the acid solution. Upon cooling, the solution was filtered using Watman filter paper to a 100 mL volumetric flask and then diluted to 50 mL with distilled-de-ionized water and kept in the sample bottle at 4°C before analysis. The compositions and concentrations of the heavy metals were determined using Atomic Absorption Spectrometer (Buck Scientific VGP 210 Model) at the Central Science Laboratory (CSL), Obafemi Awolowo University, Ile Ife, Nigeria. The choice of AAS for heavy metal analysis in this study was based on its species selectivity, sensitivity, reproducibility, wide dynamic concentration range and its relatively low cost [20]. The levels of contamination, accumulation and pollution status of the sediment were assessed using the following indices.
Contamination factor (CF)
The level of contamination of sediment by the heavy metals was assessed using the contamination factor (CF). The CF for a heavy metal is calculated as:
 Where; CFi is the contamination factor of the element of interest, Cis the concentration of the element in the sediment sample and in C is the background concentration [21] continental crustal average data was adopted as the Cin (background concentration). The CF is classified into four main groups: CF<1 means low contamination; 1>CF<3 means moderate contamination; 3>CF<6 implies considerable contamination and CF>6 indicates very high contamination [22].
Degree of contamination (Cdeg)
The Cdeg is the sum of the contamination factors of all the heavy metals in the sediment for a site: Cdeg =ΣCFi
Where; CFi = contamination factor, four major categories of the degree of contamination have been identified: <8 indicates low degree of contamination, 8-16 shows moderate degree of contamination, 16-32 implies considerable degree of contamination and >32 shows very high degree of contamination [23].
Pollution load index
The pollution load index (PLI) was evaluated for the extent of metal pollution indices as the nth root of the product of the 1 to nth CF as in the following equations: 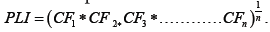
Where n is the number of heavy metals under consideration and CF is the estimated contamination factor. The PLI values less than zero (<0), greater than zero (>1) and one (1) imply unpolluted situation, progressive deterioration in the environment quality and the occurrence of baseline levels of contamination, respectively [24].
Enrichment factor (EF) analysis
The EF analysis proposed by Zoller et al. (1974) was used in evaluating the extent of enrichment and the potential strength of the sources of the sediment contamination. The EF was estimated using the equation:
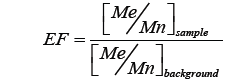
Where EF is the enrichment values for the element, (Me/Mn) sample is the metal to Mn ratio in the sample of interest; (Me/Mn) background is the natural background value of metal to Mn ratio. In this study, Mn was used as the reference element based on its relative stability and its inertness in migration [25]. Continental crustal average data was adopted as the background concentration [21]. EF categories are <2, 2-5, 5-20, 20-40 and >40 corresponding to minimal, moderate, significant, very high and extremely high enrichment, respectively [26].
Index of geoaccumulation
The Igeo compares the measured concentration [Me]sediment of the elements in a given sample with the geochemical background concentrations [Me]background for the element in the sample [27]. The Igeo was calculated using the logarithmic function: 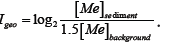
Continental crustal average data was used as the background elemental concentrations. In this study, Igeo was estimated using the seasonal average values of the measured elemental concentrations [21]. The Igeo values with their corresponding contamination status are <0=practically unpolluted, 0-1=unpolluted to moderately polluted, 1-2=moderately polluted, 2-3=moderately to strongly polluted, 3-4=strongly polluted, 4-5=strongly to extremely polluted and >5=extremely polluted [28,29].
Results
Table 1 shows the results of the average seasonal concentrations of the ten investigated heavy metals (As, Cd, Cr, Cu, Fe, Mn, Ni, Pb, V and Zn) in the sediment. Fe had the highest average concentration values of 299.67 ± 1.15 mg/kg at Abereke 5m and 387.33 ± 0.58 mg/kg at Awoye 5m sampling site for wet and dry season, respectively. The highest mean concentration of Mn at Abereke 5m site was 288.4 ± 0.17 mg/kg for dry season and 301.17 ± 0.85 mg/kg at the Ayetoro site for wet season. We characterized any toxic risks the current levels of trace metals are likely to pose to biota by comparing levels with national oceanic and atmospheric administration’s screening quick reference tables [30]. This table screens marine sediments with conservative values such as the lower-threshold values (TEL), Probable Effect Levels (PELs), Effects Range-Low (ERLs) and the Apparent Effects Threshold (AET). The screening values in this table were derived using concentrations. Our results indicated that all the heavy metals examined except for Cd did not pose any apparent risk to biota at all effect levels (Table 1). The levels of Cd in the sediments, however, pose potential risk to biota across all effect levels at some locations.
| Abereke 5m | Abereke 10m | Awoye 5m | Awoye 10m | Ayetoro 5m | Ayetoro 10m | TEL | PEL | AET | ||||||||||
|---|---|---|---|---|---|---|---|---|---|---|---|---|---|---|---|---|---|---|
| Metals | Dry | Wet | Dry | Wet | Dry | Wet | Dry | Wet | Dry | Wet | Dry | Wet | ||||||
| As | 4.53 ± 0.06 | 6.07 ± 0.15 | 2.67 ± 0.12 | 5.27 ± 0.15 | 5.27 ± 0.06 | 7.97 ± 0.15 | 4.33 ± 0.23 | 6.97 ± 0.32 | 3.01 ± 0.01 | 4.23 ± 0.25 | 2.47 ± .06 | 3.30 ± 0.20 | 7.24 | 41.6 | 35B | |||
| Cd | 0.83 ± 0.06 | 0.58 ± 0.02 | 0.57 ± 0.06 | 0.53 ± 0.03 | 1.17 ± 0.06 | 0.85 ± 0.04 | 1.02 ± 0.03 | 0.67 ± 0.03 | 0.37 ± 0.06 | 0.55 ± 0.01 | 0.31 ± 0.03 | 0.32 ± 0.03 | 0.68 | 4.21 | 3N | |||
| Cr | 0.55 ± 0.05 | 0.87 ± 0.03 | 0.32 ± 0.02 | 0.71 ± 0.02 | 1.04 ± 0.01 | 1.79 ± 0.01 | 0.33 ± 0.06 | 1.15 ± 0.01 | 0.22 ± 0.02 | 0.59 ± 0.02 | 0.02 ± 0.01 | 0.45 ± 0.01 | 52.3 | 160.4 | 62N | |||
| Cu | 4.07 ± 0.06 | 4.53 ± 0.06 | 2.10 ± 0.1 | 2.73 ± 0.06 | 8.43 ± 0.12 | 9.44 ± 0.37 | 12.63 ± 0.29 | 13.09 ± 0.18 | 1.60 ± 0.1 | 2.61 ± 0.08 | 1.17 ± 0.06 | 2.40 ± 0.10 | 18.7 | 108.2 | 390MO | |||
| Fe | 323.67 ± 0.58 | 299.67 ± 1.15 | 185.67 ± 0.58 | 153.00 ± 1.0 | 387.33 ± 0.58 | 277.67 ± 57.7 | 324.33 ± 0.58 | 248.0 ± 2.0 | 156.33 ± 1.53 | 127.67 ± 0.58 | 126.67 ± 0.58 | 108.33 ± 1.15 | 22%N | |||||
| Mn | 288.4 ± 0.17 | 301.17 ± 0.85 | 271.77 ± 0.58 | 273.57 ± 0.95 | 230.43 ± 0.49 | 234.87 ± 0.25 | 271.77 ± 0.40 | 288.2 ± 0.26 | 209.23 ± 0.21 | 216.53 ± 0.72 | 215.53 ± 0.55 | 295.00 ± 1.06 | 260N | |||||
| Ni | 7.23 ± 0.06 | 8.44 ± 0.47 | 7.09 ± 0.02 | 7.63 ± 0.04 | 8.04 ± 0.06 | 8.93 ± 0.03 | 7.42 ± 0.03 | 8.44 ± 0.13 | 3.43 ± 0.12 | 4.58 ± 0.07 | 3.07 ± 0.06 | 4.39 ± 0.12 | 15.9 | 42.8 | 110EL | |||
| Pb | 1.87 ± 0.01 | 1.74 ± 0.02 | 0.71 ± 0.02 | 0.63 ± 0.02 | 3.02 ± 0.01 | 2.78 ± 0.1 | 2.05 ± 0.01 | 2.08 ± 0.08 | 0.51 ± 0.01 | 0.55 ± 0.01 | 0.05 ± 0.01 | 0.10 ± 0.02 | 30.2 | 112.2 | 400B | |||
| V | 3.17 ± 0.06 | 4.35 ± 0.01 | 3.02 ± 0.02 | 4.13 ± 0.02 | 5.27 ± 0.06 | 5.67 ± 0.06 | 4.73 ± 0.06 | 5.03 ± 0.02 | 2.80 ± 0.01 | 3.44 ± 0.12 | 2.33 ± 0.06 | 3.07 ± 0.03 | 57N | |||||
| Zn | 15.27 ± 0.06 | 19.32 ± 0.04 | 11.23 ± 0.23 | 17.43 ± 0.06 | 36.87 ± 0.06 | 34.96 ± 0.19 | 28.30 ± 0.20 | 22.0 ± 0.1 | 3.47 ± 0.06 | 6.06 ± 0.03 | 1.27 ± 0.06 | 3.60 ± 0.09 | 124 | 271 | 410I | |||
Table 1:Spatial and seasonal mean ± SD (g/kg) and comparison of heavy metals concentrations to quick screening ecotoxicological references values. Screening values are taken from the Screening Quick Reference Table (SQIRT) prepared by NOAA. TEL-Threshold effects level; PEL-Probable effects level; AET-Apparent effects threshold; AET levels: I-Infaunal Community Impacts; MO-Microtox Bioassay; B-Bivalves; N-Neanthes Bioassays; EL-Echinoderm Larvae; I-Infaunal community impacts; M-Microtox.
The results of contamination factor, degree of contamination and pollution load index for the wet and the dry seasons in the six studied stations were presented in Figures 2-5. In the dry season, Cr, Cu, Fe, Ni, Pb, V and Zn had a CF values<1, signifying the low contamination status of the sediment [31]. As, Cd and Mn were 1<CF<3, indicating a moderate contamination (Nasr et al., 2006) [22]. The results of the enrichment factor (EF) analysis for the six sampling stations for both the dry and the wet seasons were presented in the Figures 6-8. In both seasons, the EF values for As and Cd were >2 for the six locations, indicating significant enrichment. All sampling stations have the EF values less than 20 (EF<20) except Cd. The Index of geoaccumulation (Igeo) values of As, Cd, Cr, Cu, Fe, Mn, Ni, Pb, V and Zn are presented in the Table 2.

Figure 2: Contamination factor of V, Cr and Fe.

Figure 3: Contamination factor of As, Cd and Mn.

Figure 4: Contamination factor of Ni, Pb, Zn and Cu.

Figure 5: Degree of contamination and PLI.

Figure 6: Enrichment factor of As and Cd.

Figure 7: Enrichment factor of Pb, Zn, Ni and Cu.

Figure 8: Enrichment factor of Fe, V and Cr.
| Abereke 5m | Abereke 10m | Ayetoro 5m | Ayetoro 10m | Awoye 5m | Awoye 10m | |||||||
|---|---|---|---|---|---|---|---|---|---|---|---|---|
| Metals | Dry | Wet | Dry | Wet | Dry | Wet | Dry | Wet | Dry | Wet | Dry | Wet |
| Mn | -1.65 | -1.61 | -1.71 | -1.7 | -1.97 | -1.94 | -1.94 | -1.63 | -1.87 | -1.85 | -1.71 | -1.65 |
| As | -0.5 | -0.21 | -1.03 | -0.35 | -0.91 | -0.57 | -1.11 | -0.82 | -0.35 | 0.06 | -0.55 | -0.07 |
| Pb | -2.55 | -2.63 | -3.52 | -3.65 | -3.85 | -3.77 | -6.11 | -5.45 | -2.07 | -2.15 | -2.46 | -2.44 |
| Zn | -2.56 | -2.33 | -2.87 | -2.43 | -4.05 | -3.49 | -5.05 | -4.01 | -1.68 | -1.73 | -1.95 | -2.2 |
| Cu | -3.25 | -3.14 | -3.91 | -3.65 | -4.18 | -3.7 | -4.5 | -3.78 | -2.52 | -2.41 | -2.12 | -2.08 |
| Cd | 1.31 | 0.95 | 0.92 | 0.86 | 0.49 | 0.89 | 0.33 | 0.36 | 1.65 | 1.33 | 1.51 | 1.09 |
| Fe | -3.08 | -3.15 | -3.63 | -3.82 | -3.8 | -4.01 | -4.01 | -4.17 | -2.9 | -3.23 | -3.07 | -3.34 |
| V | -4.16 | -3.84 | -4.21 | -3.89 | -4.28 | -4.08 | -4.46 | -4.19 | -3.65 | -3.58 | -3.76 | -3.7 |
| Ni | -2.81 | -2.66 | -2.83 | -2.76 | -3.55 | -3.27 | -3.67 | -3.31 | -2.7 | -2.6 | -2.78 | -2.65 |
| Cr | -5.81 | -5.35 | -6.36 | -5.55 | -6.74 | -5.74 | -9.3 | -6.02 | -5.17 | -4.63 | -6.31 | -5.07 |
Table 2:Index of geoaccumulation (Igeo) results.
Discussion
The high concentrations of Fe and Mn in the sediment samples were most likely related to the local mineralogy and lithogenic origin, rather than the human activities around the study area. Also, the high average values of Fe might be probably due to its being an element whose origin is fundamentally natural and one of the most common elements in the earth’s crust [32]. This agrees with the findings of Iqbal and Shah, 2014 [32] which had reported dominant mean concentrations values Fe and Mn to be 463.0 and 447.5 mg/kg and 3791 and 321.4 mg/kg for both wet and dry season, respectively in the sediment samples obtained from Khanpur Lake, Pakistan. Differences in seasonal concentrations of Cd, Cr, Ni, V and Zn could be related to their regional deposition in the sediment and the rate of accumulation in all the stations. The erosion activities, runoff by the action of water and land-based sources might introduce heavy metal into the water body. This eventually settles and becomes accumulated at the bottom sediment of the ocean. Atmospheric deposition of anthropogenic metals has been reported to be the probable sources for the variation in metal concentrations in the sediment in study area [33]. Most industries such as oil exploration which are located around the stations discharged industrial waste directly into the water without any treatment and remediation, which may contain heavy metals like Pb, Ni, V, Cr and Cd. The commercial ship and industrial flying boat for the transportation of the workers during oil exploration and seismic investigation could also release significant amount of Pb, Cd, V and Ni-containing contaminants into the sediment [18]. In each site, the average values of all the metals studied were lower than the [34] sediment quality guidelines values. This shows that the sediments were unpolluted by the studied metals. The comparison of the heavy metals to quick screening ecotoxicological reference values indicated that the heavy metals did not pose any apparent risk to the biota at all effect level except for Cd. Although it is likely that Cd might not be bioavailable to the biota, but its toxicity would be enhanced upon ingestion due to the acidity of the digestive system in most fishes and invertebrates.
The results of Cdeg ranged from 5.2 to 12.5 in both seasons. This classified the sediment from the six stations as a moderate degree of contamination [23]. The PLI values ranged from 0.01 to 0.09 across the sampling stations in both seasons, denoting unpolluted conditions [24]. The seasonal variations in PLI values might be associated with water inflow, changes in environmental conditions and the alteration in various phases of elements in solution. The relatively small values of PLI indicate less pollution of the sediment by heavy metals. In the wet season, a similar pattern of CF, Cdeg and PLI values were observed in the six sampling stations. This shows that the pollution of sediment is most likely less affected by the season. Although, there might be progressive accumulation of the heavy metals in the sediment which depends on the increased man-made activities such as oil exploration and waste discharge into the coast. The wet season was a period of heavy rainfall, leading to high fluvial inputs. The mobility of the industrial waste alongside with the soil materials into the ocean should increase the pollution of the sediment by the heavy metals in the wet season. However, the results of CF, Cdeg and PLI showed that the sediments quality were less affected by seasons.
The EF values for Cd were >20 in most of the sampling stations in both seasons, indicating that the stations were very highly enriched with Cd. Cd is mostly oil components and they may probably show oil pollution in Ondo State coastal environment. The enrichment of Cd might be attributed to the fact that Cd is a stable isotope in crustal materials, and it is likely to take a considerable length of time before an appreciable depletion can occur [35]. The high enrichment of Cd could also be related to the anthropogenic sources such as boat exhaust systems, antifouling paints and fossil fuel from mechanized boat used in fishing and transportation which were common in the studied area. Generally, the sampling stations which are located closer to the oil exploration point were enriched with Pb. The difference in the EF heavy metals in the coastal sediment might be related to the difference in the magnitude of input for each metal in the sediment as well as difference in the removal rate of each metal from the sediment [36,37]. Largely, the low EF values of Zn, V, Zn, Fe and Cr indicating that they are mostly derived from soil. The high EF values of Cd and As might be attributed to contribution from anthropogenic activities such as oil exploration in the study area.
The results of Index of geoaccumulation (Igeo) shows that As, Cr, Fe, V, Zn and Cu have Igeo values less than one (Igeo<1) at the six sampling locations. This indicates that sediments in the study area were practically uncontaminated by these metals. This agrees with the study of Salah et al. 2012 [31] that obtained negative Igeo values for most metals in the sediments sample of Euphrates River, Iraq. The negative Igeo values also signify that the average heavy metal concentrations in sediment are lower than the average crustal concentration [31]. Cd had the Igeo values of 0 and 1 during dry and wet season at Awoye sampling site. The accumulation of heavy metal in sediment might be derived from the discharge of Omila and Edo rivers into the ocean and the mechanically weathered surface materials.
Generally, the results of all the pollution indices employed in this study agreed well. However, few differences exist among them which could be attributed to their various approaches of computation since the same background concentrations data were used. The CF, Cdeg and PLI results all confirmed the uncontaminated status of most heavy metal considered in all the stations. The results of EF revealed that heavy metals in the study area were enriched by Pb, Cd and Ni but the Igeo values showed that the sediments varied from uncontaminated level to moderately contaminated with respect to Pb and moderately contaminated with Cd. Also, the EF values of Cd and As were between 3 to 40, classifying the stations as significant enriched by Cd and As in both seasons. Meanwhile, Cd had the Igeo values in between 0 and 1 (0<Igeo<1) indicating uncontaminated to moderately contaminated. This implies that the calculations of Igeo had more reliability than those of EF. The differences in the results of the Igeo and EF in this study might be associated with the methods of their computations. The nature of the Igeo computation, which involved the logarithmic function and matrix correction factor of 1.5 was quite different from enrichment factor which normalized heavy metal concentration as the ratio to other constituents in the sediment. The difference in classification and interpretation of each classes might also contribute to little differences in the results.
Conclusion
The contamination level and accumulation status of heavy metals in the bottom sediment of Ondo state coastal marine area, Southwestern Nigeria were assessed in this study. Among the heavy metals determined, Fe was found to have maximum average concentrations in all the sampling stations. The results of heavy metal concentrations showed low contamination by heavy metals. Fishing, transportation and oil exploration activities near the location contributed insignificantly to the contamination of the sediment. Despite the low contamination and accumulation, continuous monitoring of the heavy metals is necessary because of the increasing anthropogenic activities such as boat exhaust system, petroleum mechanized boats for fishing and transportation and oil exploration. The study area is situated in a strategic location characterize with the direct opening of the rivers to the coast upstream, which may eventually increase the heavy metal loading in the sediments.
Acknowledgement
The authors are grateful to Center for Energy and Research Development (CERD), Obafemi Awolowo University, Ile - Ife for the facilities used for this work.
References
- Kontas A (2007) Trace metals (Cu, Mn, Ni, Zn, Fe) contamination in marine sediment and zooplankton samples from Izmir Bay. (Aegean Sea, Turkey). Water Air Soil Pollution. 188: Â 323-333.
- Merian E (1991) Metal and their Compound in the Environment. Weinheim Verlag chemie, Weinheeim. 365.
- Yoshida N, Ikeda R, Okuno T, (2006) Identification and characterization of heavy metal-resistant unicellular alga isolated from soil and its potential for phytoremediation. Bioresour. Technol. 97: 1843-1849.
- Asowata IT, Badejo OO, Onifade OM, Olukoya FF (2015) Spatial Distribution of Trace element of Ala River Sediments, Akure, Southwestern Nigeria. Ife Journal of Science. 17: 109-120.
- Yu W, Zou X (2013) The Distributional Characteristics of Heavy Metal in Jiangsu Province Shoal Sea. Journal of Environmental and Public Health. 23: 1-8.
- Balakrishnan T, Sundaramanickam A, Shekhar S, Balasubramanian T (2015) Distribution and seasonal variation of heavy metals in sediments of Muthupet Lagoon, Southeast coast of India. Journal of Ecological Engineering, 16: 49-60.
- Greaney KM (2005) An Assessment of Heavy Metal Contamination in the Marine Sediments of Las Perlas Archipelago, Gulf of Panama. Master of Science Thesis in Marine Resource Development and Protection School of Life Sciences Heriot-Watt University, Edinburgh.
- Mora DS, Fowler SW, Eyse E, Azemard S (2004) Distribution of heavy metals in marine bivalves, fish and coastal sediments in the Gulf and Gulf of Oman. Marine Pollution Bulletin. 49: 410-424.
- Khan MZH, Hasan MR, Khan M, Aktar S, Fatema K (2017) Distribution of Heavy Metals in Surface Sediments of the Bay of Bengal Coast. Hindawi Journal of Toxicology. 1-7.
- Tam NFY and Wong YS (2000) Spatial variation of heavy metals in surface sediments of Hong Kong mangrove swamps. Evironmental Pollution. 110: 195-205.
- Ahmadipour F, Bahramifar N, Ghasempouri SM (2014) Fractionation and mobility of cadmium and lead in soils of Amol area in Iran, using the modified BCR sequential extraction method. Chemosphere Speciation and Bioavailability. 26: 31-36.
- Kim Y, Kim BK, Kim K (2009) Distribution and speciation of heavy metals and their sources in Kumho River sediment, Korea. Environmental and Earth Sciences. 60: 943-952.
- Chen CW, Kao CM, Chen CF, Dong CD (2007) Distribution and accumulation of heavy metals in the sediments of Kaohsiung Harbor, Taiwan. Chemosphere, 66: 1431-1440.
- Guo T, DeLaune RD, Patrick JWH (1997) The influence of sediment redox chemistry on chemically active forms of arsenic, cadmium,chromium, and zinc in estuarine sediment. Environmental International. 23: 305-316.
- Gielar A, Rybicka EH, Moller S, Einax JW (2012) Multivariate analysis of sediment data from the upper and middle Odra River (Poland). Applied Geochemistry. 27: 1540-1545.
- Ibe AC (1987) Marine erosion on a transgressive mud beach in western Niger delta. Geomorphology and Environmental Management. 337-350.
- Nowrouzi N, Pourkhabbaz A (2014) Application of geoaccumulation index and enrichment factor for assessing metal contamination in the sediments of Hara Biosphere Reserve, Iran. Chemical Speciation and Bioavailability, 26: 99-105.
- Khuntong S, Phaophang C and Sudprasert W (2015) Assessment of radionuclides and heavy metals in marine sediments along the Upper Gulf of Thailand. Journal of Physics: Conference Series. 611: 12-23.
- Dey S, Gupta S, Uma M (2014) Study of Particulate Matter, Heavy Metals and gasoues pollutants at Gopalpur at tropical industrial site in eastern India. Journal of Environmental Science, Toxicology and Food Technology. 8: 1-13.
- Taylor SR, McLennan SM (1985) The Continental Crust: Its Composition and Evolution. Blackwell Scientific Publications, Oxford
- Nasr SM, Okbah MA, Kaseun SM (2006) Environmental Assessment of Heavy Metal Pollution in Bottom Sediment of Aden Port, Yemen. Interlligence Journal of Oceanography, 1: 99-109.
- Bu J, Sun Z, Zhou A, Xa Y, Ma R, et al. (2016) Heavy metals in Surface soils in the Upper Reaches of the Heihe River, Northeastern Tibetan Plateau, China. International Journal of Environmental Research and Public Health. 13: 1-19.
- Tomlinson DL, Wilson JG, Harris CR, Jerrey DW (1980) Problems in the assessments of heavy-metal levels in estuaries and formation of a pollution index, Helgol Meeresunter. Meeresunter, 33: 566-579.
- Hu Z, Wang J, Chen Y, Chen Z, Xu S (2014) Concentration and source apportionment of particulate matter in different funtional areas of Shanghai, China. Atmospheric Pollution Research. 5: 138-144.
- Mmolawa K, Likuku A, Gaboutloeloe G (2011) Assessment of Heavy metals Pollution in Soil along Roadside Areas in Botswana. African Journal of Environmental Science and Technology, 5: 186-196.
- Gupta S, Jena V, Matic N, Kapralova V, Solanki JS (2014) Assessment of Geo-accumulation Index of Heavy metal and source of Contamination by multivariate Factor Analysis. International Journal of Hazardous Materials. 2: 18-22.
- Muller G (1979) Index of Geoaccumulation in Sediments of Rhine River. Geojournal, 2: 108-118.
- Emmanuel A, Cobbina SJ, Adomako D, Duwiejuah AB, Asare W (2014) Assessment of heavy metals concentration in soils around oil filling and service station in Tamale Metropolis, Ghana. African Journal of Environmental Science and Technology. 8: 257-265.
- Buchman MF, (1999) NOAA Screening Quick Reference Tables, NOAA HAZMAT Report 99-1, Seattle WA, Coastal Protection and Restoration Division, National Oceanic and Atmospheric Administration. 12.
- Salah EAM, Zaidan TAZ, Al-Rawi AS (2012) Assessment of Heavy Metals Pollution in the Sediments of Euphrates River, Iraq. Journal of Water Resource and Protection, 4: 1009-1023.
- Iqbal J, Shah HM (2014) Occurrence, risk assessment, and source apportionment of heavy metals in surface sediments from Khanpur Lake, Pakistan. Journal of Analytical Science and Technology. 5:Â 28-40.
- Ololade IA, Lajide L, Amoo OA (2008) Seasonal Metal Distribution in Ondo Sediments, Nigeria. Journal of Applied Scence and Environmental Management. 12: 11-18.
- USEPA (2010) List of contaminants and their maximum contaminant level (MCLs). United State Environmental Protection Agency (USEPA).
- Atiemo MS, Ofosu GF, Mensah HK, Tutu OM, Linda NDM, et al. (2011) Contamination Assessment of Heavy metals in Road Dust from selected Roads in Accra, Ghana. Research Journal of Environmental and Earth Sciences. 3: 473-480.
- Cevik F, Goksu MZ, Derici OB, Findik O (2009) An Assessment of Metal Pollution in surface sediments of Seyhan dam by using enrichment factor, geoaccumulation index and statistical analysis. Environmental Monitoring and Assessment, 152: 309-317.
- Ghrefat, HA, Abu-Rukah Y, Rosen MA (2011) Application of geoaccumulation index and encrichment factor for assessing metal contamination in the sediments of Kafrain Dam, Jordan. Environmental Monitoring and Assessment, 178: 95-109.
Citation: Oluwagbemiga AP, Olatayo AA, Funso AI (2019) Coastal Marine Sediment Heavy Metals Contamination of a Transgressive Mud Beach, Ondo State, Southwest, Nigeria. J Marine Sci Res Dev 9: 267.
Copyright: © 2019 Oluwagbemiga AP, et al. This is an open-access article distributed under the terms of the Creative Commons Attribution License, which permits unrestricted use, distribution, and reproduction in any medium, provided the original author and source are credited.
Select your language of interest to view the total content in your interested language
Share This Article
Recommended Journals
Open Access Journals
Article Usage
- Total views: 4114
- [From(publication date): 0-2019 - Nov 21, 2025]
- Breakdown by view type
- HTML page views: 3176
- PDF downloads: 938