Current Status of Cattle Production System in Nyagatare District-Rwanda
Received: 05-Apr-2017 / Accepted Date: 26-Jun-2017 / Published Date: 03-Jul-2017
Abstract
A study was conducted to characterize the cattle production systems in Nyagatare District, Eastern Province of Rwanda using pre-tested questionnaires, interviews with key informants as well as focus group discussions in a period of two months. The respondents were selected by multi-stage sampling at Sector and Cell1 levels.
Based on the procedure to determine the overall sample size, the result indicated that the majority (98.3%) of farms were privately owned by big families of five to seven members and most farmers (53.9%) had only primary education. Most respondents (52.6%) were in the age range of 41-50 years and were mainly (48.3%) located within three km from trading centres. The farm size averaged 6.5 ± 0.8 ha and most farms (64.7%) were fenced except in Rukomo Sector (50%) where zero grazing prevailed.
Natural pastures (savanna grass land) were the main feed resource, tethering (9%) and communal grazing had diminished. Vita-mineral and salt blocks supplements, hay and crop residues were the predominant supplementary feed stuffs used except in Karangazi and Rwemiyaga Sectors where only vita-mineral block predominated. However maize and rice brans were reported to be the main feed stuffs used in supplementary feeding of lactating cows. Most farmers (89.7%) reported shortage of water as most of the farmers trekked their cattle to the nearest valley dams (59.2%), rivers (21.1%) and a few 6% had water on farms.
Indigenous cattle were predominant (67.03%) followed by cross-breeds (28.37%) and exotics (4.6%) while all farmers kept small ruminants. Natural breeding predominated (74.9%) and most farms (60.6%) had animal houses most of which were (52.8%) temporary. The reported mean age at first calving (AFC) was highest (40.2 ± 0.33) for Ankole and the lowest (29.1 ± 0.50) months for exotic cattle. Calving interval were lower in local breeds than 65.7 ± 3.0 in exotic. The mean dairy milk yield was lowest for Ankole cattle 2.4 ± 0.08 as compared to the exotics (10.42 ± 0.36) and their crosses (7.2 ± 0.34). The main challenges were diseases, shortage of water and feeds and inadequate extension services same results was reported.
1Sectors and Cells are the third and fourth level administrative subdivision respectively in Rwanda.
Keywords: Cattle rearing; Feeding; Breeding; Diseases, Records; Production; Rwanda
4228Introduction
Livestock production has played a major role in the development of countries [1-3] and is currently one of the fastest growing agricultural subsectors in Rwanda; its share of agricultural GDP is already 33 per cent and is quickly increasing [4]. This growth is driven by the rapidly increasing demand for livestock products, which is driven by population growth, urbanization and increasing incomes in developing countries [5]. As income grows, so does expenditure in livestock products [6].
The government of Rwanda regards livestock as an important part in achieving food security for Rwanda, especially in terms of protein requirements and also its potential role in poverty alleviation [7]. Livestock in Rwanda is one of the key pillars for economic growth, poverty reduction as described in the Economic Development and Poverty Reduction Strategy EDPRS 1 [8].
The cattle population in Rwanda is dominated by the indigenous long horned Ankole (Inyambo) cattle which are estimated to be 76% of the national herd [9]. These Ankole cattle have an advantage of being highly adapted to adverse environmental conditions, including tolerance to heat stress and resistance to endemic diseases [8]. Ankole cattle can withstand periodic feed shortage better than exotic breeds; can walk long distances in search of pasture, water and have got an added advantage of producing high quality beef [10].
In the year 2000, the government of Rwanda launched a development program - Vision 2020 with the main objective of transforming the country into a knowledge-based middle-income country, thereby reducing poverty, health problems and making the nation united and democratic. Modernisation of agriculture and livestock production was one of the major strategies of vision 2020. Under this strategy, the livestock sub-sector would be fully modernized by 2020 and Rwanda would be self-sufficient in livestock products with surplus for export particularly milk and dairy products [11]. Emphasis has recently been focused on the replacement of indigenous Ankole cattle with exotic dairy breeds; especially the Holstein Friesian so as to improve dairy productivity in the country [12]. Additionally, there has been a gradual shift from free-range to intensive management practices such as zerograzing and feed supplementation for improved milk yields [13]. In Rwanda the low productivity of cattle has often been attributed to low genetic potential and low standards of husbandry practices such as (breeding, feeding and housing) [11].
Since 2005 in line with vision 2020, (Vision 2020, EDPRS1 2008-2012) the Government of Rwanda started the policy of cattle distribution aimed at intensification of livestock production systems. The One cow per poor Family (Gilinka) 2006-2017 programs, land consolidation and redistribution, the livestock infrastructure support project, and construction of big water sources (valley dams under PDERCU and PADEBER are some of the major government projects aimed at livestock intensification [12]. The challenge remains to design and develop the livestock production systems in such a way that they can contribute to both food security and poverty alleviation, especially in the smallholder sector, without leading to environmental degradation.
Currently there is no adequate information generated detailing the current status of cattle production system, cattle management practices, available feed resource and feeding practices, available breeds, breed improvement practices and breeding systems, animal health situation, reproductive and productive traits and possible challenges in the event of many years of government support towards the transformation process of the production system over the previous decade. In such a scenario it becomes very difficult to plan further interventions. This study therefore aimed at characterization of the cattle production systems in Rwanda using a case of Nyagatare District.
Statement of the Problem
Livestock production in the Eastern Province of Rwanda has undergone many changes since the Tutsi genocide of 1994 including large scale losses of livestock due to the war and epidemics that followed the influx of herds of livestock with post genocide returnees. Since 2005 there has been de-gazetting of Akagera national park to create more livestock grazing area, land reforms with consolidation and redistribution, the government policy of reducing local cattle genotypes to about 40% of national herd.
The provision of livestock infrastructure (valley dams and livestock markets, feeder roads, dairy plants, milk collection centres, AI (artificial insemination) services and Gilinka (one cow per family), were all notable projects towards livestock intensification. However there is still a great challenge of differences in livestock production and management systems that require different interventions in such a way that they can contribute to both food security and poverty alleviation, especially in the smallholder sector, without leading to environmental degradation.
There is lack of information on the current status of cattle production systems in Rwanda in the event of many years of government support towards the transformation process of the production systems. Such information is pre-requisite for planning of further interventions to increase production and also useful for gauging the level of progress accruing from the various interventions.
Materials and Method
Sample size determination
Based on the census of Nyagatare District of 2013, the total number of households keeping cattle in the five surveyed Sectors was 2,490 and using a simplified process of determining the sample size for a finite population (Table 1), the ultimate sample size was determined to be 360 farms [1]. Based on this method, the sample size for each Sector was determined as follows:
| Sector | Total population | Proportion of each sector | Number of selected farmers |
|---|---|---|---|
| Nyagatare | 310 | 12.45% | 45 |
| Karangazi | 907 | 36.42% | 130 |
| SSSRwemiyaga | 650 | 26.1% | 95 |
| Matimba | 331 | 13.3% | 48 |
| Rukomo | 292 | 11.73% | 42 |
| Total | 2490 | 100% | 360 |
Selection of the households.
Table 1:Determination of Sample Size in Selected Sectors.
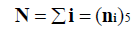
Where N: sample size
i: number of sectors
ni: number of selected farmers in each sector
Sampling technique
A multi-stage sampling procedure was employed to select representative households in five Sectors of Nyagatare District, bearing in mind the differences in production systems within Sectors and Cells of a District. A total of 360 households were randomly selected using systematic random sampling method. Accordingly five (5) Sectors were selected basing on location, cattle population density, total cattle population, predominant rearing system, and level of urbanization. Based on these criteria, 5 sectors namely Nyagatare, Karangazi, Rwemiyaga, Matimba and Rukomo were purposively surveyed (Table 2). In each selected Sector, 50% of administrative Cells were randomly selected and respondents were then randomly selected from each Cell in accordance with sample size.
| SN | Sector | Characteristics |
|---|---|---|
| 1 | Nyagatare | High levels of urbanization, riverine mainly, cross breed cattle on fenced farms. |
| 2 | Karangazi | Large farms and adjacent to Akagera National Park |
| 3 | Rwemiyaga | Large farms and adjacent to Akagera National Park |
| 4 | Rukomo | Small farms mainly rural, improved cattle breeds, poor accessibility of extension services. |
| 5 | Matimba | Medium size fenced farm, river line and shares international borders with Tanzania and Uganda |
Table 2: Criteria for sampling sectors from Nyagatare District.
Research design
The field survey was conducted through three approaches namely, the preliminary survey involving participatory rural appraisal (PRA) with District and Sector veterinarians, farmer group representatives and other stake-holders investigated to gain an overview of the cattle production systems in the area. The information generated was used to select the five study Sectors and development of the survey questionnaire for the second phase of the formal survey.
The questionnaire was pre-tested before the actual data collection on selected respondents in the different Cells of the study area. The formal survey was conducted by pre-trained enumerators in local ikinyarwanda language under close supervision and participation of the academic supervisors. Data were collected through pre-tested semi-structured questionnaires, observation, recall interview, and farm records where available. In addition, secondary data was sourced from periodic reports of District and Sector veterinary officers.
Data handling and analysis
The data were entered into the Statistical Package for Social Science, (SPSS, 2006) version 16 and cleaned of errors and outliers before processing. The processed data were presented in tables, charts and graphs in form of totals, means and percentages. The relationship between variables was determined using cross tabulation and Chisquare tests.
Results And Discussion
Demographic characteristics of the respondents
Age and education level: Most respondents 189 (52.6%) were in the modal range of 41-50 years of age, followed by that of 51 (24.6%) years. The age group of 20-30 had only (3.7%) respondents. This shows that the youth in the study area were very really involved in cattle keeping bearing in mind that youth in most African countries barely participate in rural animal farming. With regard to educational level, most of the farmers 194 (53.9%) had attained only primary level education and only (3.4%) had attained tertiary education. With such low education levels adoption of new technologies is likely to be very slow, although this wouldn’t be an issue when they have access to veterinary and agricultural extension services.
Farm and land sizes: There were differences in the size of landholding between the sectors of Nyagatare District. The mean total farm size in the study area was 6.5 ± 0.8 ha. This was more than the average national household land size of 3.0 ha. The distribution of farm and herd size in all sectors significantly differed (p<0.001) with large sized farms mostly in Rwemiyaga and Karangazi Sectors. Accordingly, Karangazi and Rwemiyaga Sectors also had the highest average herd size of 70 and 68 herds of cattle respectively. Different results were reported by Byenkya [14] in South-Western Uganda.
On the other hand, Nyagatare, Rukomo and Matimba Sectors had an average of less than 40 herds of cattle per household. It is notable that Karangazi and Rwemiyaga Sectors along Akagera National Park and this could explain the large herds and farms size. The vicinity to the National Park leads to minimal human population due to fear of wild animals and their associated diseases. In addition, the urbanisation policy of government encourages intensification of human settlement in centres called Imidugudu [11].
Farm ownership and distance of farms from developed centers: The majority of farms 354 (98.3%) were privately owned and in most cases (64.9%) were less than 3 km from a developed centre and permanent roads. Very few farms (7.8%) were more than 4km away from developed centres and most of the farmers (56.8%) had large families of between 5-8 members. This may indicates that there is easy access of farmers to markets of their products and easy access to inputs and services. Large family-size suggests easy availability of family labor but also high demands for subsistence. The reported family size was higher than Sub-Saharan average of 5.6 [15] but below Rwandan national average of 7.4 [9] which may be attributed to polygamous practices and belief that many children are for safety and wealth as also reported by Agajie et al. [16] who indicated that having many wives is one of the wealth indicators and commonly practiced types of marriage in the Central Rift Valley of Ethiopia.
Current cattle husbandry and management practices in Nyagatare district
Rearing systems and feeding practices: Feeding is an important factor in livestock production. It was observed that grazing in fenced farms was the main rearing system in all Sectors except Rukomo Sector where 50% of the respondents practiced zero grazing. Grazing in fenced farms was mostly reported in the Sectors of Nyagatare 76%, Rwemiyaga 72% and Karangazi 62%. Tethering and communal grazing of cattle were still practiced albeit at low levels, except in Rukomo Sector where communal grazing never existed. Natural pastures (savannah grass land) was still the main feed resource as reported on 233 (64.7%) of the farms. There was a statistical significant difference (P<0.001) in farming systems among different Sectors (Figure 1).

Figure 1: Cattle rearing systems in the study area.
Levels of supplementation in the study area: Most farmers 196 (54.5%) grazed their animals solely on pastures without any supplementation as only (3.6%) of farmers practiced supplement feeding. Of the few that practice supplementary feeding the majority (51.5%) were from Nyagatare Sector followed by Rukomo (31.5%). Planted grazing pastures were being adopted as 151 (41.9%) reported to graze both natural and planted pastures. Napier grass Pennisetum purpureum) was the main planted forage reported 151 (93.2%) for supplementary feeding of grazed animals but also the main feedstuff for zero grazed animals, followed by Chloris gayana (3.1%) and Brachiara. Leguminous forages such as Calliandra, Lucaena leucocephala, Desmodium species, Lablab and Mucuna were also reported by very few farmers. Maize and rice brans were reported to be the main feedstuffs used in supplementary feeding especially for lactating cows. However crop residues of maize, beans and rice and purchased hay were reported to be used in dry season supplementary feeding (46.1%). There was statistically significant difference (XP2<0.05) among the Sectors (Figure 2 and Table 3).

Figure 2: Percentage feed supplementation among sectors in the study area.
| Item | Frequency | Percentage |
|---|---|---|
| Feed stuffs and feeds used ** | ||
| Sorely on pastures | 196 | 54.5 |
| Supplements | 13 | 3.6 |
| Both (natural pasture and supplement) | 151 | 41.9 |
| Main food crops | ||
| Maize | 136 | 92.5 |
| Beans, banana or soya beans residues | 11 | 7.5 |
Table 3: Percentage feeding levels of supplements in the study area.
In Uganda [17] it was reported that although most of the farmers depended on natural pasture grassland to feed their animals they also practiced some supplementary feeding using food crop residues, This could be the reason for low levels of production and growth as reported by TechnoServe [13] and Okello et al. [18]. It was also realised that supplementation of cattle was often not intentional and farmers often doubted its rationale since they argued that it could be a way of teaching cows bad practices of straying on field crops in the neighbourhood.
A few farmers had planted pastures on their farms and this resembles the situation in Uganda FAO where majority of livestock keepers were semi-illiterate on pasture improvement and opted for pastoral system of livestock keeping that is less yielding. This could also be explained by low levels of education observed among the farmers in the study area (Nyagatare). Supplementation was carried out by less than 3% of farmers who used crop residues that are deficient in protein and minerals which are required in complete feeding rations for growth and production [19]. Rice bran was still very minimally used despite being abundant in the area [20].
There was no use of industrial dairy meals, seedcakes and pellets which is indicative of low levels of evolution towards intensification. Lack of supplementation of animal feeding leads to reduced yield in cattle production. Good nutrition practices such forage conservation as silage or hay was not reported as was the case in Uganda. Problems of seasonal availability of roughage feeds can be minimized through conventional feed practices like hay making, silage making and straw treatment so that sustainable supply of roughage feeds can be ensured throughout the year as it was observed that in Nyagatare district a lot of animal feeds are abundant in wet season and very scarce in the dry season.
In addition to keeping animals, this study observed that most farmers (92%) practice mixed farming of livestock and crops with maize and beans being the main crops. The crops were grown for animal nutrition at all firms we visited. This is typical of cattle production in developing countries as stated by Brunori et al. [21] and Dixon et al. [22]. Mixed farming is always a provision of supplements especially during the dry seasons as well as supporting the family in terms of food. However it is indicative of the evolution process of dairy production from the transhuman to Nomadic systems through semi-intensive crop livestock systems before specialisation.
Animal housing and durability of houses: The majority of respondents 218 (60.6%) had animal houses such as calf pen, milking sheds, farm store (Figure 3) and there was no statistical difference (p>0.05) among the different sectors. Most of the houses were temporary in construction (52.8%), semi-permanent (40.8%) and permanent (6.4%). There was no report on sharing human premises with animals on any of the study farms and there was a significant difference (X2 p<0.05) among the Sectors with regard to cattle houses. Rukomo Sector had the highest percentage (69.6%) of semi-permanent cattle houses followed by Nyagatare Sector. Temporally shelters prevailed in all the other Sectors under this study.

Figure 3: Durability of cattle houses in the study area.
Calf pens were the most 144 (66.1%) common animal houses on the farms. However, there were no single pens for calves in all cases. The prevalence of calf pens could be as a result of the delicate nature of the calves as well as the need to keep the calves away from their mothers when being milked.
These results indicated that cattle housing practices are still rudimentary, lacking enough biosecurity measures against common cattle diseases and predators. These results differ from those reported in Tigray National Region of Ethiopia [23], where livestock were housed together with humans. The difference could also be as a result of timing. It is now almost a decade from the report most probably Nyagatare also was at that status in 2007.
Farm labor: Family labour prevailed 262 (72.8%) as hired labour was really (23.8%) reported. Very few farmers 9.1% hired more than three casual labours on their farms. With such low labour levels, management of the large herds of cattle on large acreages of land may not be successful. This may therefore account for low levels of technology adoption observed on most farms.
Animal identification and record keeping: Traditional methods of animal identification dominated as most farmers 347 (96.4%) reported identifying their cows based on body color, shape of horn, sex, age and origin of animal. Accordingly, cows had different names and attributes. Modern methods of identification such as ear tags 13 (3.6%) were very rarely reported. There was no significant difference among the Sectors (p<0.014) with regard to animal identification. An overwhelming majority of farmers 327 (90.8%) never kept any records, and of the few 30 (8.3%) that did, kept records informally (individual memory, loose papers or exercise books).
Only three farmers kept modern records 3 (0.8%) using computers. The records that were mainly kept included production, breeding, purchases, sales, mortality, calving, culling, diseases and feeding records (Table 4). This has a negative effect on giving reliable information about the performance of their cattle and can lead to poor management in terms of feeding, breeding and financial aspects. Animal identification is the first step in record keeping, yet it was found to be very rudimentary. This situation resembles that reported in East Mamprusi Districts of Ghana [24] where the use of records in ruminant production for assessment of production, breeding, purchases, sales, mortality, calving, culling, diseases and feeding their animals was low.
| Item | Frequency | Percentage |
|---|---|---|
| Identification of animals* Phenotypically (names, color patterns and horn shape) |
347 | 96.4 |
| Ear tag | 13 | 3.6 |
| Keep records | ||
| Yes | 33 | 9.2 |
| No | 327 | 90.8 |
Table 4: Percentage of animal identification and record keeping in Nyagatare district.
Water resources in the study area: With regard to water sources, the majority of surveyed farms 323 (89.7%) had no water near or within their farm. Accordingly, most farmers trekked their cows to the nearest public valley dam 213 (59.2%), rivers (21.1%) (Muvuba and Akagera) and only 6% of respondents had access to piped water, while 2.6% of the farmers had water reservoirs in form of polythene sheeting and water tanks. It is noteworthy that the public water sources were often far from the farms as 151 (41.9%) of respondents reported a distance of 3-5 km (Table 5).
| Item | Frequency | Percentage |
|---|---|---|
| Distance to water (Km) | ||
| Near and within the farm | 70 | 19.4 |
| Less than 1 | 133 | 36.9 |
| 3-5 | 151 | 41.9 |
| 5-8 | 4 | 1.1 |
| Above 8 | 2 | 0.6 |
Table 5: Distance of water sources from the farms.
The results showed that water was not readily available in the study area despite the existence of rivers and a few public water dams. When animals trek very long distances in search of water, they spend a lot of energy and also become more exposed to communicable diseases and breeding can no longer be controlled. On the other hand, the track routes and areas around water sources are exposed to heavy degradation and soil erosion. High performing exotic breeds such as Friesian and their crosses are very unlikely to perform satisfactorily or even to survive under such conditions of water scarcity and deprivation.
This general trend of water sourcing is in agreement with Tesfaye [25] and Zewdie [26] who reported similar results in Debre-Birhan area in Ethiopia. This could be due to the fact that Nyagatare District experiences long dry seasons and that the main water source (valley and rivers) dry out fast as a common phenomenon. The poor quality of water could be the reason for the reported prevalence of helminthiasis among the animals on the study farms in the Blue Nile basin observed similar outcomes with high occurrences of diseases with poor water sources [27].
Cattle herd structures and composition
Herd composition: Indigenous (local) Ankole cattle were the predominant livestock kept in all Sectors, followed by cross-breeds with European cross breeds. Pure-bred dairy cattle were still in the study area. In terms of standard livestock units, all the cattle breeds constituted 90.6%, followed by goats (7.9%) and sheep (1.5%). There was no difference in average sheep flocks per Sector 1.17 ± 3.0. However, the average goat flock size was significantly different (t=1.4, P<0.05) among the sectors (Table 6). With regard to multite-species composition of farm flocks, the keeping of small stock with cattle is still a historical calture of Rwanda society.
| Sector Names | Pure cattle breeds | Cross breeds | Indigenous breeds | T. Goats | T. Sheep |
|---|---|---|---|---|---|
| Nyagatare | %96 | %398 | %1100 | 104 | 09 |
| (6.0%) | (24.97%) | (69%) | |||
| Matimba | 101 | 326 | 545 | 131 | 24 |
| (10.9%) | (33.1%) | (56%) | |||
| Rukomo | 27 | 204 | 204 | 42 | 19 |
| (6.3%) | 46.87% | (46.9%) | |||
| Rwemiyaga | 58 | 435 | 1231 | 192 | 59 |
| (3.4%) | (25.2%) | (71.4%) | |||
| Karangazi | 43 | 632 | 1638 | 260 | 74 |
| (1.9%) | (27.3%) | (70.8%) | |||
| Average % Breeds | 5.68 | 31.5 | 62.82 | 729 | 185 |
| 7.9% | 1.5% | ||||
| Sub-total | 325 | 1995 | 4718 | 7038 | 7952 |
| Percentage | 4.6% | 28.37% | 67.03 | 90.6% |
Table 6: Percentages composition of livestock herds by species and breed in the study area.
Cattle herd structure: The herd age, sex composition (Table 7) revealed that mature cows averaged 75.5% which is much higher than expectation in a stardy state cattle population. This may be due to continous importation of mature breeding cows and/or exceesive motality of calves. It is also noteworhty that voluntary offtake of mature cows was reported to be low as a large propotion of the herds was above 7 years of age. For example 79.7 of the local cattle herd were above 7 years of age.
| Cattle Categories Mature local cows |
Herd of cattle 3624 |
Percentage in the total sample 73.0 |
Percentage within the breed of the sample 76.8 |
|---|---|---|---|
| Mature cross breed | 1130 | 22.8 | 57 |
| Mature pure breeds | 209 | 4.2 | 64.3 |
| Totalmaturecows | 4963 | 75.5 | |
| Local breed calves | 346 | 5.7 | 7.8 |
| Cross breed calves | 378 | 5.8 | 20.6 |
| Pure breed calves | 43 | 0.7 | 13.9 |
| Total calves | 767 | 11.7 |
Table 7: Age sex proportion of the cattle herds in the surveyed population.
The results of the study suggested that farmers kept on rearing animals for the purpose of milk production as the composition is characterised by higher percentage of female cattle compared to calves or bulls. The proportion of cows was far higher compared to 30.45% on Boran breed in Kenya given that the breed was for beef production [28]. These results are also similar to those observed in pastoral cattle production systems by O‘Leary among the Rendile of Marsabit Kenya Serunkuuma and Olson [29] among the Bahima of Nyabushozi Uganda and Ocaido et al. [30] among the pastoralist of Mbarara (Uganda) where it was noted that pastoralists kept a higher female cattle composition geared towards herd build up and milk production.
Cattle production traits
There were significant differences between the different cattle breeds with regard to production traits (Table 8). The reported mean age at first calving (AFC) was 40.2 ± 0.33, 31.3 ± 0.40, 29.1 ± 0.50 months for Ankole (local), cross breed and exotics, respectively. Calving interval was lower in local breeds than in exotics, crosses being intermediate, but crosses and exotic breeds were significantly (t=3.2, p<0.05) younger at first calving than the locals. The indigenous cows had the least mean dairy milk yield of 2.4 ± 0.08, cross breed 7.2 ± 0.34 and exotics 10.42 ± 0.36. There was statistical significant difference (t=10.42, P<0.05) in amount of milk produced among different breeds.
| Animals | Locals | Crosses | Exotics |
|---|---|---|---|
| Calving-rate (%) | 42.3 ± 0.45 | 47.9 ±1.7 | 65.7 ±3.0 |
| Age at first calving (month) | 40.2 ± 0.33 | 31.3 ± 0.40 | 29.1 ± 0.50 |
| Lactation length (month) | 6.7± 0.13 | 8.5 ± 0.14 | 9.4. ± 0.12 |
| Uncorrected average daily MY (1)* | 2.4 ± 0.08 | 7.2 ± 0.34 | 10.4 ± 0.36 |
| Lactation yield (Litters) | 494 ± 21 | 1868 ± 91 | 2995 ± 108 |
**Statistical significant difference (t=1.4, P< 0.05) in milk produced among different breeds.
Table 8: Average production parameters of different breed types of cattle in study area.
Weighted mean mortality rates (± s,e.)
According to Perry et al. [31], multiple species are often reared by poor smallholder farmers in tropics to avert risk and their production performances are always low. The cows kept often have local breeds having high age at first calving 40.2 ± 0.33 months compared to their counterparts, i.e., 33.3 ± 0.40 and 29.1 ± 0.50 months for cross-breed and exotics, respectively.
Calving interval in this study was low in local breeds than that reported by Taye [32] in Ethiopia where Sheko breed had 54.1 months and Fakoya and Oloruntoba [33] reported 53.1 months for Raya- Sanga cattle. The difference could be as a result of genetic makeup that may influence maturity or even body size as in most cases, issues regarding to animal production are dependent on animal size. The management factors especially nutrition determine pre-pubertal growth rates and reproductive development [34]. Also the differences in the reproductive performance of indigenous cows reported by the different researchers might be attributed to the existing differences in nutritional and reproductive managements among the smallholder cattle keepers in different parts of the country as this was also observed as there was a statistical significant difference (P<0.05) in the amount of milk produced among different sectors.
Cattle mortality rates
Regardless of breeds in all Sectors, calves reportedly had higher mortality rates than all other age sex groups (Table 9). However, the mortality of all breeds was significantly higher (t=14.16) in the exotics than in the local (9.7 ± 0.05). Calves in exotics had higher significant difference (t=3.3, p>0.05) mortality than the local breeds and the calf mortality of crosses were intermediate. The main causes of mortality were reported to be diseases (66.6%), followed by lack of feeds 24.5%. In a study on dairy farms in four agro-ecological zones of Ethiopia [35], observed that about 33% of the respondents indicated that diseases were the major cause of calf mortality in cattle, while up to 6% of the causes of mortality in calves were unclear to the farmers. Given that diseases are a major constraint to the improvement of the livestock industry in the tropics, [36] as they decrease production and increase morbidity and mortality Mwacharo and Drucker [37] special efforts should be put on disease diagnosis treatment and management to enable efficient cattle herd growth and production in Rwanda.
| Animals | Locals | Crosses | Exotics |
|---|---|---|---|
| Calves | 23.5+0.56 | 25.0+0.43 | 28.0+0.40 |
| Heifers | 3.4+0.07 | 3.4+0.07 | 7.0 ± 0.05 |
| Cows Bulls | 4.4+0.07 3.4+0.15 |
6.2 ± 0.09 4.8 ± .03 |
10.2+0.10 8.9 ± 0.08 |
| Steers | 6.8+0.44 | 2.9+0.04 | 8.3 ± 0.03 |
| Overall | 8.6+0.12 | 10.6+0.11 | 14.0 +0.11 |
Table 9: Various grades of indigenous-exotic and crosses.
Animal breeds and breeding practices
The majority of farmers (67.03%) kept the indigenous Ankole cattle followed by cross breeds (28.37%) and only (4.6%) farmers kept exotic breeds. The major breeding practice used was upgrading of indigenous cow with pure and cross-bred exotic bulls mainly of Frisian breed. The use of artificial insemination (AI) for upgrading was still in its infancy as only 3.75 of farmers sorely used AI and 21.35% farmer used both Artificial insemination (AI) and natural mating. Breeding practices were significantly different in different Sectors (p>0.04). This differs with the report by Wollny [38] on conservation of local animals in Africa.
Natural breeding with bulls still remains the dominant mode of breeding mostly in the Sectors of Karangazi, Rwemiyaga with an average of more than 70%, whereas Rukomo had the highest percentage AI (52%) practice followed by Nyagatare Sector. This is attributed to the fact that the farms in Rukomo had small herds, rarely crosses and exotics and had limited space for grazing and therefore mainly use AI as they could not afford to keep the bull on their small farms. It was also further noted that in the Sector of Rukomo together with Nyagatare Sector had one cow per family (Girinka project) that promoted use of AI with semen offered at subsidiary prices.
The challenge of getting inseminator and veterinary services was reported as a factor hindering cattle production in the area. In the Sectors of Karangazi, Rwemiyaga and parts of Matimba, majority of the respondents (63.1%) preferred natural bull service (natural mating) to artificial insemination for their own reasons. They were of the view that artificial insemination had a high chance of resulting in the birth of male calves, and the belief that natural (bull) service had a high degree of conception.
Prevalence of cattle diseases and their management
Different diseases were encountered in the study period (Table 10). Trypanosomiasis was mostly reported 243 (73.4%) especially in Sectors of Karangazi 85%, Rwemiyaga 82.8% bordering the Akagera River and National Park. Helminthiasis was also reported to be a major disease burden especially in the Sectors of Matimba (67%), Rukomo (65%) and Nyagatare (64%), which had high proportions of cross and pure- bred dairy cows. Tick-borne diseases were relatively less reported. However they were common in the Sectors with a high proportion of cross and pure-bred dairy cows. Similar results were reported by Ruhangawebare [39] in Nyabushozi in South-Western Uganda.
| Diseases | Nyagatare | Matimba | Rwemiyaga | Karangazi | Rukom | Total % | P-value |
|---|---|---|---|---|---|---|---|
| Trypanosomiasis* | 34 (56.2) | 41 (63.9) | 83 (82.8) | 62 (85) | 24 (47.8) | 243 (67.5) | 0.009 |
| Tick borne diseases* | 15 (37.5) | 12 (16.4) | 25 (20.7) | 33 (34) | 4 (13.8) | 89 (24.7) | 0.009 |
| Warms* | 27 (67.5) | 53 (72.6) | 57 (47.5) | 52 (53.6) | 18 (62.1) | 207 (57.5) | 0.005 |
| Skin diseases* | 5 (12.5) | 32 (43.80) | 31 (25.6) | 13 (13.4) | 2 (6.9) | 83 (23.1) | 0.001 |
| Mastitis | 12 (30) | 17 (23.3) | 29 (24) | 16 (16.5) | 5 (17.2) | 79 (21.9) | 0.42 |
| FMD | 0 | 0 | 0 | 0 | 0 | 0 | 0 |
| CBPP | 0 | 0 | 0 | 0 | 0 | 0 | 0 |
| Others(Blindness, Brucellosis) | 2 (5) | 8 (10.9) | 14 (11.5) | 10 (10.2) | 1 (3.4) | 35 (8.2) | 0.43 |
* Statistically significant .
Table 10: Percentages of common diseases reported sectors.
Infectious viral and mycoplasma diseases were not reported in all Sectors during the study period which is indicative of a high level of infectious disease prevention and control measures in Nygatare District there was a statistical significant difference (P<0.005) in reporting cattle diseases in various Sectors. Control of tick-borne diseases was mainly by spraying acaracides using bucket spraying pumps 341 (94.7%). The other used methods used were hand dressing, pour-ons and hand picking. Hand picking of ticks was mainly reported in Rukomo Sector which could be attributed to the very small herd size and ignorance of effective methods of tick control. Use of deep tanks and spay races was not reported in any Sectors which could be attributed to the very high cost of these technologies.
It was noteworthy that mastitis was one of the least reported (23.1%) cattle diseases. This is indicative of high levels of udder and milk hygiene which could be attributed to the vigilance of milk processing industry in Nyagatare and the recent East African diary development project and TechnoServe that trained farmers in milk hygiene.
Farmers’ challenges and constraints
Cattle disease were reported 337 (93.6%) to be the main challenge faced mostly in sectors of Karangazi 96.9% and Rwemiyaga 93.4%. Followed by lack of water 323 (89.7%) and it was statistically significant different pbreeding facilities 260 (72.2%). lack of information 207 (57.5%), extension workers and lack of land were also statistically significant p>0.003.The other constraints included: lack of capital, housing, price fluctuation and theft. The above challenges deserve immediate attention so as to enhance cattle production and the evolution process.
Conclusion
Cattle production systems in Nyagatare are still largely extensive or semi-intensive with low levels of intensification. Out-grazing on natural grasslands, on small pieces of fenced land predominates. Good dairy practices such as record keeping, supplementary feeding, calf housing, pasture improvement, artificial insemination and animal identification were still rudimentary. As a consequence growth and production parameters were still very low. Age at first calving (AFC) ranges from 40.2 ± 0.33 for indigenous cattle to 29.1 ± 0.50 months for exotics while calving rate is 42.3 ± 0.45 for local cattle and 65.7 ± 3.0 for exotics and average daily milk yield ranges from 2.4 ± 0.08 in local cattle to 10.42 ± 0.36 for exotic cattle. The cattle disease situation is also still problematic as trypanosomiasis and helminthiasis still prevail at high levels, leading to high mortality rates.
The herd structure shows signs of instability as mature cows averaged 75.5% which is much higher than expectation in astardy state cattle population. Lack of water, feed shortage during dry season, inadequate breeding facilities including veterinary services, lack of information and extension workers, small pieces of land, meagre investment capital, ineffective cattle premises, price fluctuation and lastly stock theft are the prevailing challenge to improved cattle production in Nyagatare District.
Recommendations
There is need for a concerted effort between cattle farmers, extension workers, researchers and input supplies to address the challenges of cattle production in Nyagatare District. Relevant technologies for genetic improvement of cattle forage production and conservation, dry season cattle feeding, integrated pest management, efficient cattle premises etc, abound. The National Agricultural Research System (NARS) and Rwanda Agricultural Board (RAB) should work with farmers to conduct applied research at farm level to fast track the adoption of relevant technologies. Locally available feedstuffs such as rice straw, maize stover and cereal brains should be harnessed for incorporation into cattle rations. Water harvesting technologies from homestead roofs, rain water run-off and seasonal streams should be given special attention.
There is a need for strengthening cattle farmer co-operatives so as to ensure synergy and collective action in marketing and acquisition of inputs. The Government of Rwanda should increase more water sources in all the Sectors of the region, train farmers in water resource management and further support research and extension activities in the livestock production sector. The district veterinary officer should develop short courses for training cattle farmers and farm managers in areas of cattle feeds and feeding, AI, diseases management and control.
Conflict of Interest
We certify that there is no conflict of interest whatsoever in this publication. Open Access this article is distributed under the terms of the Creative Commons Attribution 4.0 International License (http://creativecommons.org/licenses/by/4.0/), which permits unrestricted use, distribution and reproduction in any medium, provided you give appropriate credit to the original author(s) and the source, provide a link to the Creative Commons license, and indicate if changes were made.
Acknowledgement
Special gratitude goes to Borlaug Higher Education for Agriculture Research and Development (BHEARD) for the invaluable financial support towards this study work supported by the United States Agency for International development, as a part of the Feed the Future initiative, under the CGIAR Fund, award number BFS-G-11-00002. In the same vein, the Government of Rwanda is also recognized for its support through the College of Agriculture Animal Science and Veterinary Medicine (CAVM) of the University of Rwanda. Am further grateful to the College of Veterinary Medicine, Animal and Bio-medical sciences of Makerere University (Uganda).
References
- Krejcie RV, Morgan DW (1970) Determining sample size for research activities. Educ Psychol Meas 30: 607-610.
- Okello S, Sabiiti EN, Schwartz HJ (2005) Analysis of factors affecting milk yield of Ankole cows grazed on natural range pastures in Uganda. African Journal of Range & Forage Science 22: 149-156.
- Okech SG (2000) Structural characteristics of the hooves of cattle in free-range management system. Msc. Thesis Makerere University. Kampala.
- Mubashankwaya I (2005) Contribution of the HPI project to dairy cattle breeding in Rwanda: case of Byumba province.Memoire, UNR Butare.
- Delgado C (2005) Rising demand for meat and milk in developing countries: implications for grasslands-based livestock production, in grassland: a global resource. The Netherlands: Wageningen Academic Publishers, pp. 29-39.
- Rosegrant MW, Fernandez M, Sinha A, Alder J, Helal A, et al. (2009) Looking into the future for agriculture and AKST, in agriculture at a crossroads eds mcintyre BD, Herren, pp. 307-376.
- Rutamu I (2008) Investment opportunities in the dairy sub-sector of Rwanda. SNV (Netherlands development organisation) & IFAD (International fund for agricultural development) Kigali.
- Kugonza DR, Bareeba FB, Petersen PH (2001) Response to phenotypic screening of mubende meat goats. Muarik Bull 4: 18-24.
- minagri (2009) psta ii: strategic plan for the transformation of agriculture in Rwanda-phase ii kigali: rwanda ministry of agriculture. National institute of statistics of Rwanda 2012 population and housing census (provisional results).
- MINALOC (2003) National strategy framework paper on strengthening good governance for poverty reduction in rwanda, ministry of local government and social affairs, Government of Rwanda, Kigali.
- TechnoServe (2008) Dairy value chain in Rwanda: A report for the east africa dairy development program. Washington, DC.
- Byenkya GS (2004) Impact of undesirable plant communities on the carrying capacity and livestock performance in pastoral systems of south-western Uganda. Libraries.
- Steinfeld H, Gerber P, Wassenaar T, Castel V, Rosales M, et al. (2006) Livestock`s long shadow- environmental issues and options. FAO
- Agajie T, Ebrahim J, Sitotaw F, David G, Smith (2005) Technology Transfer Pathways and Livelihood Impact Indicators in Central Ethiopia. J Trop Anim Health Prod 37: 101-122.
- Mwebaze SMN (2002) Country pasture/forage resource profiles. In Grassland and pasture crops. Rome, Italy, FAO.
- Okello S, Sabiiti EN, Schwartz HJ (2005) Analysis of factors affecting milk yield of Ankole cows grazed on natural range pastures in Uganda. Afr J Range Forage Sci 3: 149-156.
- Modderman AML (2010) Dairy cooperatives in Musanze district, Rwanda. A research to explore future prospects for three dairy cooperatives in the Musanze district, Northern Province of Rwanda.
- PADEBL (2011) Dairy cattle development support project. Kigali: MINAGRI.
- Brunori G, Jiggins J, Gallardo R, Schmidt O (2008) New Challenges for Agricultural Research: Climate Change, Food Security, Rural Development, Agricultural Knowledge Systems. The Second SCAR Foresight Exercise, Synthesis Report: EU Commission Standing Committee on Agricultural Research.
- Dixon J, Gulliver A, Gibbon D (2001) Farming systems and poverty: improving farmers’ livelihoods in a changing world. Rome and Washington, DC, FAO and World Bank.
- Gebiremedh B, Fernandez-Rivera S, Hassena M, Mwangi W, Ahmed S (2007) Maize and livestock: Their inter-linked roles in meeting human needs in Ethiopia. ILRI Research Report 6.
- Turkson PK, Naandam J (2006) Constraints to ruminant production in East Mamprusi Districts of Ghana. Ghana Journal of Agriculture Science 39: 155-164.
- Tesfaye M (2007) Characterization of cattle milk and meat production, processing and marketing system in Metema district, Ethiopia, MS thesis Hawassa Univ, Ethiopia.
- Zewdie W (2010) Livestock production systems in relation with feed availability in the Highlands and central rift valley of Ethiopia, MSc Thesis Haramaya University.
- Descheemaeker K, Tilahun A, Amare H (2009) Livestock and water interactions in mixed crop-livestock farming systems of Sub-Saharan Africa: Interventions for improved productivity. Colombo, Sir Lanka: International Water Management Institute, pp. 44.
- Rewe TO, Indetie D, Ojango JMK, Kahi AK (2006) Breeding objectives for the Boran breed in Kenya: Model development and application to pasture-based production systems. Anim Sci J 77: 63-177
- Serunkuuma D, Olson K (2001) Private Property Rights and Overgrazing: An Empirical Assessment of Pastoralists in Nyabushozi County, Western Uganda. Econ Dev Cult Change 49: 769-792.
- Ocaido M, Otim CP, Okuna NM, Erume J, Ssekitto C, et al. (2005) Socio-economic and livestock disease survey of agro-pastoral communities in Serere County, Soroti District, Uganda. Livest Res Rural Dev 17.
- Perry BD, Randolph TF, McDermott JJ, Sones KR, Thornton PK (2002) Investing in animal health research to alleviate poverty. Nairobi: International Livestock Research Institute (ILRI), pp. 148.
- Taye T (2005) On-farm phenotypic characterization of Sheko breed of cattle and their habitat in Bench Maji Zone, Ethiopia. Alemaya University, Ethiopia.
- Fakoya EO, Oloruntoba A (2009) Socio-economic determinants of small ruminants production among farmers in Osun state, Nigeria. Journal of Humanities, Social Sciences and Creative Arts 4: 90-100.
- Butkeviciene E (2009) Social Innovations in Rural Communities: Methodological Framework and Empirical Evidence. Social Sciences 1: 80-88.
- Elliott AM, Mpairwe H, Quigley MA, Nampijja M, Muhangi L, et al. (2005) Helminth infection during pregnancy and development of infantile eczema. Jama 294: 2028-2034.
- Devendra C, Chantalakhana C (2002) Animals, poor people and food security. Opportunities for improved livelihoods through efficient natural resource management. Outlook Agric 31: 161-175
- Mwacharo JM, Drucker AG (2005) Production objectives and management strategies of livestock keepers in South-East Kenya: Implications for a breeding programme. Trop Anim Health Prod 37: 635-652.
- Wollny CBA (2003) The need to conserve farm animal genetic resources in Africa: should policy makers be concerned? Ecological Economics 45: 341-351.
- Ruhangawebare GK (2010) Factors affecting the level of commercialization among cattle keepers in the pastoral areas of Uganda. Diss Makerere University.
Citation: Eugene M, Francis M, Tukei M, Eugene GN, James OA (2017) Current Status of Cattle Production System in Nyagatare District-Rwanda. Rheol: open access 1: 108.
Copyright: © 2017 Eugene M, et al. This is an open-access article distributed under the terms of the Creative Commons Attribution License, which permits unrestricted use, distribution, and reproduction in any medium, provided the original author and source are credited.
Select your language of interest to view the total content in your interested language
Share This Article
Open Access Journals
Article Usage
- Total views: 8638
- [From(publication date): 0-2017 - Aug 25, 2025]
- Breakdown by view type
- HTML page views: 7474
- PDF downloads: 1164