Review Article Open Access
Development of an On-line GC System using Existing Retired Equipment
Yuhui (Henry) Zhao*EPCOR Utilities Inc., Edmonton, Alberta, Canada
- *Corresponding Author:
- Yuhui (Henry) Zhao
EPCOR Utilities Inc., Edmonton, Alberta, T5K 0A5, Canada
Tel: 780-412-7612
E-mail: YZHAO@epcor.com
Received date: November 22, 2013; Accepted date: February 28, 2014; Published date: March 04, 2014
Citation: Zhao YH (2014) Development of an On-line GC System using Existing Retired Equipment. J Anal Bioanal Tech S12:008. doi: 10.4172/2155-9872.S12-008
Copyright: © 2014 Zhao YH. This is an open-access article distributed under the terms of the Creative Commons Attribution License, which permits unrestricted use, distribution, and reproduction in any medium, provided the original author and source are credited.
Visit for more related articles at Journal of Analytical & Bioanalytical Techniques
Abstract
To ensure drinking water quality, continual monitoring of the volatile organic compounds (VOCs) in the source water and the treated water is very important for any water treatment plant. On-line, real-time information is crucial to water treatment engineers and operators. The concentration of VOCs provides such information. For VOCs analysis, gas chromatography (GC) is one of the best techniques due to its high sensitivity and selectivity. As a result, an inhouse on-line GC System was developed for this purpose at a water treatment plant. It included the following parts: a stream selection device to connect two sample streams; a self-cleaning filter to remove sands and suspended solids; a Purge-and-Trap (P&T) device to extract and concentrate the volatile compounds; a GC (from Hewlett-PackardTM) equipped with a Flame Ionization Detector (FID) to identify and quantify the compounds; a computer with WindowsTM XP plus ChemStation to control the sampling valves through a DAQ (from National InstrumentsTM) and to control the GC and P&T through a GPIB-USB interface (from AgilentTM). To minimize cost in the development of this system, shelved GC and P&T were used. These instruments have been retired from regular use but still in good working condition.
Keywords
On-line; GC; Purge-and Trap; Water treatment
Introduction
There is no doubt that drinking water safety is of the ultimate importance for general public, water treatment plants and drinking water distributors. To monitor the drinking water quality, an on-line GC was developed in our laboratory with existing retired equipment.
Volatile Organic Compounds (VOCs), along with other possible contaminants affect the taste of the drinking water and may present a health risk if it exceeds the acceptable level [1]. For example, disinfection products such as Trihalomethanes (THMs) are one of these VOC groups. The generation of these by-products greatly depend on the amount of available organic carbon in the raw water. Therefore, decisions for the treatment processes and chemical doses are often based on the quality of raw water [2]. As a drinking water provider, it is necessary to monitor the water quality, including the VOC level, before, during, and after the water treatment process.Monitoring of VOCs can be done by repeatedly taking samples and analyzing them 24 hours a day, all year around, but it is more efficient to put an instrument in the production line, let the instrument take the sample, finish the analysis, and automatically report the results to the operator and the quality assurance personnel. To do this, an on-line system is required.
To meet the requirements of water quality guidelines from relevant jurisdictions, low detection limits are required for most of the measured organic compounds. The most common method of measuring VOCs in water samples is Purge-and-Trap (P&T) coupled with a Gas Chromatography with Flame Ionization Detector (GC-FID) [3]. This is mainly due to its high resolution, simplicity, reliability, wide linear range, and relatively high sensitivity. This project uses this technique.
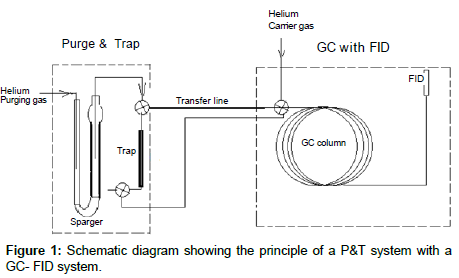
The basic principle and operation of these instruments can be found in the user’s manuals [4,5] and is illustrated in Figure 1. Briefly, a water sample is introduced in the sparger on the P&T device, and the VOCs (analytes) are extracted from the water matrix by bubbling a steady flow of helium through the aqueous sample. The purged organic compounds are trapped and concentrated onto an absorbent trap. The analytes are then released by heating the trap onto the head of the column in a GC instrument. A stream of carrier gas (usually helium or hydrogen) flowing through the column under a predefined temperature program separate and elute the compounds from the column. The compounds eluted from the column reach the FID and are then identified by their retention times by comparing to the calibration standards. Quantitation is achieved by a standard calibration.
For those organizations willing to invest large amount of money in analytical equipment, there is commercial on-line GC system available on the market, for instance by WASSON™ Instruments. However, it is a relatively big financial investment to purchase, install and operate. In this paper, a built- in-house unit using retired equipment is described.
Equipment Selected for this Project
The derivation of the equipment selection is as follows: The equipment must be reliable, readily available; easy to operate, of minimum capital and operational cost. For the sake of developing and testing, on one hand, it should be operated as a stand-alone instrument; on the other hand, it should be computer controllable for continuous analysis.
HP 5890 II GC - retired but in good working condition
The gas chromatograph is the centerpiece of equipment for this project. It is the most complicated and expensive component. Once the decision on the selection of the GC is made, the other equipment to be selected must be compatible with the GC. HP (now Agilent™) GC has a good reputation for its reliability. In our laboratory, and probably in every other organic laboratory in North America, it is the most widely used GC instrument of choice. It is often the case multiple units of these GCs in good working condition are kicking around in the lab. The HP 5890 series is very common and is likely readily available. The HP5890 II (or HP5890 II Plus) was chosen over the model HP5890 due to its computer controlling ability. Configuration of the GC is listed in Table 1. Detailed specifications can be found in its user’s manual [4].
| Device (new or used) | Model | Features | Reference |
|---|---|---|---|
| GC (used) | HP5890 II | GPIB interface; Remote control ready; FID; DB 624 column; Chemstation control or stand alone |
[4] |
| Purge & Trap (used) | LSC 3100 | Hand held device control or computer control; Single sample or scheduled run possible. |
[5] |
| Power Supply (used) | MW S150-24 | Input:110 – 120 VAC 3.2 A ; Output: +24 VDC 6.5 A |
[8] |
| Solenoid V1 (used) | ASCO Redhat II | 3 way; 24VDC, 11.6W; Pressure limit 100 psi |
[8] |
| Solenoid V3 (used) | ASCO Redhat II | 3 way; 24VDC, 11.6W; Pressure limit 100 psi |
[8] |
| Solenoid V4 (used) | ASCO Redhat | 2 wayNC; 12-24VDC, 2W; Pressure limit 100 psi |
[9] |
| NI DAQ (new) | USB 6525 | Individual relays built in; 8 Isolated Digital Input channels +/- 60V DC ; 8 Isolated Switching channels +/- 60V DC; USB connection Drive - NIDAQ951f1; Programmable under MATLAB™ |
[6] |
| GPIB/USB adaptor | Agilent 82357B | [10] | |
| Computer (old) | AMD Athlon™ 64×2 Dual | Windows XP Professional Service Pack 3; Chemstation vA.10.02 with OI Library Suite 15; NI-DAQ drive; MATLAB™Library; Microsoft Excel™ |
Table 1: Equipment and their features used in this project.
Tekmar™ LSC 3100 Purge-and-Trap - retired but in good working condition
There are many brands of P&T devices on the market, while one of the most often used is from Tekmar™. The obsolete LSC 3100 was chosen over newer versions such as Tekmar’s Velocity or Stratum models mainly due to this P&T’s stand-alone capabilities. We were fortunate to have a retired unit in our lab that was still in good working condition. The description and features of this instrument can be found in the user’s manual [5].
Auto-sampler - built in-house
Tekmar™ LSC 3100 P&T is a consecutive sample processor. In another words, the sample cannot be continuously introduced into the system. To put this device on-line, an auto-sampler has to be put in front of it. To monitor the quality of raw and processed water, and the effectiveness of individual stage of treatment process, more than one stream often needs to be monitored. This can be done by having one on-line system for each individual stream, or better having multiple streams feed into one shared instrument. In order to save money for this project the second approach of having two streams share the one instrument was employed. For a water treatment plant, the source water often varies with the change of seasons, especially during the spring run-off period. Sediment, color, turbidity, dissolved and suspended material change significantly throughout the year. The sample intake can become clogged very quickly by sediments in raw water of poor quality. For an on-line system to work properly, the sample, especially the raw water sample, has to be filtered before being introduced into the analytical system.
It is hard to find a commercial auto-sampler directly coupled to the P&T without modification. Also, the commercially available auto-samplers usually do not have stream selecting function and solid removing capability. Thus, we decided to build our own auto-sampler in-house. The detailed design and construction of this device are described in the following sections.
Data and controller system
To make the system run automatically, the following hardware and software is necessary: Hardware: A PC with USB ports; an Agilent™ GPIB/USB 82357B [6] Interface; a National Instruments™ DAQ USB 6525.Software: Windows™ XP Professional Service Pack 3 (or higher); Agilent™ Chemstation ver A 10.02 (or higher) with OI Library Suite 15.0; a valve control drive (programmed in-house).
Accessories
Additional accessories are also required: DC power supply; custombuilt Tester/Initiator; manual valves; connection tubing; wires.
Construction of the System
Building the auto-sampler
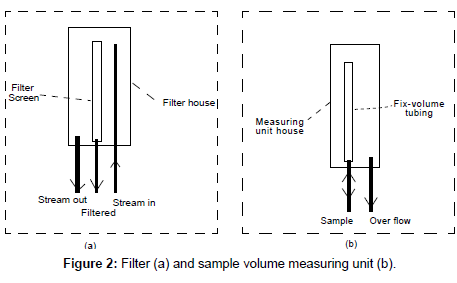
Filter and sample volume measuring unit: Raw water samples often contain large amounts of sediment which will quickly clog the system unless the majority of the sediment is removed. A mechanism to remove the sediment must be incorporated at the beginning of the run. This Filter Unit (Figure 2a) consists of three pieces of tubing, a filter screen and filter housing. Streaming water initially flows to the filter housing unit through the “stream in” tubing. A small portion of this stream passes through the filter screen with the sediments removed. The removed sediment is carried out by the excess stream. The excess stream do not pass through the filter screen; but instead exits the filter housing through the “stream out” tubing (Figure 2a). The cleaner water from within the filter screen cavity flows through the “filtered” tubing towards the sample holder in the Sample Volume Measuring Unit (Figure 2b).
The Sample Volume Measuring Unit (Figure 2b) is also constructed in house. It consists of a sample housing, a bottomless cylinder (as the holder) and connection tubing. At any given time, other than filling the sparger on P&T, the sample in the “holder” is always at an over flowing status, and thus the retained sample is always fresh with a fixed volume. This volume of sample will be unloaded into the P&T sparger at each sampling time.
Stream selection mechanisms: Tekmar™ LSC 3100 can only process one sample a time. Continuous feed of the water to the P&T will make the purge process impossible. Solenoid valves were selected to control the stream flow and consecutively feed the P&T LSC 3100. There is no sample pump considered in the design, since in our plants, the water streams are regulated to a relatively high pressure of 30 ~ 60 psi, which is high enough to push the water through the solenoid and connecting tubing.
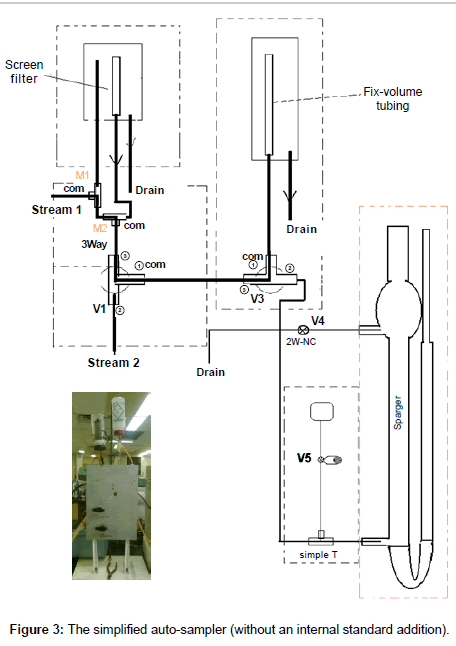
Referring to Figure 3, this simplified auto-sampler (without an internal standard addition) consists of three solenoid valves (V1, V3, V4), two manual mode-selection valves (M1, M2), the on-line filter, sample measuring unit and the connection tubing. All the solenoid valves are electronically operated. When the right voltage is applied to a valve, the valve will be energized and turned ON (i.e., changed from its normal status). To turn the valve off (back its normal status), the voltage has to be removed from that valve.
All these valves and tubing are mounted on one piece of ¼ inch thick aluminum board. The connections between the valves are illustrated in Figure 3. This module can be operated in two different modes –either with or without filtration. The sample size can be determined by the sparger size or by sample holder size in the sample measuring unit described above.
The valve operational sequences are described as follows:
• Stream 1 with filtration (default sequence S1)
Manual valve M1 to Left (L position, water flows up into the filter), manual valve M2 to Right (R position, water from filter flows into this valve and passes to the first 3-way solenoid V1); V1 programmed OFF (sample flows through port 3 and 1 to the second 3-way solenoid V3). V3 programmed OFF (water flows through the sample holder, the overflow is discharged). By now, the sample is uploaded into the sample holder. A signal is sent when the P&T is ready, switching both the 2-way solenoid V4 ON (for releasing pressure) and the 3-way solenoid V3 ON (blocking water from V1) and unloads the sample from the holder into the sparger. When the sample unloading is complete, both V3 and V4 solenoids switch OFF automatically. The sample is ready to be purged.
• Stream1 without filtration (the only differences from the default sequence S1 are the manual valves positioning, as shown in the diagram above).
Manual valve M1 to Right (R position, water flows down to M2), manual valve M2 to Left (L position, water flows from M1 directly into this valve and passes to the first 3-way solenoid V1); V1 programmed OFF (water flows through port 3 and 1 to the second 3-way solenoid V3). V3 programmed OFF (water flows through the sample holder). The overflow is discharged. By now, the sample is uploaded into the sample holder. A signal is sent when the P&T is ready, switching both the 2-way solenoid V4 ON (for releasing pressure) and the 3-way solenoid V3 ON (blocking water from V1) and unloads the sample from the holder into the sparger. When the sample unloading is complete, both V3 and V4 solenoids switch OFF automatically. The sample is ready to be purged.
• Stream 2 (default sequence S2; Stream 2 cannot be filtered)
Manual valve M1 to Left (L position, stream1 flows up into the filter), manual valve M2 to Right (R position, Stream1 from filter get into this valve and pass to the first 3-way solenoid V1; V1 programmed ON (Stream1 blocked here by Port 3 and flows through the filter drain). Stream 2 flows through V1 from Port 2 to Port 1 and reaches V3, the second 3-way solenoid). V3 V1 programmed OFF (water flows through the sample holder, the overflow is discharged). By now, the sample is uploaded into the sample holder.A signal is sent when the P&T is ready, switching both the 2-way solenoid V4 ON (for releasing pressure) and the 3-way solenoid V3 ON (blocking water from V1) and unloads the sample from the holder into the sparger. When the unloaded sample is complete, both V3 and V4 solenoids switch OFF automatically. The sample is ready to be purged. V1 programmed OFF (allows Stream 1 to pass through the sampling holder to the Drain).
Power supply: A used power supply (MW S-150-24) harvested from an old TOC analyzer was used to energize the solenoids. The specification of this power supply is listed in Table 1. This power supply has more than enough power to energize all three solenoid valves and leave enough room for future expansion (i.e., can add up to two more valves if internal standard is needed).
Programmable switches: To make a solenoid valve change its status at a scheduled time, there must be a switch to control the power to turn the valve on or off. This switch has to be programmable either through its own logic or through a computer. To control all the solenoid valves, a set of programmable switches have to be used. After the consideration of the convenience, programmability, function and price, a NI-DAQ USB-6525 [6] was selected (purchased new). Its features are listed in Table 1.
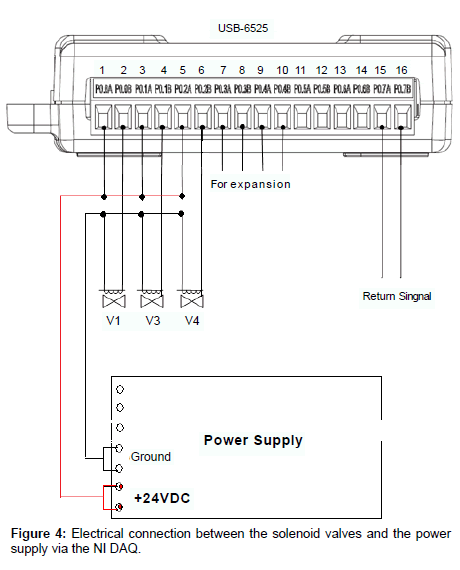
Connections: The electrical connection between the solenoid valves and the power supply via the NI DAQ-6525 is illustrated in Figure 4 [7-9]. The NI DAQ-USB-6525 is computer controlled through an USB connection, by a home developed program under MATLAB™ [10]. The program is compiled and can be run under MATLAB™ Library. After the control program of NI DAQ initialized, the designated channel of the DAQ will be opened by closing the circuit at a pre-set time for a preset length of period. In this period of time, a voltage of +24V is applied to the solenoid valve connected to this channel. This solenoid valve will be turned on and changed from its normal status. At the end of this period, the channel circuit is opened; the voltage is removed from this valve; and the valve return to its normal status. The water stream is controlled in this way.
Up to this point, the construction of the auto-sampler is finished. The operation and timed events of the auto-sampler are described in detail in the following section.
Establish computer control of HP GC 5890 II
The HP 5890 II was used as a computer controlled instrument before it was retired. The interface was a GPIB board with Windows™ NT and an old version of Chemstation. However, the computer is too out-of-date to accommodate the newly developed software. Further, Windows™ NT cannot handle USB adaptors, which is most often used for connecting external devices at this time. Thus a newer computer was selected. For the majority of new computers, there is no built- in slot to accommodate a GPIB board. In order to establish communication between the computer and the GC, the GPIB interface in the GC has to be converted to a USB adaptor. The Agilent 82357B USB/GPIB adaptor is designed for this purpose. Fortunately, we had one of these devices already available in our lab. For this device to be functional, Agilent’s OI Library Suite 15 (or higher), with ChemStation A10.02 (or higher) is needed. This software, in turn, needs the WindowsMT XP Professional Service Pack 3 (or higher) operating system. Finally, a suitable used computer system was selected with the features satisfying these requirements (Table 1). The only physical connection between the GC and the computer is between the GPIB interface on the GC and the USB port on the computer through the 82357B USB/GPIB adaptor. Configuration and settings of the software will not be provided in detail here.
Establish communication between HP GC 5890 II and P&T Tekmar LSC 3100
The goal of the setup is to synchronize the operation between these two pieces of equipment. Two key requirements have to be met – First, when the GC is not idle and at Ready Status, the P&T device should not desorb the compounds it collected. The releasing of the compounds should only happen when the GC is at a Ready Status. The GC temperature program can be started in two ways – by software control (a mouse click on the start button) or by hardware (remote start from an external signal). For continuous operation, the first approach was ruled out, since one cannot click on the start button for each and every sample. It has to be triggered by an external signal. Additionally, the run has to be started at the time-point at which the compounds are injected into the GC, i.e., when the P&T starts desorbing. The second requirement is that the P&T must be at Ready Status when the autosampler starts taking the next sample. The auto-sampler needs a Ready Signal from the P&T to start its procedure. Therefore, establishing communication between the P&T and the GC, plus between the P&T and the auto-sampler is essential.
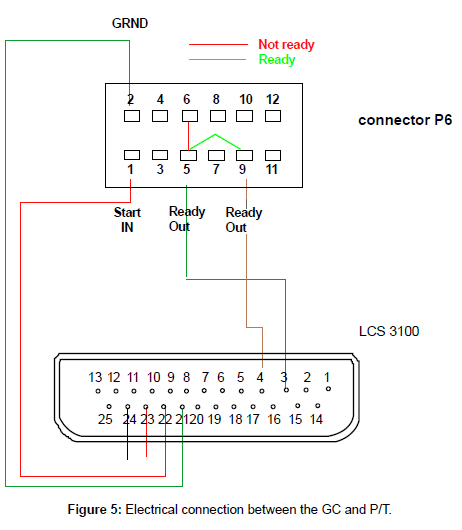
The GC itself has a remote-start function. Specially configured connection cables are available through Agilent or other suppliers. Hand shaking between the GC and the P&T are established by an electrical connection through a Tekmar cable (part number 14-6689- 186), which connects the GC end to RS-232-c, 25-pin, and to the P&T end, 9-pin. Another Tekmar cable, part number 14-2991-000, connected to the communication port (P/T end, 25-pin,) and the GC (12-pinremote connection) to issue and receive Ready/Start signals. The pin configuration and interconnections are illustrated in Figure 5. With the correct user setting, upon completion of the purging process, the P&T will wait for a ready signal. When the GC is ready, pins 5 and 9 will close briefly which momentarily short pins 3 and 4 in the P&T communication port, starting the desorbing process.
Since the starting point of P&T is independent of the GC, while the GC starting is triggered by the P&T, the P&T can act as a control point. Simply let the P&T run its procedures independently except for the desorbing procedure (including the preheating). When the P&T completes its purging procedure, it waits for a Ready signal from the GC to desorb and start the GC analysis. When the P&T recover itself, it sends a Ready Signal to the auto-sampler at a predetermined time point. Thus, the P&T needs to obtain two commands - (1) a start command to process a loaded sample from anywhere (GC, computer etc.), and (2) a ready signal from the GC to begin desorbing.
Establish connection between the auto-sampler and the Purge and Trap
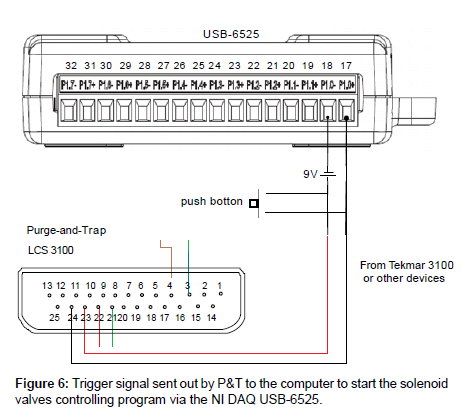
Only the water lines need to be connected between the outlet of the auto-sampler and the inlet of the P&T sparger. No direct electrical connection between these two devices is needed. Signal transfer is established through communication between the P&T and the computer vial DAQ USB-6525. The connections between the P&T and the DAQ-6525 are shown in Figure 6. When the GC is ready in this configuration, it sends the ready signal to P&T, and the later starts desorbing and sending a signal to the computer via the NI DAQ. A time delay has to be programmed in the auto-sampler control to leave time for the P&T to desorb and recover itself before preparing for the next sample.
Establish connection between the Auto-sampler and the HP GC 5890 II
There is no water connection between the auto-sampler and the HP GC 5890 II. The only possible electrical connection is between the GC and the DAQ-6525 (as an option, not used at this time) is similar to that shown in Figure 6, with the Ready signal from the GC to replace the desorb signal from the P&T.
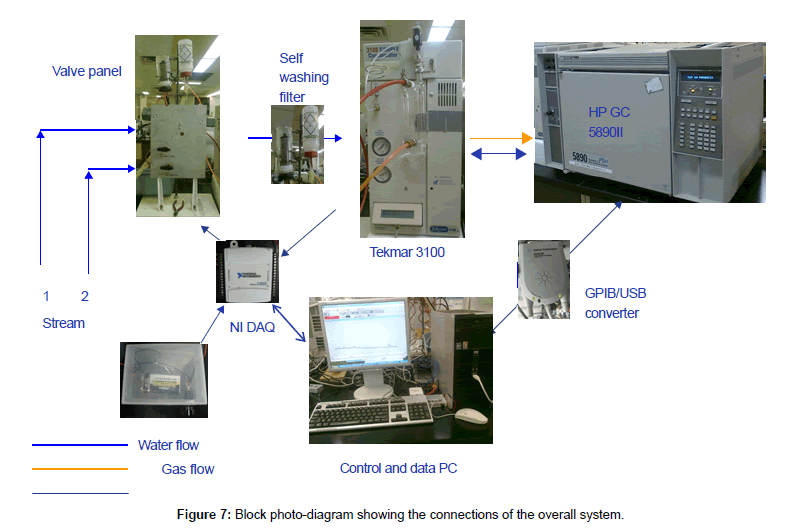
By now, the construction is finished. The overall diagram is shown in Figure 7 as block pictures.
Overall Control and Data Handling
The remaining and the most difficult part of the project is the automation of the system.
Individually, every module has been tested and works well. The next step is to make them work together. The overall goal is to have the system continuously sample from the water line, concentrate, analyze and save/display the data. It also requires the system handles two streams (A and B) alternatively. The entire process is explained as the following:
Detailed sequence
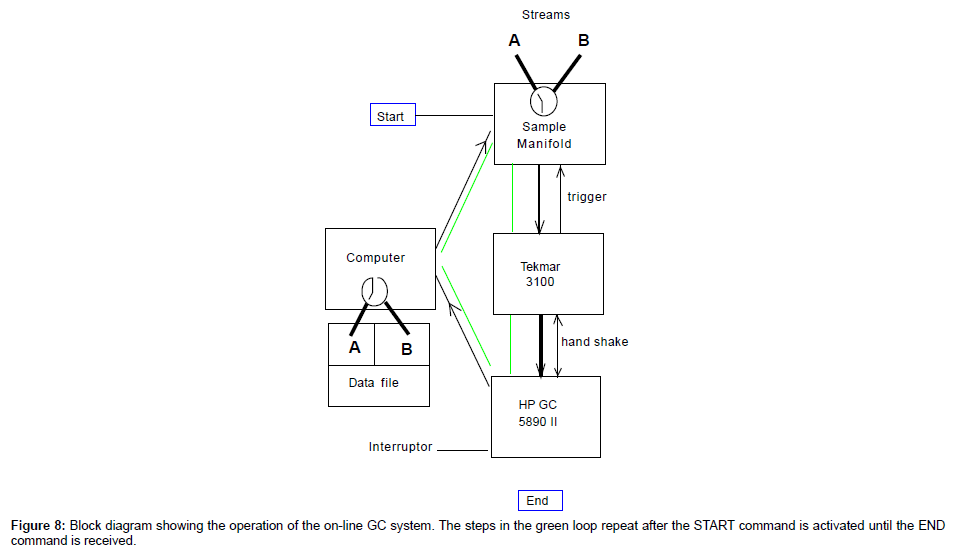
After all modules are initialized and synchronized after powering on, both GC and P&T are at Ready Status. The following procedure takes over and runs continuously (Figure 8) until it is interrupted externally:
1. Start – Auto-sampler control program receives a start signal. This can be from the push button in Figure 6, or from a pre-run of the P&T.
2. Auto-sampler takes sample A and loads the sample to the P&T sparger;
3. The P&T concentrates the sample (~ 15 minutes) and waits for the HP GC to be ready (if it is not);
4. The P&T receives the ready signal from GC and transfers the concentrated sample to GC and starts the GC run (the transfer take 4 minutes and the GC run last 25-30 minutes, depends on the column and the temperature program), at the same time a signal is sent to the computer vial NI DAQ to start the time delay before taking the next sample (The time delay should be long enough to let the P&T fully recover);
5. The P&T recovers after transferring the sample to the GC (~ 15 minutes. Ensure the P&T is recovered before the GC run ends);
6. When the P&T has recovered, the auto-sampler starts taking sample B and carries out the concentration procedure. (If the concentration procedure completes before the GC is ready, it will wait).
7. When the GC run is finished, it saves the data file on the hard drive in folder A. The file should contain the following information: Run date and time, sample line A or B, the concentration of the measured compounds.
8. The GC recovers. After the GC recovered and ready, it sends a ready signal to the P&T. The same procedure as with line A is carried out on line B. The data file has a different sample name and stored in the folder B.
9. Steps 1 through 8 repeat themselves.
Computer controlling
Depending on the requirement of the sample lines, there are two ways to automatically carry out the above sequences continuously.
Since both the MATLAB™ program and ChemStation can access other Windows applications through user defined macro program, this provides a channel to exchange data between the GC, ChemStation, and the MATLAB™ software. One can build an Excel™ file which can be accessed by both software programs. The file contains the time interval for the valve operation, sample name and other identification, time stamp of the analysis, file name and path of the acquired data etc. Both MATLAB™ program and ChemStation read and write data from/ into this file to alter their variables in a predefined manner. Thus the entire system is under complete computer control. The triggering signal from the P&T to start the sampling will not be necessary. Due to the limitation of this paper, detailed programming cannot be given here. Interested readers can contact the author to discuss in more detail.
If only one stream of sample to be analyzed, the stream selection function is not needed. The P&T can run continuously at a schedule mode when the scheduled sequence is started. Thus, one can let the P&T run independently and let the GC and auto-sampler run following the trigger from the P&T. ChemStation can save the file when the GC analysis complete. The file number will be automatically increase by 1 for the next sample. However, due to the stream selection function, this is not used in this mode, and all the data will be stored in one folder.
Analytical Performance
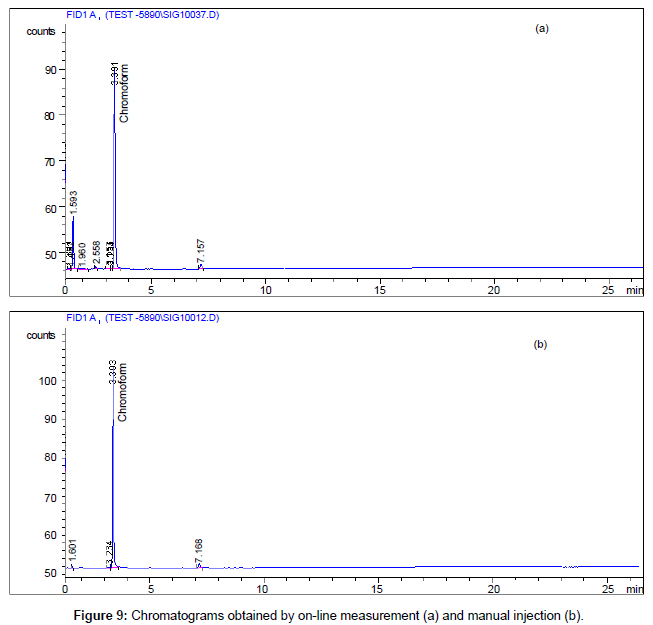
Since no modification done on either the P&T or GC-FID, the function and the measuring capabilities of these two instruments remained the same with or without the connection of the autosampler. The sensitivity and detection limit should be the same with manual sample introduction and auto-sampler introduction, as long as the auto-sampler introduction is consistent. Further, auto-sampler introduction needs pressurized sample reservoir and large quantity of samples. It is not economically feasible to do auto-sampler introduction calibration. Thus, the system was calibrated off-line by injecting the calculated amount of calibration standard directly into the sparger. After calibration, the system was then in conjunction with the autosampler. Calibration curve can be adjusted based on this comparison if necessary. Figure 9 is a comparison of chromatograms obtained from manual injection and from on-line measurement of the same reservoir stream. The validation of the system is obvious. Table 2 listed the performance data for the system when it was run off-line. Also, a comparison between the results obtained from the same stream measured by manual injection and by auto-sampler introduction was also listed in the table.
Summary
A functional On-Line GC system was developed using retired existing equipment. Due to the easy availability of these devices in most of the labs, this system can be built by any lab which has an interest in its application. With a small investment, new and simplified devices can be used to replace these old devices and make the system more compact and reliable.
Acknowledgement
The author thanks Dr. Chuhong Fei, from AUG Signals Inc., for the assistance in developing the solenoid control.
References
- Environmental and Workplace Health (2012) Guidelines for Canadian Drinking Water Quality. Health Canada.
- Hammer MJ (1975) Water and Waste-water Technology. 4th edition, Technology & Engineering. Wiley, USA.
- Eaton AD, Franson MAH (2005) Standard Methods for the examination of water and wastewater. 21st Edition, American Public Health Association, USA.
- HP 5890 Series II and HP 5890 Series II Plus. Reference Manual.
- Tekmar 3100 manual.pdf
- NI USB-6525. National Instruments.
- http://wattsupply.com/?gclid=COOi85LK8boCFSJlMgodMREA8g
- 3 Way Solenoid Valves 8320 Series. ASCO.
- 2 Way Solenoid Valves. ASCO.
- 82357B USB/GPIB Interface High-Speed USB 2.0. Agilent Technologies.
Relevant Topics
Recommended Journals
Article Tools
Article Usage
- Total views: 16134
- [From(publication date):
specialissue-2014 - Aug 24, 2025] - Breakdown by view type
- HTML page views : 11427
- PDF downloads : 4707

