Genetic Variation, Association and Marker Validation for Nitrogen use Efficiency and their Related Traits in Recombinant Inbred Lines of Rice (Oryza sativa L.)
Received: 29-Apr-2020 / Manuscript No. JPGB-23-10010 / Editor assigned: 04-May-2020 / PreQC No. JPGB-23-10010 (PQ) / Reviewed: 18-May-2020 / QC No. JPGB-23-10010 / Revised: 14-Jul-2023 / Manuscript No. JPGB-23-10010 / Published Date: 11-Aug-2023 DOI: 10.4172/jpgb.1000165 QI No. / JPGB-23-10010
Abstract
Rice is a nutritionally important cereal crop and staple food of Asia. There is an urgent need for developing highyielding, nutritious, resource use-efficient and multi-stress-tolerant rice varieties to keep up with the tremendous human population growth, especially in Asia, where rice remains the primary source of caloric intake. In this study, an attempt was made to establish the genotype-phenotype association involving SSR markers and eight parameters. Based on the phenotypic values of the parents, it is evident that WAB450 is more efficient in N uptake and use compared to Swarna. The inter-correlation analysis among the parameters indicated the association of Grain Yield (GY) with Dry Matter Production (DMP), Grain N Uptake (GNUP), Straw N Uptake (SNUP), N Use Efficiency (NUE) and N Translocation Efficiency (NTE). The results also indicated that number of SSR markers associated with phenotypic traits identified through one-way ANOVA were common for the correlated traits. The marker RM519 was associated with GY and SPAD value. RM340 was found to be associated with NUE and NTE and also the marker RM245 found to be associated with NUE and SPAD value. The detection of common marker(s) for the above mentioned parameters suggested that correlated traits might be influenced by common chromosomal regions. These observations suggest the possibilities for simultaneous improvement of GY and NUE.
Keywords
Rice; N use efficiency; N translocation efficiency; Association assessment; Marker validation; SSR marker
Introduction
In the coming decades, rice production needs to be carried out sustainably to keep the balance between profitability margins and essential resource input costs. Many fertilizers, such as N, depend primarily on fossil fuels, whereas P comes from rock phosphates. How long these reserves will last and sustain agriculture remains to be seen. Therefore, current agricultural food production under such conditions remains an enormous and colossal challenge. Researchers have been trying to identify nutrient use-efficient varieties over the past few decades with limited success. The concept of nutrient use efficiency is being revisited to understand the molecular genetic basis, while much of it is not entirely understood yet. However, significant achievements have recently been observed at the molecular level in nitrogen and phosphorus use efficiency. Breeding teams are trying to incorporate these valuable QTLs and genes into their rice breeding programs [1].
To address the concerns of nutrient loss and the associated environmental pollution, improving NUE is crucial. The need for developing and identifying superior N efficient genotypes is evident from the low recovery of N fertilizer, associated with economic and environmental concerns recommended selecting cultivars with high NUPE and NUTE. It was also indicated that NUE should be considered during developing rice cultivars and making fertilizer N recommendations as well [2].
In recent era of biotechnology, molecular markers attracted breeders to use them in different purposes in crop improvement. Genetic mapping of simple traits, Quantitative Trait Loci (QTL) mapping, utilization of markers linked to the traits of interest (Marker Assisted Selection (MAS)), could result in saving time for selection and accuracy. These markers have many advantages in plant breeding since the genetic material could be handled without the effort of the environment. Moreover, they save a lot of money needed for long and very expensive field evaluation [3].
In order to develope rice low-N tolerant rice genotypes, it is necessary to characterize rice plant that use N efficiently. Characterization of phenotype is also very important for identifying genes control traits associated with N use efficiency through Quantitative Trait Loci (QTL) that can be used as Marker Assisted Selection (MAS) for developing nitrogen use efficient genotypes. Hence, this study aimed at investigating genetic variability and nature of association among N use efficiency upland rice genotypes and marker validation for N use efficiency and their related traits [4,5].
Materials and Methods
Plant material
The experimental material for the present investigation comprised of 188 RILs (BC1F6) derived from the cross between Swarna × WAB-450 and checks which were subjected for phenotyping. A total 60 genotypes comprising of 54 RILs; their parental lines viz., Swarna and WAB-450; checks viz., BPT5204, Mysore Mallige, ADT43 and Ratansagar (SW-214) were selected based on mean data of grain yield and their attributing traits [6].
Screening for quantitative traits and determination of nitrogen in plant sample
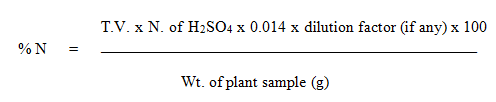
A composite straw and grain samples were prepared by mixing equal amount of samples from individual plants of RILs families and stored in tightly sealed vials. A sub sample of 0.5 g was used to determine the N content in grain and straw separately by employing Kjeldhal N distillation method. Determination of nitrogen in plant sample was calculated as follows.
Traits evaluated
The following parameters were recorded on the selected RILs along with checks:
• Grain Yield (GY) (g): Weight of filled grains/plant
• Dry Matter Production (DMP) (g): Weight of oven-dried grain and
straw
• Grain Nitrogen content (GN) (%): Percentage of N in grain
• Straw Nitrogen content (SN) (%): Percentage of N in straw
• Grain N Uptake (GNUP) (g/plant): Grain dry weight × (GN/100)
• Straw N Uptake (SNUP) (g/plant): Straw dry weight × (SN/100)
• Total N Uptake (TNUP) (g/plant): GNUP+SNUP
• N Use Efficiency (NUE): Grain yield/TNUP
• N Translocation Efficiency (NTE) (%): (GNUP/TNUP) × 100
Isolation, quantification and normalization of DNA
The seedlings were raised in pots by using another set of seeds of selected RILs along with checks. The leaf samples were collected at 25 days after sowing. Total cellular DNA (deoxy ribonucleic acid) was extracted by following protocol described by. Quantification was done based on the intensity of the bands on agarose gel electrophoresis. Normalization of DNA was done to bring all DNA concentrations to a relatively equal level (20 ng/μl) by appropriate dilutions. Dilutions were made with TE buffer [7].
Parental polymorphic survey and genotypic evaluation of mapping population
DNA of the Swarna, WAB450, Mysore Mallige and ADT43 were analyzed for polymorphism using Rice Microsatellite (RM) primers. A total of 88 RM primers available in public domain were used to survey the parental polymorphism. The primers were chosen based on their distribution in the genome and earlier reports. The population was scored for the presence or absence of the WAB450 alleles in homozygous or heterozygous state.
Statistical analysis and marker validation
Single marker analysis was performed to tag and confirm potential SSR markers linked to the trait based on phenotypic and genotypic data pertaining to the RILs (F7) populations, which is based on simple linear regression method. Single marker analysis also was done with the help of student’s t-distribution and one-way analysis of variance [8].
Results and Discussion
The green revolution technologies used in irrigated rice production and rice-wheat rotations in Asia have significantly impaired the productivity of the land and resulted in the buildup of salinity and water logging, declining soil nutrient status, increased soil toxicities and increased pest buildup. There is a strong consensus among the agricultural scientists to design a system, which will sustain the food production by using internal resources and avoiding purchased inputs mainly nitrogenous fertilizers. In evolving this system, crop component, which will sustain the yield without external inputs, is considered as the most vital. Moreover, scientists have a strong belief that the emerging knowledge in biotechnology will definitely augment the crop improvement programmes. As far as rice is concerned, the knowledge base available about the genotypes and the advances made in understanding the genome and its manipulations is enormous [9].
Inter-correlation among the traits was worked out to identify associated traits for NUE. GY had significant positive correlation with DMP, GNUP, TNUP, NUE and NTE. N uptake was found to increase with increase in N content in the plant, GY and DMP. TNUP was negatively correlated with NUE and NTE. NUE was low with high N content and N uptake. NUE had significant positive correlation with GY. NTE was influenced by all traits as evident by highly significant correlation coefficient. But the association of NTE with DMP, SN, SNUP and TNUP was in negative direction (Table 1). The survey of both SSR primer pairs on Swarna/WAB450 revealed almost better polymorphism between parents. Among the other marker systems like ISSR, SSR markers were preferred because of their technical simplicity, stable inheritance, high level of polymorphism and genome wide coverage. Used 131 SSR markers to survey 2 rice genotypes viz., Milyang and Gihobyeo and obtained 100 polymorphic markers indicating 76 percent polymorphism. This suggested that the use of more number of SSR primer pairs from the available 500 SSR primer pairs will speed up the process of linkage map construction in rice. Linkage map construction of any organism depends on the availability of segregating markers covering the entire genome [10].
| Traits | LN (%) | GN (%) | DMP | GNUP | NUP | TNUP | NTE (%) | NUE (%) | SNUP |
|---|---|---|---|---|---|---|---|---|---|
| LN (%) | 1 | ||||||||
| GN (%) | -0.004 | 1 | |||||||
| DMP | 0.004 | -0.085 | 1 | ||||||
| GNUP | 0.1247 | 0.6893** | 0.3367** | 1 | |||||
| SNUP | 0.2574** | -0.159 | 0.8702** | 0.026 | 1 | ||||
| TNUP | 0.2809** | 0.2325* | 0.9044** | 0.5519** | 0.8480** | 1 | |||
| NTE (%) | -0.042 | 0.5281** | -0.4043** | 0.6355** | -0.6864** | -0.2355** | 1 | ||
| NUE (%) | -0.019 | -0.108 | 0.3748 | 0.2808 | -0.678 | -0.416 | 0.7094 | 1 | |
| GY | 0.198 | 0.121 | 0.535** | 0.795** | 0.178 | 0.570** | 0.425** | 0.489** | 1 |
Note: LN (%): Leaf Nitrogen content; GNUP: Grain N Uptake (GNUP) (g/plant); NTE (%): N Translocation Efficiency; GN (%): Grain Nitrogen content; SNUP: Straw N Uptake (g/plant); NUE (%): N Use Efficiency; DMP: Dry Matter Production (g); TNUP: Total N Uptake (g/plant)
Table 1: Estimates of phenotypic correlation coefficients between NUE and their component characters in selected genotypes.
In the present study, though a total of 88 SSR markers was identified as polymorphic, only 75 primer pairs could be surveyed on RIL individuals. Of the 75 markers, only 60 were showing clear scorable banding pattern. The single factor ANOVA carried out to establish the linkage between these SSR markers specific to each chromosome and the strength of the linkage between marker pairs viz., RM2 on chromosome 11; RM237 on chromosome 7 and these marker pairs represented all the chromosomes of rice except chromosome 10 indicating the possibility of having all the 11 linkage groups of Swarna/WAB450 cross for NUE, GY, SPAD value and NTE. A total of 8 SSR markers were identified for GY through one-way ANOVA. Among the 8 SSR markers, RM161 describes the highest phenotypic variance of 73.73% which was located on the chromosome 5 with a p-value of 0.0024. The marker RM2136 explained the least phenotypic variance of 12.42% with p-value of 0.0402 (Table 2). The 5 SSR markers associated with chlorophyll content (SPAD value). Among these markers, RM234 showed a maximum phenotypic variance of 70.84% with a p-value of 0.0142 and least phenotypic variance of 12.87% was explained by RM245 with a p-value of 0.0401. RM36 located on 3rd chromosome located at genetic distance of 124.4 cM showed lowest p-value of 0.0091 with a phenotypic variance of 64.84% whereas the marker RM245 located on chromosome 8 located at a genetic distance of 76.6 cM showed a highest p-value of 0.0401 explaining the phenotypic variance of 12.87% (30 c) [11].
| One-way ANOVA | ||||
|---|---|---|---|---|
| Trait | Locus | Chrom. no. | Probability | R2 |
| Grain yield | RM136 | 6 | 0.0402 | 12.42 |
| RM537 | 4 | 0.0184 | 26.24 | |
| RM237 | 7 | 0.0241 | 17.71 | |
| RM515 | 8 | 0.0025 | 55.24 | |
| RM519 | 12 | 0.0276 | 17.2 | |
| RM16 | 3 | 0.0208 | 11.82 | |
| RM248 | 7 | 0.0344 | 17.7 | |
| RM161 | 5 | 0.0024 | 73.73 | |
| SPAD | RM36 | 3 | 0.0091 | 64.84 |
| RM444 | 9 | 0.0326 | 16.32 | |
| RM245 | 9 | 0.0401 | 12.87 | |
| RM519 | 12 | 0.0105 | 69.71 | |
| RM234 | 7 | 0.0142 | 70.84 | |
| NUE | RM215 | 9 | 0.0132 | 39.15 |
| RM245 | 9 | 0.0255 | 26.23 | |
| RM525 | 2 | 0.0092 | 59.74 | |
| RM225 | 6 | 0.0084 | 68.34 | |
| RM340 | 6 | 0.0101 | 45.2 | |
| RM1111 | 8 | 0.045 | 14.85 | |
| RM4085 | 8 | 0.0375 | 20.22 | |
| RM202 | 11 | 0.0324 | 27.05 | |
| RM20 | 11 | 0.0228 | 44.21 | |
| RM215 | 9 | 0.0186 | 35.47 | |
| NTE | RM341 | 2 | 0.0174 | 4.187 |
| RM282 | 3 | 0.0411 | 8.86 | |
| RM340 | 6 | 0.0417 | 30.5 | |
| RM246 | 1 | 0.0241 | 31.02 | |
| RM125 | 7 | 0.042 | 14.21 | |
| RM2 | 7 | 0.0139 | 37.05 | |
| RM282 | 3 | 0.0352 | 41.43 | |
| RM342 | 6 | 0.0364 | 30.13 | |
Table 2: SSR markers putatively associated with phenotypic traits viz., grain yield, SPAD value, NUE and NTE identified through one-way ANOVA.
Among 10 markers associated Nitrogen Use Efficiency (NUE) viz., RM215 and RM245 chromosome 9, RM525 chromosome 2, RM225 and RM340 chromosome 6, RM1111 and RM4085 chromosome 8, RM202, RM20 and RM242 chromosome 11, the marker RM225 located on chromosome 6 explaining highest phenotypic variance of 68.34% with a least p-value of 0.0084. The marker RM1111 with a high p-value of 0.0450 explained a least phenotypic variance of 14.85% which is located on chromosome 8. The agarose gel electrophoresis images depicting the polymorphism between parents by markers RM525 and RM225 association with NUE trait. A total of 8 markers were known be associated with Nitrogen Translocation Efficiency (NTE). A marker RM282 located on chromosome 3 explained highest phenotypic variance of 41.43% (p=0.0352) and least phenotypic variance of 4.187% (p=0.0174) was explained by RM341 located on chromosome 2. Some of the markers identified through one-way ANOVA were common for the correlated traits. The marker RM519 was associated with GY and SPAD value. RM340 was found to be associated with NUE and NTE and also the marker RM245 found to be associated with NUE and SPAD value. A key component in the field of complex trait analysis was the development of large collection of molecular/genetic markers, which could be used to construct detailed genetic maps of both experimental and domesticated species. Those maps provided the foundation for modern QTL mapping methodologies. By QTL mapping, association between phenotype(s) and genotype(s) can be established for the purpose of understanding and dissecting the regions of the genome that affect complex traits with the help of statistical tools. There are several approaches such as single marker mapping, interval mapping, composite interval mapping and multiple trait mapping. Whatever may be the statistical approaches employed the central point in QTL mapping study is the availability of genetic map with required genetic markers and the phenotypic scores to evaluate the targeted complex trait(s) [12].
In this study, an attempt was made to establish the genotypephenotype association involving SSR markers and eight parameters. Though it was possible to have a genetic map of Swarna/WAB450 with 60 SSR markers in the present study, the map was very sparse and incomplete. The attempt to add more markers to the SSR markers did not yield the expected results. Considering the situation, the QTL analysis for all the nine phenotypic parameters was carried out involving single marker analysis.
Based on the phenotypic values of the parents, it is evident that WAB450 is more efficient in N uptake and use compared to Swarna. Considering the parental differences for the eight parameters involved and the range of each phenotype among the RILs, it is very evident that the parameters are amenable for marker mapping. The intercorrelation analysis among the parameters indicated the association of GY with DMP, GNUP, TNUP, NUE and NTE. Previous studies have also documented the positive association of N uptake and NUE with GY in rice. The results indicated that number of SSR markers associated with phenotypic traits identified through one-way ANOVA were common for the correlated traits. The marker RM519 was associated with GY and SPAD value. RM340 was found to be associated with NUE and NTE and also the marker RM245 found to be associated with NUE and SPAD value. This markerphenotype association commonality was found on chromosomes 6, 7, 9 and 12. The detection of common marker(s) for the above mentioned parameters suggested that correlated traits might be influenced by common chromosomal regions [13].
A comparative analysis on the marker mapping for NUE in rice could not be made since there was no other work except the report of Senthilvel, who detected QTL for NUE on chromosomes 3 (RZ574- RZ284) and 11 (RG247-RG103), which were also associated with grain yield. In the present study, Marker associated for NUE were detected on chromosomes 2 (RM525), 6 (RM225) and 6 (RM340). The marker on chromosome 6 also showed its association with GY. Thus, both studies showed that genomic regions on chromosomes 2 and 6 might harbour genes for GY and NUE. These observations suggest the possibilities for simultaneous improvement of GY and NUE. Though there are commonalities observed in chromosomes for their association with the traits of NUE in rice from the present and previous work clear cut evidences could not be established since the studies involved two different mapping populations. He attempted to associate ISSR markers with individual phenotypic traits yielded several marker-phenotypic associations, but nothing could be deduced since these markers were not positioned on specific chromosomes. Specific information would be obtained if these markers are mapped to the 60 loci-SSR map. The use of higher order regression model to identify the most probable marker combinations associated with phenotypic traits yielded common marker combinations (markers on chromosomes 3, 7 and 8) for GY and GNUP indicating that those chromosomal regions influence various NUE parameters [14].
The present investigation of mapping of markers associated with NUE in rice involving individuals from RILs from cross of Swarna/ WAB450 is the initial attempt of its kind in rice marker linkage mapping. Though this study has some constraints with regard to mapping population and the number of genetic markers employed and phenotypic screens for NUE, it has generated valuable information to proceed further to track down the network of genes associated with NUE in rice, a complex trait by nature. The accuracy of QTL mapping can be further improved by 1) evaluating an immortal population with adequate number of replications across environments with varying N levels, 2) construction of genetic map with sufficient markers to provide uniform marker intervals and 3) developing refined “phenotypic screens” to assess the NUE and its component traits. Among the three components mentioned above, developing phenotypic screens would be a daunting task, considering the inherent complex nature of NUE related traits in rice. NUE is known to be influenced by a variety of factors viz., 1) differences in quantity and rate of N uptake from various soil depths, 2) Plant associative N2 fixation, 3) Rhizosphere effects on the extent and pattern of N mineralization in the soil, 4) Differences in root morphology and 5) Differences in the ability to translocate, distribute and redistribute the absorbed N in various organs and the efficiency of N use in photosynthesis.
Conclusion
Therefore, the identification of right combinations of traits and their measurement seems to be very difficult. The interrelationships of the various processes involved in N uptake and use remain very complex. This situation underscores the need for developing sensitive and robust methodologies to identify/measure N use related traits. Of these traits, the identification of heritable physiological or biochemical traits, related to grain yield, is the most formidable barrier. Currently, additional knowledge is needed on the metabolic role of N in grain production to permit identification of such traits. The potential for identification of those traits and the development of screening procedures to measure them lies on the genetic variability present in the rice germplasm.
References
- Abdel-Rahman MA, EL-Denary ME, Ammar MH, Abdelkhalik AF, Draz AE, et al. (2015) QTL validation for grain yield and nitrogen use efficiency under different nitrogen levels in rice Egypt. J Genet Cytol 44: 235-251.
- Chen X, Temnykh S, Xu Y, Cho YG, McCouch SR, et al. (1997) Development of a microsatellite framework map providing genome-wide coverage in rice (Oryza sativa L.). Theor Appl Genet 95: 553-567.
- Cho YG, McCouch SR, Kuiper M, Kang MR, Pot J, et al. (1998) Integrated map of AFLP, SSLP and RFLP markers using recombinant inbred population of rice (Oryza sativa L.). Theor Appl Genet 97: 370-380.
- Cho YI, Chin JH, Ziang WZ, Lee HJ, McCouch SR, et al. (2003) Identification of QTLs associated with nitrogen-use efficiency in rice. Mol Cells 45: 12-19.
- Dellaporta SC, Wood J, Hicks TB (1983) A plant DNA mini preparation: Version II. Plant Mol Biol Rep 1: 19-21.
- Doerge RW (2002) Mapping and analysis of quantitative trait loci in experimental populations. Nat Rev 3: 43-52.
[Crossref] [Google Scholar] [PubMed]
- Edwards MD, Stuber CW, Wendel JF (1987) Molecular marker-facilitated investigations of quantitative trait loci in rice: Numbers, genomic distributions and type of gene action. Genetics 116: 113-125.
- Haley CS, Knott SA (1992) A simple regression method for mapping quantitative trait loci in line cross using flanking markers. Heredity 69: 315-320.
[Crossref] [Google Scholar] [PubMed]
- Humphries EC (1956) Mineral components and ash analysis. Soil Sci 100: 112-117.
- Jansen RC (1993) Interval mapping of multiple quantitative trait loci. Genetics 135: 205-211.
[Crossref] [Google Scholar] [PubMed]
- Jiang C, Zeng ZB (1994) Multiple trait analysis of genetic mapping for quantitative trait loci. Genetics 136: 1447-1455.
[Crossref] [Google Scholar] [PubMed]
- Kundu DK, Ladha JK (1997) Effect of growing rice on nitrogen mineralization in flooded soil. Soil Sci Am J 61: 839-845.
- Kundu DK, Ladha JK, Lapitan de Gujman E (1996) Tillage depth influence on soil nitrogen distribution and availability in rice lowland. Soil Sci Soc Am J 60: 1153-1159.
- Lakew T (2015) Estimation of genetic variability and trait association in nitrogen use efficiency of upland rice varieties in North Western Ethiopia. Int J Res Rev 2: 527-535.
Citation: Boranayaka MB, Lokesha R, Latha HC and Patil R (2023) Genetic Variation, Association and Marker Validation for Nitrogen use Efficiency and their Related Traits in Recombinant Inbred Lines of Rice (Oryza sativa L.). J Plant Genet Breed 7: 165. DOI: 10.4172/jpgb.1000165
Copyright: © 2023 Boranayaka MB, et al. This is an open-access article distributed under the terms of the Creative Commons Attribution License, which permits unrestricted use, distribution and reproduction in any medium, provided the original author and source are credited.
Select your language of interest to view the total content in your interested language
Share This Article
Open Access Journals
Article Tools
Article Usage
- Total views: 1052
- [From(publication date): 0-2023 - Jun 09, 2025]
- Breakdown by view type
- HTML page views: 788
- PDF downloads: 264