Improved Method for Estimating M-Spike Proteins in Serum Protein Electrophoresis
Received: 25-Mar-2014 / Accepted Date: 24-Jun-2014 / Published Date: 26-Jun-2014 DOI: 10.4172/2161-0681.1000178
Abstract
Context: Serum monoclonal immunoglobulin (M-spike) in multiple myeloma is measured by gel electrophoresis (SPE) followed by densitometric scanning of the gel. The current standard methods delimit the M-spike component based on the projected gel image on screen (current standard method, CSM). However, the M-spike could also be selected by delimiting the peak(s) in the scanned curve (densitometry based method, DBM).
Objective: The current study will correlate the results with these two approaches and to investigate which method may yield a result more close to the actual M-spike in the serum.
Designs: Forty-one consecutive SPE files from 2010-2011 with positive M-spike were analyzed simultaneously with methods CSM and DBM. Serum monoclonal IgG from a myeloma patient with essentially no background polyclonal immunoglobulins was purified using protein G sepharose column and quantified using UV spectrophotometry. The measured concentration of purified IgG using methods CSM and DBM was compared to true IgG levels in spiked samples.
Results: The measurements of 41 M-spikes using methods CSM and DBM correlated significantly (r=0.988, p<0.01). However, the measurement using method DBM was consistently higher than that using method CSM (49% ± 24%) In the measurement of purified monoclonal IgG, compared to method CSM, method DBM gave consistently closer results to the true IgG levels in spiked samples.
Conclusions: The current method (CSM) underestimates the amount of serum M-spike. The revised method (DSB) based on the densitometric peak more accurately reflects serum M-spike levels using SPE.
Keywords: Serum monoclonal immunoglobulin; Serum protein electrophoresis; M-spike proteins
314346Introduction
The accurate quantification of monoclonal proteins (M-spike) in serum protein electrophoresis (SPE) is critical for the diagnosis of plasma cell neoplasms and monitoring of treatment of plasma cell myeloma [1-4]. The M-spike is identified using SPE and a curve representing the relative percentage of serum proteins is obtained based on densitometric scanning of the gel. The concentration of M-spike is then calculated based on the estimated percentage of M-spike and the total serum protein concentration.
Clearly, the specific method for delimiting the M-spike component on a background of other normal protein components will affect the final M-spike concentration. The current standard method (CSM) delimits the M-spike component based on the gel image.
However, the size of the M-spike is directly affected by the judgment of the intensity of the image projected on the screen (our internal experience and personal communication with Dr. Rita Ellerbrook, Helena Laboratories, Beaumont, TX, see Supplemental file).
Alternatively, the M-spike can also be selected by noting the sharp change in the scanned curve (densitometry based method, DBM). The latter approach is straightforward and can be done in a consistent manner by different operators (our internal experience). However, it generally results in higher M-spike estimations than those obtained with the image as a guide. The purpose of this study was to compare the results of these two approaches and to investigate which method may yield a more accurate result that is closer to the actual monoclonal protein in the serum.
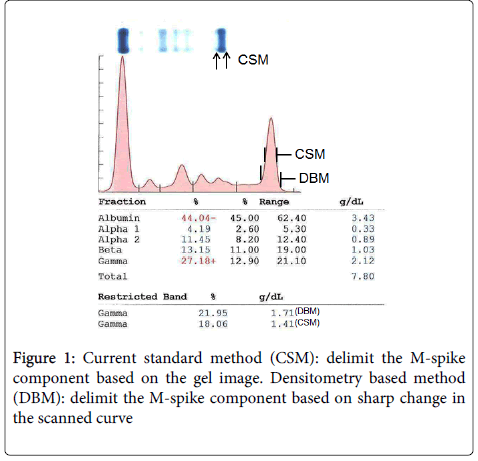
This study was performed as a quality improvement project in our clinical laboratory. Forty-one consecutive SPE files from 2010-2011 with positive M-spike were retrieved from hematology laboratory of Montefiore Medical Center, Albert Einstein College of Medicine, Bronx, NY. To obtain the M-spike results, the percentage of M-spike in a sample is first determined either by delimiting the M-spike on the projected image (CSM) or based solely on sharp change in the scanned curve (DBM).
The concentration of M-spike is then calculated based on the obtained percentage and the predetermined total protein concentration of the sample.
Purification of Monoclonal Immunoglobulin
Monoclonal immunoglobulin, IgG kappa, was purified using protein G sepharose beads (Sigma-Aldrich, St. Louis, MO) from an anonymized multiple myeloma patient serum following the manufacturer’s protocol. The concentration of purified monoclonal IgG kappa was determined using UV spectrophotometry. Then the pure monoclonal IgG was mixed with a normal serum with known protein concentrations at different ratios.
The sera were subjected to SPE and the M-spikes were measured simultaneously using both methods CSM and DBM.
Statistical Analysis
The Student’s paired t-test was used to calculate the p-value for the use of CSM or DBM in measuring purified monoclonal immunoglobulin compared with that using UV spectrophotometry. Correlations were obtained through calculating Pearson correlation R value.
Results
In accordance with the standard method, the percentage of M-spike in a serum sample was obtained by delimiting the M-spike component based on the projected get image (CSM, Figure 1, top part). For the modified method, the percentage of M-spike was obtained based on sharp change in the scanned curve (DBM, Figure 1, lower part).
The concentration of M-spike was represented by the product of percentage of M-spike and the predetermined total protein concentration of the sample.
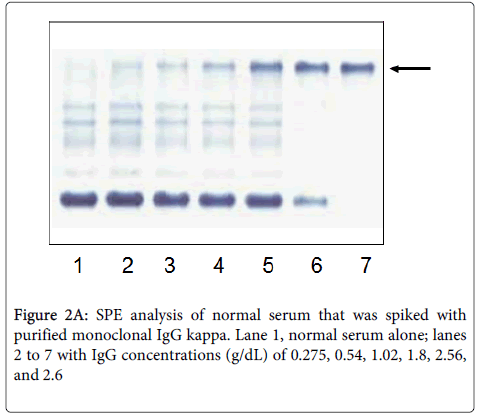
To check which of these two approaches (CSM and DBM) might provide more accurate M-spike measurements, a monoclonal IgG kappa from an established multiple myeloma patient with a high level of the protein was purified using protein G affinity purification. The concentration of purified monoclonal IgG was determined to be 2.59 g/dL by UV spectrophotometry [5]. The purity of the IgG was determined by gel electrophoresis of the sample (Figure 2A, lane 7) and was determined to be >90%.
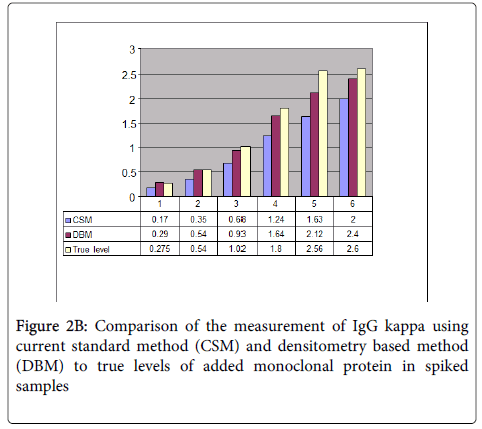
Normal serum with a known protein concentration was then spiked with the following varying percentages of this purified IgG 5, 10, 20, 40, 80 and 100 (Figure 2A, lanes 2 to 7 respectively). As shown in Figure 2B, method DBM gave a similar estimation compared to UV spectrophotometry (p=0.177), while method CSM significant underestimated IgG concentration compared to UV spectrophotometry (p=0.045).
Method DBM gave a consistently more accurate estimation compared to method CSM consistently more accurate estimation compared to method CSM.
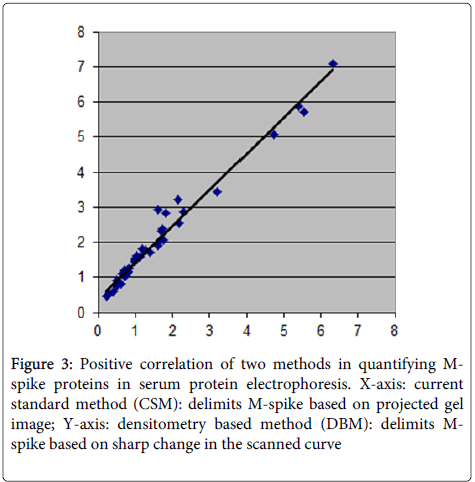
To compare the M-spike quantification using methods CSM and DBM, consecutive SPE samples were analyzed simultaneously with these two methods. The measurements of M-spike using methods CSM and DBM were significantly correlated (R2 0.9769, p<0.01) (Figure 3). However, the measurement using method DBM was consistently greater than that using method CSM (49% ± 24%).
Discussions
Accurate measurement of M-spike is clinically important for the diagnosis, classification and follow-up of plasma cell neoplasms. The current standard method of quantifying M-spike is based on the projected gel image. However, the size of the M-spike is directly affected by the intensity of the image projected on the screen. There is also significant variance both intra- and inter-operatively (our internal experience and personal communication with Dr. Rita Ellerbrook, Helena Laboratories, Beaumont, TX, see Supplemental file). Here we proposed a new method of measuring M-spike based on scanned curve (densitometry based method). It is more straight forward and likely to be less affected by inter-operator’s variance.
The densitometry based method gave consistently higher value compared to current standard method. By comparing with UV spectrophotometry method, DBM is also more accurate than CSM in M-spike quantification. While this is a small study and its clinical significance remains to be studied, we do suggest that laboratory standard panels consider recommending that DBM to be considered in the clinical M-spike quantification by SPE.
References
- Dispenzieri A, Zhang L, Katzmann JA, Snyder M, Blood E, et al. (2008) Appraisal of immunoglobulin free light chain as a marker of response. Blood 111: 4908-4915.
- Smith A, Wisloff F, Samson D, UK Myeloma Forum, Nordic Myeloma Study Group, et al. (2006) Guidelines on the diagnosis and management of multiple myeloma 2005. Br J Haematol 132: 410-451.
- Durie BG, Kyle RA, Belch A, Bensinger W, Blade J, et al. (2003) Myeloma management guidelines: a consensus report from the Scientific Advisors of the International Myeloma Foundation. Hematol J 4: 379-398.
- Keren DF, Alexanian R, Goeken JA, Gorevic PD, Kyle RA, et al. (1999) Guidelines for clinical and laboratory evaluation patients with monoclonal gammopathies. Arch Pathol Lab Med 123: 106-107.
- Stoscheck CM (1990) Quantitation of protein. Methods Enzymol 182: 50-68.
Citation: Zhang S, Wu XX, Ostrovsky I, Rand JH (2014) Improved Method for Estimating M-Spike Proteins in Serum Protein Electrophoresis. J Clin Exp Pathol 4:178. DOI: 10.4172/2161-0681.1000178
Copyright: © 2014 Zhang S, et al. This is an open-access article distributed under the terms of the Creative Commons Attribution License, which permits unrestricted use, distribution, and reproduction in any medium, provided the original author and source are credited.
Select your language of interest to view the total content in your interested language
Share This Article
Recommended Journals
Open Access Journals
Article Tools
Article Usage
- Total views: 19358
- [From(publication date): 9-2014 - Jul 06, 2025]
- Breakdown by view type
- HTML page views: 14657
- PDF downloads: 4701


