Method Development for the Determination of Commercial Formulation of Difenoconazole Fungicide Using UV-Visible Spectrophotometer
Received: 17-Jul-2018 / Accepted Date: 28-Jul-2018 / Published Date: 31-Jul-2018 DOI: 10.4172/2155-9872.1000410
Keywords: 1,10-Phenanthroline; Ferric chloride; Beer’s Law; Accumulation; Heavy metals; Tomato; Flame atomic absorption spectrometer; Muffle furnace
Introduction
The biological chemicals that alter the growth of fungi are called fungicides. The decrease in crop production is the serious issue developed by fungi [1]. Fungicides are responsible to either spoil fungal cell membranes or it may interfere with energy production within fungal cells [2]. Fungicides can alter the nature of agriculture. Good quality crops are crucial for healthy life of human being. For the improvement of crop production researchers are investigating the fungicides of new formulations [3,4]. Difenoconazole is an active agent protecting plants, fruits and vegetables from fungal diseases.
The difenoconazole is a strobilurin fungicide and its chemical formula is (3-chloro-4-[(2RS,4RS;2RS,4SR)-4-methyl-2-(1H-1,2,4- triazol-1-methyl)-1,3-dioxolan-2-yl] phenyl4-chlorophenyl ether) [3- 5]. Difenoconazole can cease the growth of fungi leaving healthy plant and its seeds [3,6-9]. Difenoconazole is safe from the environmental point of view. The fungicides lead to the inhibition of mitochondrial respiration in fungi either prevent the export of ATP, or the import of raw materials across the mitochondrial inner membrane and eventually destroying its activity [2,6,7]. The plants for which difenoconazole are more effective are vegetables, rice, cereals, vines, fruits and ornamentals. Difenoconazole diffuses directly through the leaf to vascular tissue and then through xylem and transported within the leaf [10-13]. Various studies have been carried out on difenoconazole using liquid chromatography coupled to tandem mass spectrometry with atmospheric pressure electrospray ionization (LC–ESI-MS/MS) [14,15], LC-MS/MS [16-19] and gel permeation chromatography-gas chromatography/mass spectrometry (GPC-GC/MS) [20]. Researchers all over the world are working on different aspects of this drug. As no research work has been done on spectrophotometric aspect of difenoconazole and the spectrophotometric technique is cheap and easily available technique. Thus, the present study is aimed to develop a simple, sensitive and cheap method for the analysis of difenoconazole in standards and commercial formulation.
Experimental
Materials and methods
Equipment: A UV/Visible spectrophotometer (Shimadzu, UV- 1800, ENG 240 V) was used for analysis. The samples/standards were weighed using digital analytical balance (OHAUS Corporation USA).
Reagents: Analytical grade reagents were used in this study. Difenoconazole, 1,10-phenanthroline, ferric chloride, ethanol and methanolwere purchased from Sigma-Aldrich, Germany and BDH, England prepared sodium hydroxide was used. The commercially formulated difenoconazole contains 18.2% active ingredient.
Solutions:
Preparation of difenoconazole standard solution: A standard stock solution of difenoconazole (300 μg/100 mL) was prepared by dissolving 0.0003 g of difenoconazole in 20 mL methanol and diluted with methanol up to 100 mL.
Preparation of sodium hydroxide solution: Sodium hydroxide solution (5 mol/L) was prepared by dissolving 20 g in 20 mL of distilled water and diluted with distilled water up to 100 mL.
Preparation of ferric chloride solution: Ferric chloride solution (5%) was prepared by dissolving 5 g in 100 mL with methanol. In order to sustain all the iron atoms in ferric (III) oxidation state, 2-3 mL of concentrated sulphuric acid was added to the above solution.
Procedure: From the standard stock solution of difenoconazole (300 μg/mL) 3 mL was taken in a test tube followed by the addition of 0.5 mL of 5 M Ferric chloride solution. To the above mixture 0.4 mL of 4 M Sodium hydroxide solution was added and equilibrated for 2 minutes to complete complexation reaction. Reddish-wine color complex was obtained; its absorbance was measured at 530 nm. The solutions were stock up in Pyrex glass vessels.
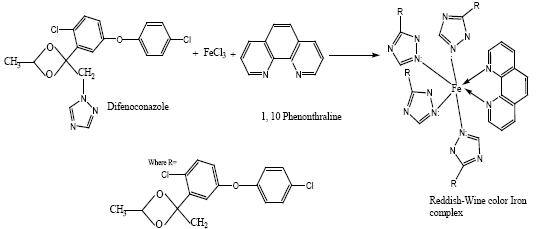
Proposed reaction: The difenoconazole reacts with ferric (III) chloride in the presence of 1,10-phenanthroline in alkaline media and forms a reddish-wine color complex. The 1,10-phenanthroline acts as auxiliary reagent satisfying the oxidation state of Fe+3 cation. The nitrogenous group present in difenoconazole acts as ligand and provide lone-pairs of electrons to iron (III) for complex formation. The proposed mechanism is given as under:
Results and Discussion
Absorption maximum of difenoconazole
The colored difenoconazole solution was scanned in the range of 400-680 nm for investigation of λmax. The absorbance was plotted against the wavelength. The curve shows the absorbance maximum of the complex solution at 530 nm which can be observed in Figure 1. The optimization study of various parameters for the spectrophotometric method development was carried out at 530 nm wavelength.
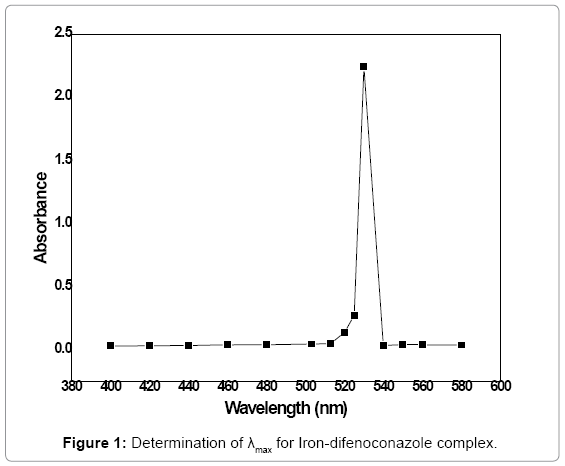
Figure 1: Determination of λmax for Iron-difenoconazole complex.
Optimization of various parameters for Fe-difenoconazole complex
Concentration optimization of 1,10 phenanthroline: The concentration of 1,10 phenanthroline was optimized by using a range (0.01-0.1 mol/L) of its concentration with a 0.02 interval. The complex was obtained by reacting 3 mL of (3 ppm) difenoconazole, 1 mL of (5 M) NaOH and 0.4 mL of (5%) FeCl3 for 2 min and its absorbance was measured at 530 nm (Figure 2). Maximum absorbance was observed at 0.06 mol/L concentration of 1,10 phenanthroline. Thus 0.06 mol/L concentration of 1,10 phenanthroline is the optimum concentration that favors maximum formation of the complex. Beyond 0.06 mol/L concentration of 1, 10 phenanthroline the plot shows sudden falls because complexation reaction has already been completed and all the active sites of the ligand are blocked.
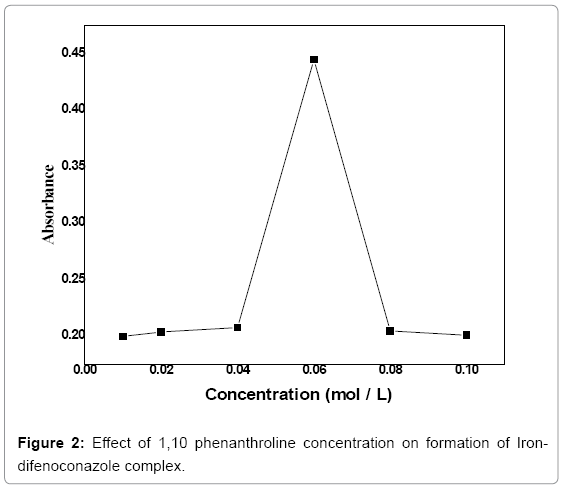
Figure 2: Effect of 1,10 phenanthroline concentration on formation of Irondifenoconazole complex.
Volume optimization of 1, 10 phenanthroline: The difenoconazole was treated with a range of volumes (0.5-5 mL) of 1, 10 phenanthroline (0.06 mol/L) with an interval of 0.5 ml. 3 mL of (3 ppm) difenoconazole was reacted with 1 mL of (5 M) NaOH, 0.4 mL of (5%) FeCl3 and different volumes of 1, 10 phenanthroline within the given range andthe reaction was allowed for 2 min. The absorbance of the product complex was measured at 530 nm. The curve showed maximum absorption at 2.5 mL beyond which a decrease in absorbance was observed. The absorbance was plotted against volume of 1, 10 phenanthroline solution shown in Figure 3.
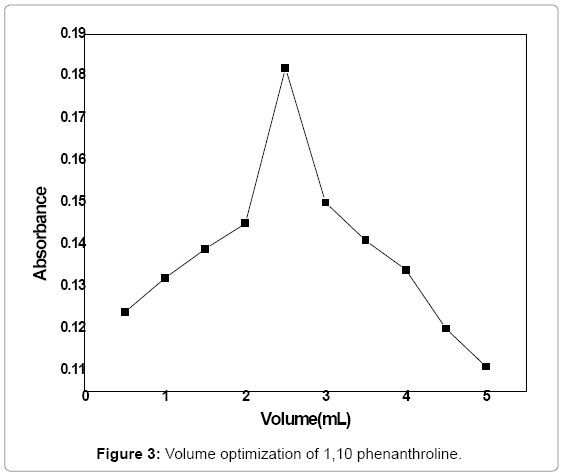
Figure 3: Volume optimization of 1,10 phenanthroline.
Concentration optimization of sodium hydroxide: A range of NaOH concentration (1-8 mol/L) was explored with an interval of 1 mol/Lin order to optimize its concentration for the formation of Irondifenoconazole complex at PH-8.5. Various concentrations of NaOH according to the mentioned range were reacted with 3 mL of 3 ppm difenoconazole, 2.5 mL of 0.06 mol/L of 1,10 phenanthroline, 1 mL of NaOH solution and 0.4 mL of FeCl3 (5%) solution for 2 min and absorbance of the product was measured at 530 nm. The absorbance was plotted versus NaOH concentration that is given in Figure 4. The maximum absorbance was observed at 4 mol/L of NaOH. Thus, at 4 mol/L maximum complex formation takes place.
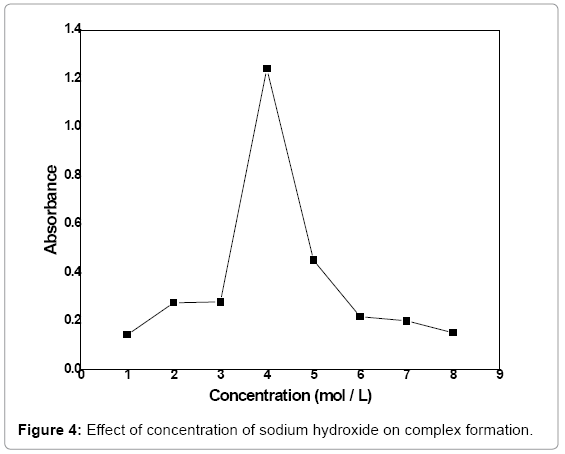
Figure 4: Effect of concentration of sodium hydroxide on complex formation.
Volume optimization of sodium hydroxide: A range of volume of NaOH solution (0.1-0.8 mL) was used with a 0.1 mL interval in order to find out its optimum volume. 3 mL of 3 ppm difenoconazole was treated with 2.5 mL of 0.06 mol/L of 1,10 phenanthroline, 0.4 mL of FeCl3 (5%) solution and various volumes of 4 mol/L NaOH solution were used in the given range and the reaction was allowed for 2 min. At 530 nm the absorbance of the formed complex was measured. The absorbance peak can be observed at 0.4 mL NaOH which shows maximum formation of the complex (Figure 5).
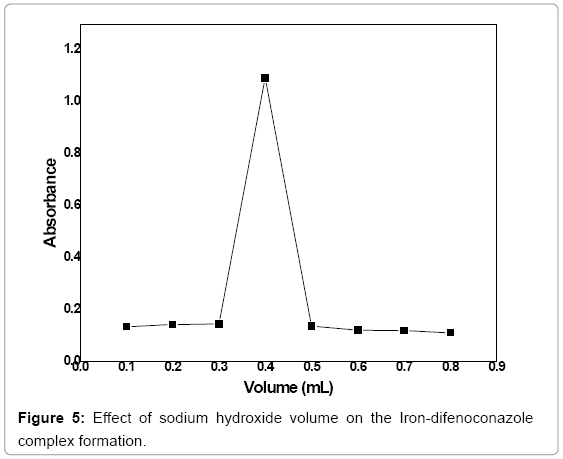
Figure 5: Effect of sodium hydroxide volume on the Iron-difenoconazole complex formation.
Concentration optimization of ferric (III) chloride: The Iron-difenoconazole complex was formed by treating different concentrations of FeCl3 solution (1-8 mol/L) with 3 mL of 3 ppm difenoconazole, 2.5 mL of 0.06 mol/L of 1,10 phenanthroline and 0.4 ml of 4 mol/L NaOH solution and the reaction was allowed for 2 min. Absorbance of the formed complex was measured at 530 nm. The absorbance was plotted against concentration of FeCl3 solution (Figure 6). The curve shows a peak at 5 mol/L concentrations of FeCl3 which indicates maximum formation of complex at this concentration. Thus, the optimum concentration of FeCl3 solution for the formation ofIrondifenoconazolecomplex can be considered as 5 mol/L under the given reaction conditions.
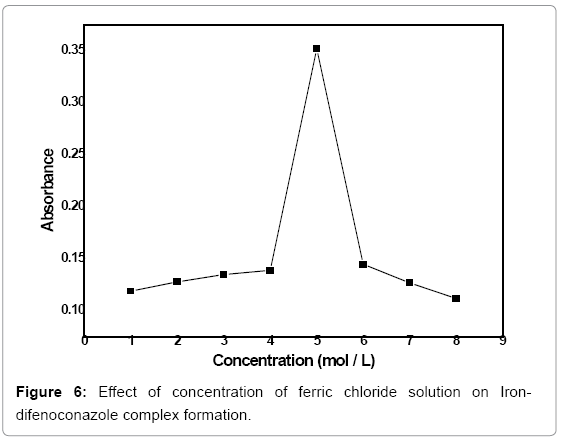
Figure 6: Effect of concentration of ferric chloride solution on Irondifenoconazole complex formation.
Volume optimization of ferric chloride: In order to find out the optimum volume of the FeCl3 solution, different volumes of 5 mol/L FeCl3 solutions (0.1-0.8 mL) were treated with 3 mL of 3 ppm standard solution of difenoconazole, 2.5 mL of 0.06 mol/L of 1,10 phenanthroline and 0.4 mL of 4 mol/L NaOH solution for 2 min and absorbance of the product was measured at 530 nm. The absorbance was recorded for all these solutions and plotted against volumes of FeCl3 solution (Figure 7). It can be observed from the figure that maximum absorbance takes place at 0.5 mL volume of FeCl3 solution under the given conditions. Thus 0.5 mL volume of the FeCl3 solution is the optimum volume of the reagent for complex formation.
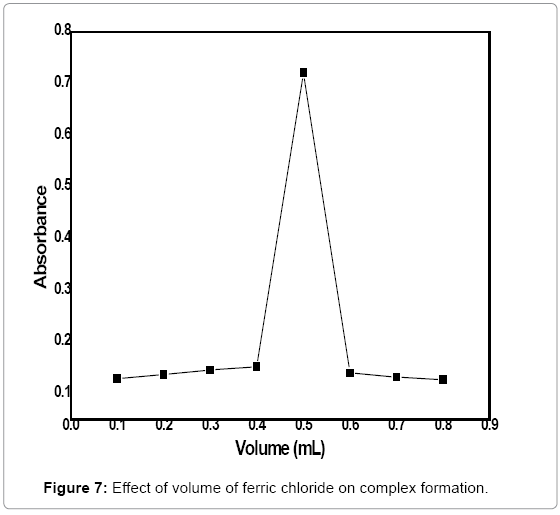
Figure 7: Effect of volume of ferric chloride on complex formation.
Reaction time optimization: To ensure maximum formation of the Iron-difenoconazole complex, the optimum reaction time was investigated. The complex was formed at the optimized conditions such as 0.5 mL of 5 mol/L FeCl3 solutions, 3 mL of 3 ppm standard solution of difenoconazole, 2.5 mL of 0.06 mol/L of 1,10 phenanthroline and 0.4 ml of 4 mol/L NaOH solution at different reaction times. The reaction was allowed for different time intervals ranging from 1 to 6 minutes. Absorbance of the formed complex was measured at the ʎmax and plotted against the reaction time (Figure 8). It can be observed from the figure that maximum absorbance takes place at 2 minutes, which could be considered as optimum reaction time for the complex formation under the given conditions.
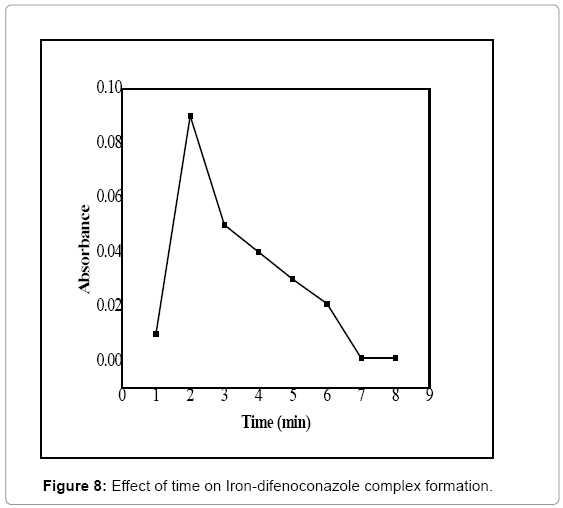
Figure 8: Effect of time on Iron-difenoconazole complex formation.
Verification of Beer-Lambert law
Inorder to find out the concentration range in which the Beer Lambert’s law is followed, the absorbance of a range of solutions (0.5-20 mol/L) of complex was measured at 530 nm (Figure 9). A straight line was obtained up to 14 mol/L beyond which increase in the absorbance cannot be observed accordingly. Thus, beyond 14 mol/L concentration of the complex, the absorbance seems to be constant with increase in the concentration. Thus, the solution obeys Beer-Lambert law in the concentration range of 0.5-14 mol/L and deviation from the Beer- Lambert law is caused beyond this concentration.
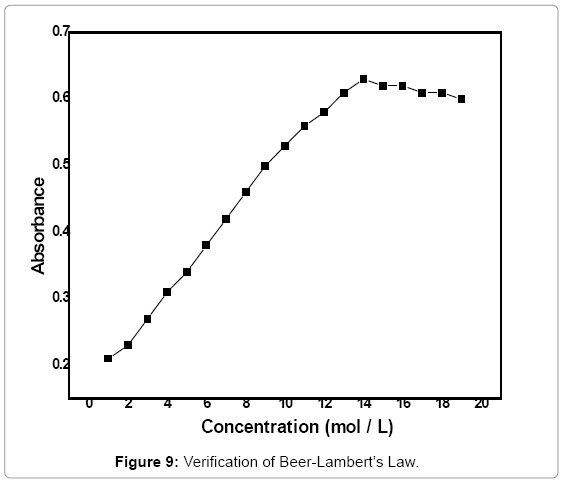
Figure 9: Verification of Beer-Lambert’s Law.
Analytical parameters
Under the optimized experimental conditions, a linear relation was observed between absorbance and concentration in the range of 1.0-14 μg mL-1 (Figure 8). Table 1 shows the statistical parameters calculated from the calibration curve. The molar absorptivity of the resulting reddish wine colored complex was found to be 2.56 × 10⁵ L mol-1 cm-1. The limit of detection (LOD) and quantification (LOQ) were calculated using the lowest concentration at which difenoconazole could be detected reliably and they were found to be 0.106 and 0.35 μg mL-1 respectively (Table 2).
| S No | Parameter | Value |
|---|---|---|
| 1 | λmax (nm) | 530 |
| 2 | Beer’s law range (µg mL-1) | 1.0-14 |
| 3 | Molar absorptivity (ε) (L mol-1 cm-1) | 2.56 × 10⁵ |
| 4 | Limit of Detection (µg mL-1) | 0.106 |
| 5 | Limit of Quantification (µg mL-1) | 0.35 |
| 6 | Standard deviation | 0.035 |
| 7 | RSD (%) | 5.8 |
| 8 | Correlation Coefficient | 0.98 |
| 9 | Slope | 0.035 |
| 10 | Intercept | 0.170 |
Table 1: Analytical parameters for the Iron-difenoconazole.
| S No | µg mL-1 taken | µg mL-1 Determined | % Recovery ± SD |
|---|---|---|---|
| 1 | 1.0 | 0.89 | 99.12 ± 0.18 |
| 2 | 2.0 | 1.89 | 97.37 ± 0.12 |
| 3 | 3.0 | 2.97 | 99.707 ± 0.135 |
Table 2: Determination of difenoconazole in commercial formulation.
Percent recovery
A recovery test was performed on the determination of difenoconazole in commercial formulation. The average recoveries were found in the range of 97.37-99.75% (Table 3). In order to evaluate the analytical applications of the proposed method, it was appliedfor difenoconazole determination in commercial formulations. The results obtained applying the newly developed method was comparable with the labeled values (Tables 4 and 5).
| Conc. | Abs | G.R (Xi) | Xi-X | (Xi-X)2 | |
|---|---|---|---|---|---|
| 3 | 0.271 | 2.8684211 | 1.7631579 | 3.1087258 | |
| 3 | 0.274 | 2.9473684 | 1.8421053 | 3.3933518 | |
| 3 | 0.282 | 3.1578947 | 2.0526316 | 4.2132964 | |
| 2.9912281 | 10.715374 | ||||
| ∑(Xi-X)2/n-1 | |||||
| SD= | 5.357687 | 2.3146678 | |||
| % Recovery= | 99.7076 | ± 2.314 |
Table 3: Precision and accuracy of the standard (3 μg/mL).
| Conc. | Abs | G.R (Xi) | Xi-X | (Xi-X)2 | |
|---|---|---|---|---|---|
| 1 | 0.202 | 1.0526316 | -0.0526316 | 0.0027701 | |
| 1 | 0.2 | 1 | -0.1052632 | 0.0110803 | |
| 1 | 0.197 | 0.9210526 | -0.1842105 | 0.0339335 | |
| 0.9912281 | 0.0477839 | ||||
| ∑(Xi-X)2/n-1 | |||||
| SD= | 0.023892 | 0.1545703 | |||
| % Recovery= | 99.12281 | ± 0.187 |
Table 4: Precision and accuracy of the commercial formulation (1 μg/mL).
| Conc. | Abs | G.R (Xi) | Xi-X | (Xi-X)2 | |
|---|---|---|---|---|---|
| 2 | 0.231 | 1.8157895 | -0.1315789 | 0.017313 | |
| 2 | 0.237 | 1.9736842 | 0.0263158 | 0.0006925 | |
| 2 | 0.24 | 2.0526316 | 0.1052632 | 0.0110803 | |
| 1.9473684 | 0.0290859 | ||||
| ∑(Xi-X)2/n-1 | |||||
| SD= | 0.0145429 | 0.1205941 | |||
| % Recovery= | 97.36842 | ± 0.12 |
Table 5: Precision and accuracy of the commercial formulation (2 μg/mL).
Conclusion
It can be concluded that a colored complex was obtained by reacting difenoconazole with FeCl3 in the presence of 1, 10 phenanthroline. For the maximum complex formation, various parameters i.e., time of reaction, concentration and volume of reagents were optimized. The recorded molar absorptivity, Limit of detection and quantification for the complex are 2.25 × 10⁵ L mol-1 cm-1, 0.106 μg mL-1 and 0.35 μg mL-1, respectively. The complex follows Beer-Lambert law up to 14 μg mL- 1. The developed spectrophotometric method for the determination of difenoconazole in drug sample is simple, cheap, sensitive and reproducible.
Acknowledgements
The financial support of the Higher Education Commission of Pakistan is highly acknowledged.
References
- Correia M, Rodrigues M, PaÃga P, Delerue-Matos C (2016) Fungicides Encyclopedia. Food and Health 1: 169-176.
- Russell PE (2005) A century of fungicide evolution. J Agri Sci 143: 11-25.
- Edwards PG, Murphy TM, Lydy MJ (2016) Fate and transport of agriculturally applied fungicidal compounds, azoxystrobin and propiconazole. Chemosphere 146: 450-457.
- Blandino M, Galeazzi M, Savoia W, Reyneri A (2012) Timing of azoxystrobin+propiconazole application on maize to control northern corn leaf blight and maximize grain yield. Field Crops Research 139: 20-29.
- Ijaz M, Honermeier B (2012) Effect of triazole and strobilurin fungicides on seed yield formation and grain quality of winter rapeseed (Brassica napus L.). Field Crops Research 130: 80-86.
- Flores JL, DÃaz AM, de Córdova MLF (2007) Determination of azoxystrobin residues in grapes, musts and wines with a multicommuted flow-through optosensor implemented with photochemically induced fluorescence. Analytica Chimica Acta 585: 185-191.
- Kim YS, Dixon EW, Vincelli P, Farman ML (2003) Field resistance to strobilurin (QoI) fungicides in Pyricularia grisea caused by mutations in the mitochondrial cytochrome b gene. Phytopathology 93: 891-900.
- Affourtit C, Heaney SP, Moore AL (2000) Mitochondrial electron transfer in the wheat pathogenic fungus Septoria tritici: on the role of alternative respiratory enzymes in fungicide resistance. Biochimica et Biophysica Acta (BBA)-Bioenergetics 1459: 291-298.
- Lucas JA, Hawkins NJ, Fraaije BA (2015) The evolution of fungicide resistance. Advances in Applied Microbiology 90: 29-92.
- Carpinteiro I, Ramil M, RodrÃguez I, Cela R (2010) Determination of fungicides in wine by mixed-mode solid phase extraction and liquid chromatography coupled to tandem mass spectrometry. Journal of Chromatography A 1217: 7484-7492.
- Rodrigues SA, Caldas SS, Primel EG (2010) A simple, efficient and environmentally friendly method for the extraction of pesticides from onion by matrix solid-phase dispersion with liquid chromatography-tandem mass spectrometric detection. Analytica Chimica Acta 678: 82-89.
- Hingmire S, Oulkar DP, Utture SC, Shabeer TA, Banerjee K (2015) Residue analysis of fipronil and difenoconazole in okra by liquid chromatography tandem mass spectrometry and their food safety evaluation. Food Chemistry 176: 145-151.
- Kong Z, Dong F, Xu J, Liu X, Zhang C, et al. (2012) Determination of difenoconazole residue in tomato during home canning by UPLC-MS/MS. Food Control 23: 542-546.
- Xu XM, Yu S, Li R, Fan J, Chen SH, et al. (2012) Distribution and migration study of pesticides between peel and pulp in grape by online gel permeation chromatography-gas chromatography/mass spectrometry. Food Chemistry 135: 161-169.
Citation: Khan KA, Gulab H, Haider F (2018) Method Development for the Determination of Commercial Formulation of Difenoconazole Fungicide Using UV-Visible Spectrophotometer. J Anal Bioanal Tech 9: 410. DOI: 10.4172/2155-9872.1000410
Copyright: © 2018 Khan KA, et al. This is an open-access article distributed under the terms of the Creative Commons Attribution License, which permits unrestricted use, distribution, and reproduction in any medium, provided the original author and source are credited.
Select your language of interest to view the total content in your interested language
Share This Article
Open Access Journals
Article Tools
Article Usage
- Total views: 6428
- [From(publication date): 0-2018 - Dec 18, 2025]
- Breakdown by view type
- HTML page views: 5319
- PDF downloads: 1109