Novel Diffusion-Kurtosis-Informed Template Reduces Distortions due to Partial Volume Effects and Improves Statistical between-Group Comparisons
Received: 10-Oct-2017 / Accepted Date: 23-Oct-2017 / Published Date: 30-Oct-2017 DOI: 10.4172/2161-0460.1000393
Abstract
Objective: Quantitative diffusion magnetic resonance imaging measures carry information about microstructural properties of the underlying tissue. Proper elucidation of their differences in healthy state and pathology, such as Alzheimer’s or Parkinson’s diseases, requires that these measures must be specific for the tissue or anatomic region of interest. However, they are often subjected to biases caused by partial volume effects and leading to erroneous analyses. The purpose of this work was to develop a novel tool allowing one to eliminate affected voxels from statistical analyses and, thus, improve accuracy of the derived measures and enhance reliability of between-group comparisons.
Methods: In vivo diffusion kurtosis measurements were performed with a whole-body 3T Siemens MAGNETOM scanner for two differently aged groups of healthy volunteers. Mean values of typical diffusion tensor and kurtosis tensor metrics were estimated for 20 white matter anatomic regions. Relative differences between the group mean parameters in percentage and Cohen’s d values, as well as p-values of two-sided t-test analysis were evaluated before and after correction for partial volume effects.
Results: We showed that using the tissue-specific features of diffusion kurtosis distributions allows one to reduce contamination of white matter structures by partial volume effects from neighbouring grey matter regions and cerebrospinal fluid. The performance of the developed method was demonstrated in the semi-automatic atlasbased comparison of two differently aged groups of healthy subjects showing that, after correction, the effect sizes of between-group differences in many regional diffusion indices become larger, whereas p-values of the t-tests decrease.
Conclusion: Our work shows that excluding affected voxels from statistical analyses allows one to reduce confounding effects of mixing tissues and improves between-group comparisons. The proposed method is expected to be especially useful for detection of subtle between-group differences and longitudinal changes in studies of neurodegenerative pathologies and ageing associated with white matter atrophy.
Keywords: Brain; Microstructure; Diffusion kurtosis imaging; Partial volume effects; Between-group comparisons; Atlas-based statistical analysis
Introduction
Diffusion tensor imaging (DTI) [1] and diffusion kurtosis imaging (DKI) [2] metrics are influenced by cellular tissue properties and tend to alter significantly during the life span [3,4] or as a result of various pathologies, including Schizophrenia [5] and Neurodegenerative diseases, such as mild Cognitive impairment [6], Alzheimer’s, Parkinson’s and Multiple sclerosis [7-13]. Therefore they are often used in between-group comparisons of patients versus control groups and for studying the correlations with age or cognitive performance. However, the methodology of between-group comparisons and of statistical correlation analysis has not been yet sufficiently well established. Popular methods include the region-of-interest (ROI) analysis [14,15], whole brain voxel-based morphometry (VBM) [16-18] and the trackbased spatial statistics (TBSS) [19,20]. Each of the methodologies suffers from specific problems reducing its statistical power or sensitivity. In particular, VBM methods require alignment of images to a template followed by independent hypothesis tests per voxel which are smoothed and corrected for multiple comparisons. The benefit of VBM analysis is that it is fully automated and applies to the whole brain without the necessity of a priori ROI pre-specification. However, problems might arise due to alignment inaccuracies, arbitrary smoothing and clustering procedures, as well as due to requirements for multiple-comparison corrections providing challenges for valid statistical inferences [21].
A modified voxel-based approach, TBSS, attempts to overcome the problems of mis-registration by skeletonizing white matter (WM) tracts and considering only the voxels of the mean skeleton derived from FA maps. It is fully automated and does not require ROI pre-specification. However, since the skeleton is formed only by a small fraction of voxels, constituting about 2% of the total number of voxels, potentially useful information occurs to be significantly reduced.
In the ROI-based analyses, diffusion metrics of interest are averaged over the voxels of ROIs. The averaged characteristics are relatively simple and sensitive to small changes in parameters of interest [22]. The problems, however, are associated with the necessity of manual and thus user-biased and time-consuming delineation of the ROIs. The ROI-based methods do not enable whole-brain investigations and are very susceptible to inter-user variability. Besides, the ROI placements appear poorly reproducible in cross-sectional and longitudinal studies [22].
The atlas-based segmentation tries to overcome these difficulties by automatically defining the ROIs using co-registration of the subject’s parameter maps with population-averaged stereotaxic WM atlases, such as the so-called ICBM-DTI-81 white-matter label atlas and Johns-Hopkins-University white-matter tractography atlases [23-26], available for open use in the FSL toolkit (http://fsl.fmrib.ox.ac.uk/ fsl/fslwiki/Atlases). However, the atlas-based segmentation appears especially sensitive to errors in inter-subject co-registration using affine transformations. An additional source of serious problems is the influence of partial volume effects (PVE), i.e., the contribution of mixed signals from different tissues within the same voxel owing to finite imaging resolution [27-29] and/or misregistration. Encountering for “wrong” tissue signals due to incorrect segmentation or PVE may give rise to significant errors in the analysis of regional diffusion properties reducing the accuracy of tissue characterisation, on the one hand and leading to variable inferences across studies, on the other.
Partial volume artefacts at tissue boundaries, especially between WM and cerebrospinal fluid (CSF) or grey matter (GM), represent a problematic confound in between-group comparisons, in particular and in diffusion MRI, in general. Given, in addition, the high degree of inter-individual variety, the optimization of the MR-derived measures in order to correctly elucidate subtle changes in development, ageing, or pathology is of pivotal importance.
The purpose of this work was to demonstrate that the application of a simple, robust diffusion-kurtosis-informed template (D-KIT) is able to essentially reduce contamination of WM ROIs by PVE from neighbouring non-WM (GM and CSF) regions at tissue interfaces and improves atlas-based between-group comparisons. The application is demonstrated in a DKI study of a group of children versus a group of adults. The results are compared before (published recently in [30]) and after the use of D-KIT for PVE correction.
Materials and Method
Subjects
Two groups of healthy volunteers, 20 children (range, 9-12 years, mean age, 10.3) and 21 adults (range, 38-64 years, mean age, 54.3) underwent DKI after providing written informed consent by themselves or by their parents in the case of the children.
Experiments
In vivo DKI measurements were performed with a whole-body 3T Siemens MAGNETOM Tim-Trio scanner (Siemens Medical Systems, Erlangen, Germany). The body coil was used for RF transmit and the manufacturer’s 12-element phased array coil for signal receive. The gradient system provided a maximal gradient strength of 40 mT/m and slew rate of 200 T/m/s. Diffusion-weighted images (DWIs) were acquired along 30 directions of the diffusion encoding gradients for b=0.1 and 2.8 ms μm-2 using the manufacturer’s double spin-echo EPI pulse sequence with TR=10900 ms, TE=112 ms, band width=1628 Hz/ px, number of repetitions=3, total acquisition time=33 min. The voxel size was 1.9 × 1.9 × 1.9 mm3.
Post-processing and statistical analysis
Diffusion tensor (DT) scalar invariants (mean, (MD), axial (AD) and radial (RD) diffusivities and fractional anisotropy (FA)) and specific kurtosis tensor (KT) measures (mean (MK), axial (AK) and radial (RK) kurtoses and kurtosis anisotropy (KA)) were determined on a voxel-byvoxel basis in the whole brain in frame of the DKI analysis [31,32]. The post-processing steps were described in detail elsewhere [30]. In brief, DWIs were corrected for eddy-current distortions and head motion using the FDT toolkit available in FSL [33]; bias due to background noise was reduced using the power-images method [34-36]; DT/KT metrics were evaluated as described elsewhere with the help of the ExploreDTI toolkit [37]. The non-linear affine transformation available in FSL was used to align the FA maps to the FA template in the JHU space and the transformation matrix was applied for coregistration of the non-FA images. For atlas-based between-group comparisons, all DT/KT metrics were averaged over 20 WM anatomic regions provided by JHU WM tractography atlas available in FSL (http://fsl.fmrib.ox.ac.uk/fsl/fslwiki/Atlases).
The investigated WM structures in this work comprised the left and right regions of 7 major association fibres, such as cingulum (gyrus) (Cg) and cingulum (hippocampus) (Ch), superior longitudinal fasciculus (SLF), SLF (temp), inferior longitudinal fasciculus (ILF), inferior fronto-occipital fasciculus (IFOF), uncinate fasciculus (UF), the left and right regions of 2 projection fibres, anterior thalamic radiation (ATR) and corticospinal tract (CST) and 2 commissural fibres, Forceps major (F_major) (splenium of corpus callosum) and Forceps minor (F_ minor) (genu of corpus callosum). Left and right regions of the same fibre will be denoted by subscripts “L” or “R” in the abbreviation of the fibre.
A sum of two Gaussian distribution functions was fitted to the double peaked- histograms of MK according to
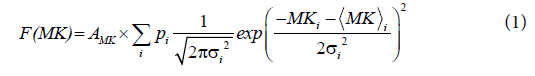
where 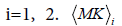 and σi are the means and the standard deviations, respectively are the weights of the individual terms (p1+p2=1). AMK is a normalization factor.
Before and after the D-KIT correction, we evaluated:
a) Relative changes (ΔA) in percentage between the group mean parameter values (Ā) according to ΔA=100*(Āadult – Āchild)/ Āchild, where A indicates one of the DT/KT parameters.
b) P-values of the between-group two-sided Student’s t-test analysis; in the following, p-values will be indicated by means of the p-index according to p>0.05 (p0); 0.01<p ≤ 0.05 (p1); 0.001<p ≤ 0.01 (p2); 0.0001<p ≤ 0.001 (p3); 0.00001<p ≤ 0.0001 (p4); p ≤ 0.00001 (p5). We shall refer to statistical betweengroup differences as significant if p ≤ 0.0025 (after Bonferroni correction for multiple comparisons, N=20) and suggestively significant if (0.0025<p<0.05). For quick visualisation on the plots, significant p-values (≤ 0.0025) will be additionally indicated by asterisks. Please note that p2 with asterisk corresponds to p ≤ 0.0025 (significant) whereas p2 without asterisk indicates p>0.0025 (suggestively significant).
c) Between-group age-related effect sizes using Cohen’s d [38] for each anatomically defined structure and for each DT/KT parameter before and after D-KIT correction.
The data before the D-KIT correction is the same as represented recently in the previous work [39].
Results
Construction of the D-KIT for improved WM parameter mapping
The goal of the D-KIT construction is to provide an improved template for DT/KT parameter mapping in WM using diffusion kurtosis information (ideally, the template voxels should represent single WM tissue). The construction of the D-KIT is based on the combination of two complimentary thresholds, FAtresh for FA and MKtresh for MK, i.e., a) FA>FAtresh (set to 0.2 in our work) and b) MK>MKtresh.
A) Two-dimensional (2d) D-KIT. The determination of MKtresh constitutes the following steps depicted schematically in Figures 1A-1D for one selected slice in one representative adult (subject 1). Consider a typical slice histogram of the MK map, Figure 1A, showing a clear double-peak structure. The sum of 2 Gaussian distribution functions, Eq. (1), was fit to the data points. Such a double-peak histogram is characteristic for brain regions containing voxels in both WM and non- WM regions [40]: the component with lower MK values is attributed (predominantly) to non-WM, the component with higher values (predominantly) to WM. However, the middle part of the histogram represents an overlap area where MK values are likely to represent either WM, non-WM, or their mixture.
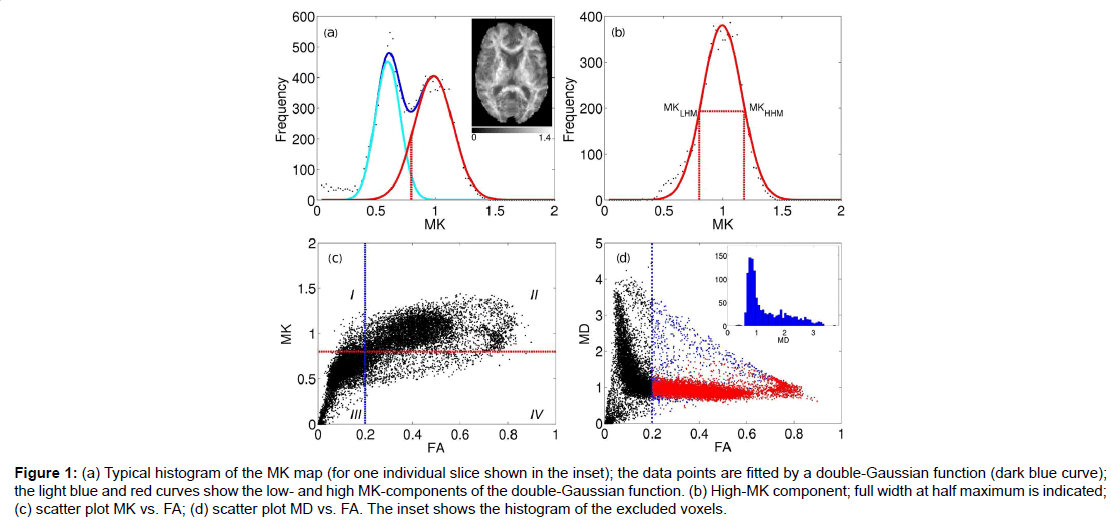
Figure 1:(a) Typical histogram of the MK map (for one individual slice shown in the inset); the data points are fitted by a double-Gaussian function (dark blue curve); the light blue and red curves show the low- and high MK-components of the double-Gaussian function. (b) High-MK component; full width at half maximum is indicated; (c) scatter plot MK vs. FA; (d) scatter plot MD vs. FA. The inset shows the histogram of the excluded voxels.
The red curve in Figure 1B shows separately the high-MK histogram component along with the data points from voxels for which FA>0.2. A good correspondence between the both is observed. The Gaussian shape of the MK distribution (red curve, Figures 1A and 1B) is beneficial for a formalised determination of MKtres: we determine the low and high half-maximum (HM) values of the high-MK Gaussian component and set MKtres to the value of MK at the low HM. This value will be denoted as MKLHM (where index L stands for low). Thus, the D-KIT is determined by selecting the voxels for which (a) FA>0.2 and (b) MK>MKLHM.
The condition (b) allows us to essentially reduce the number of voxels corresponding to the overlap area, see the “corrected” histogram component in Figure 1A, i.e., the part of the histogram right to the dashed red line. The result is demonstrated in the scatter plots of MK vs. FA (Figure 1C) and MD vs. FA (Figure 1D). The blue vertical lines in Figures 1C and 1D indicate the effect of FAtresh: data points to the left from the blue lines are eliminated by FAtresh prior to application of the condition (b). These data points refer to the voxels with relatively low MK and/or high MD characteristic of GM and/or CSF (with CSF exhibiting the lowest MK and the highest MD). However, a considerable amount of voxels with such characteristic exists also for FA>0.2. The application of the additional condition (b) allows one to exclude a significant amount of such voxels from the analysis: see data points in quadrant IV in Figure 1C and data points in blue in Figure 1D. The voxels that finally form the D-KIT correspond to the data points shown in the quadrant II of Figure 1C. In MD vs. FA plots, the corresponding data points are shown in red, Figure 1D. Clearly, the distribution of MD values corresponding to D-KIT is narrowed and the majority of points with high MD values (>1.5 μm2/ms) are excluded. Beyond that, the D-KIT eliminates also a certain amount of voxels with relatively low MD (<1.5 μm2/ms) in case they are accompanied by low MK (<MKLHM), see the MD histogram evaluated for excluded voxels in the incept of Figure 1D. These voxels are likely to be in GM.
Figure 2:(a) D-KIT overlaid on the MD map; (b) D-KIT+excluded voxels (red) overlaid on the MD map; (c) excluded voxels (red) overlaid on the MD map; (d) excluded voxels (red) overlaid on the FA map.
The results for the 2d D-KIT are shown in Figure 2, see axial slice projections. Figure 2A exemplifies the D-KIT in yellow overlaid on the MD map. The difference mask (red) between the D-KIT and the conventional FA template (FA>0.2) is shown in Figure 2B. The difference mask thus visualises additional voxels excluded by the threshold MKLHM (condition (b)). To demonstrate localisation of these voxels, the bottom panel of Figure 2 shows the difference mask overlaid on MD (Figure 2C) and FA (Figure 2D) maps. Clearly, the majority of excluded voxels turns out to be located at the interfaces of WM and non-WM regions, i.e., at the borders with low FA and/or high MD. It is worth noting that the contours of excluded voxels tend to replicate not only the boundaries of the CSF spaces (appearing white in MD and black in FA maps) but also the boundaries between WM and GM, see zoomed areas in Figure 2A. The number of voxels eliminated by the condition (b) in the D-KIT equals 15.4% out of all voxels comprising the mask (FA>0.2) in the considered slice.
B) Three-dimensional (3D) whole brain D-KIT. The threshold values, MKLHM, were determined separately for each slice and the individual 2D-slice templates were then combined in a 3D whole-brain D-KIT. To illustrate the result we provided two additional, sagittal and coronal, projections of the D-KIT and the difference mask in Figure 2. In agreement with the above 2D results, we see that eliminated voxels clearly outline the borders of the CSF ventricles (see for example, the contour curves along the corpus callosum) and some interfaces between WM and GM. The number of additional voxels eliminated in the whole-brain mask (FA>0.2) by the condition (b) in the D-KIT equals 14.5%. The 3D D-KIT can further be applied with all evaluated DT/KT whole-brain parameter maps.
The value of MKLHM for different slices (excluding 6 outermost slices at the image top and 6 outermost slices at the image bottom) varied in the range between 0.7 and 0.86 with the average value of 0.76 ± 0.05. Certain variability of MKLHM across the brain can be explained by heterogeneity of WM microstructural properties. However, the magnitude of variability appears rather low: the coefficient of variation (CV), i.e., the standard deviation divided by the mean, was equal to 0.064.
Application of the D-KIT in atlas-based comparison of children and adults
The procedure described above was applied to construct the 3D D-KIT for anatomic WM ROIs identified by the JHU-WM atlas. The only difference in the procedure was that the determination of MKLHM was based on the histograms evaluated for individual anatomic ROIs rather than for individual slices. Scatter plots of MK vs. FA in (Figure 3A) show examples of the data points excluded from the analysis (quadrants IV) by application of the D-KIT for 3 different fibres in subject 1. The results for other fibres were similar. We see also a clear similarity between the scatter plots shown for one individual slice in (Figure 1C), i.e., a considerable amount of data points exhibiting high FA and low MK subjected to exclusion by the D-KIT.
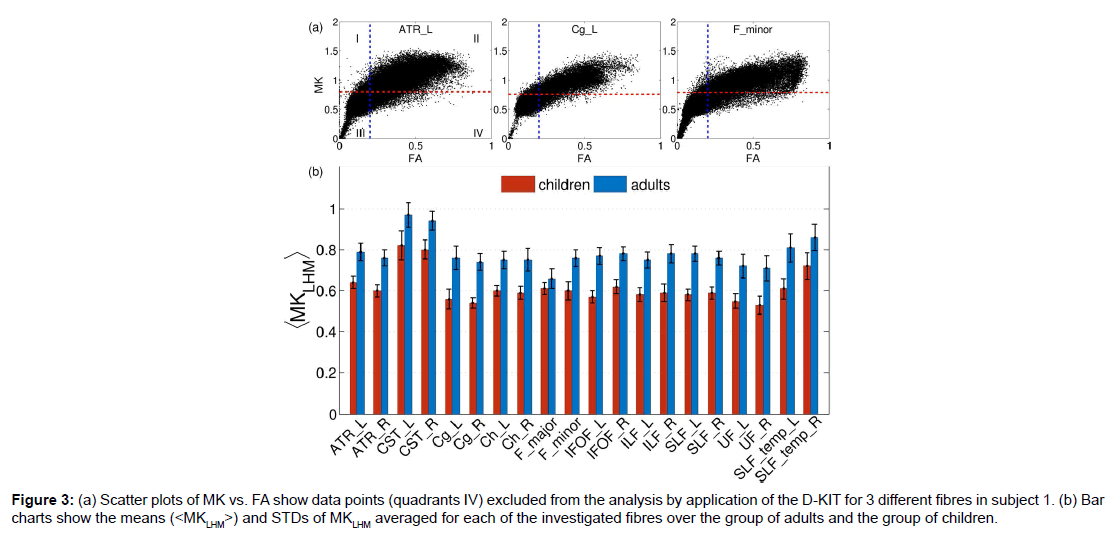
Figure 3:(a) Scatter plots of MK vs. FA show data points (quadrants IV) excluded from the analysis by application of the D-KIT for 3 different fibres in subject 1. (b) Bar charts show the means (< M KLHM>) and STDs of MKLHM averaged for each of the investigated fibres over the group of adults and the group of children.
Heterogeneity of the MKLHM values across the subjects is represented by bar charts in Figure 3B showing the means (<MKLHM>) and standard deviations (STD) of MKLHM averaged for each of the investigated fibres in the group of adults and the group of children. The mean values, (<MKLHM>), were considerably lower in children than in adults in all fibres complying with generally lower MK values in WM of children compared to adults [30]. Within the same group, the CVs across the subjects were low for most of the fibres varying in approximately the same range (from 0.042 to 0.088) with the means equal to 0.061 in adults and 0.062 in children. The values of <MKLHM> averaged over all fibres were equal to 0.78 ± 0.032 (CV=0.42) for adults and 0.61 ± 0.026 (CV=0.42) for children. Also here the CVs were low. That is, we see that, within the same group, the properties of MK histograms in the low-MK part are rather uniform both across the subjects and across the fibres.
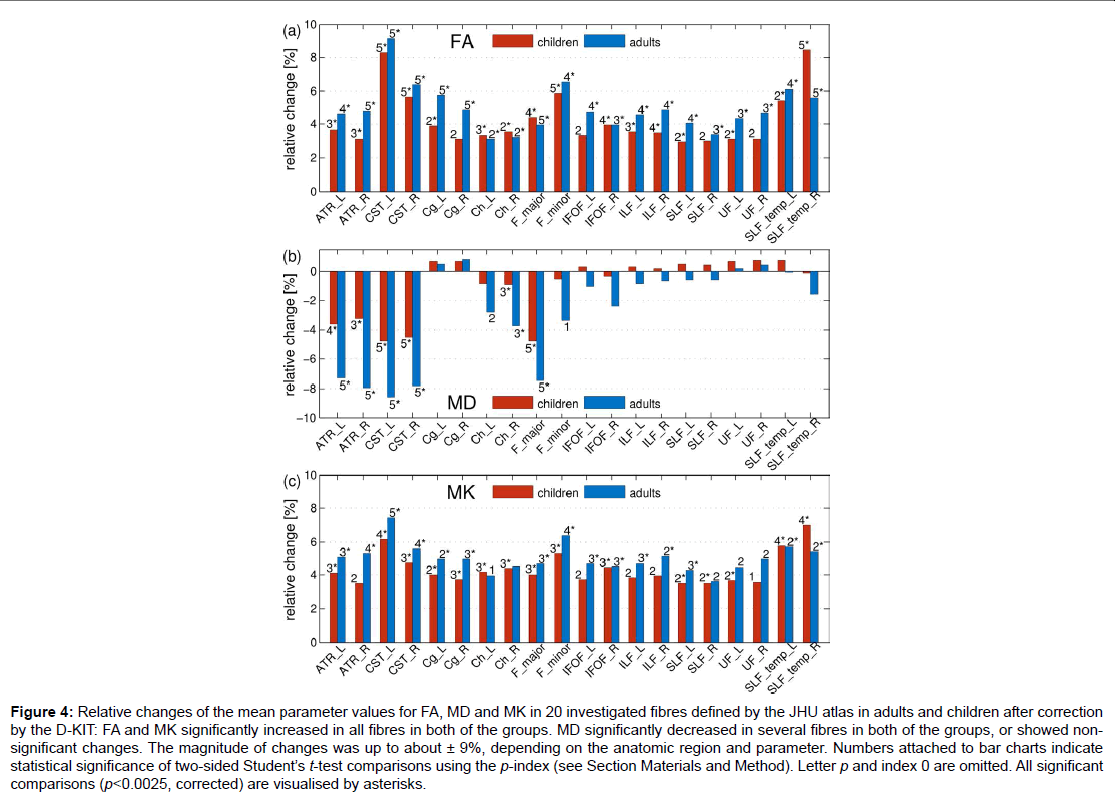
Figure 4: Relative changes of the mean parameter values for FA, MD and MK in 20 investigated fibres defined by the JHU atlas in adults and children after correction by the D-KIT: FA and MK significantly increased in all fibres in both of the groups. MD significantly decreased in several fibres in both of the groups, or showed nonsignificant changes. The magnitude of changes was up to about ± 9%, depending on the anatomic region and parameter. Numbers attached to bar charts indicate statistical significance of two-sided Student’s t-test comparisons using the p-index (see Section Materials and Method). Letter p and index 0 are omitted. All significant
comparisons (p<0.0025, corrected) are visualised by asterisks.
Figure 4 demonstrates how the mean parameter values in 20 investigated fibres, averaged over each subject group, have changed after correction with the D-KIT. In adults: a) FA has significantly (p<0.0025) increased in all fibres with relative changes between 3 to 9%, b) MD has significantly decreased in 6 fibres (range, 4-9%) or showed non-significant changes in all other fibres, b) MK has significantly increased in 15 fibres with relative changes between 4 to 7% or showed suggestively significant (0.0025<p<0.05) increases in 4 fibres and non-significant changes in one fibre. A very similar pattern was observed in children.
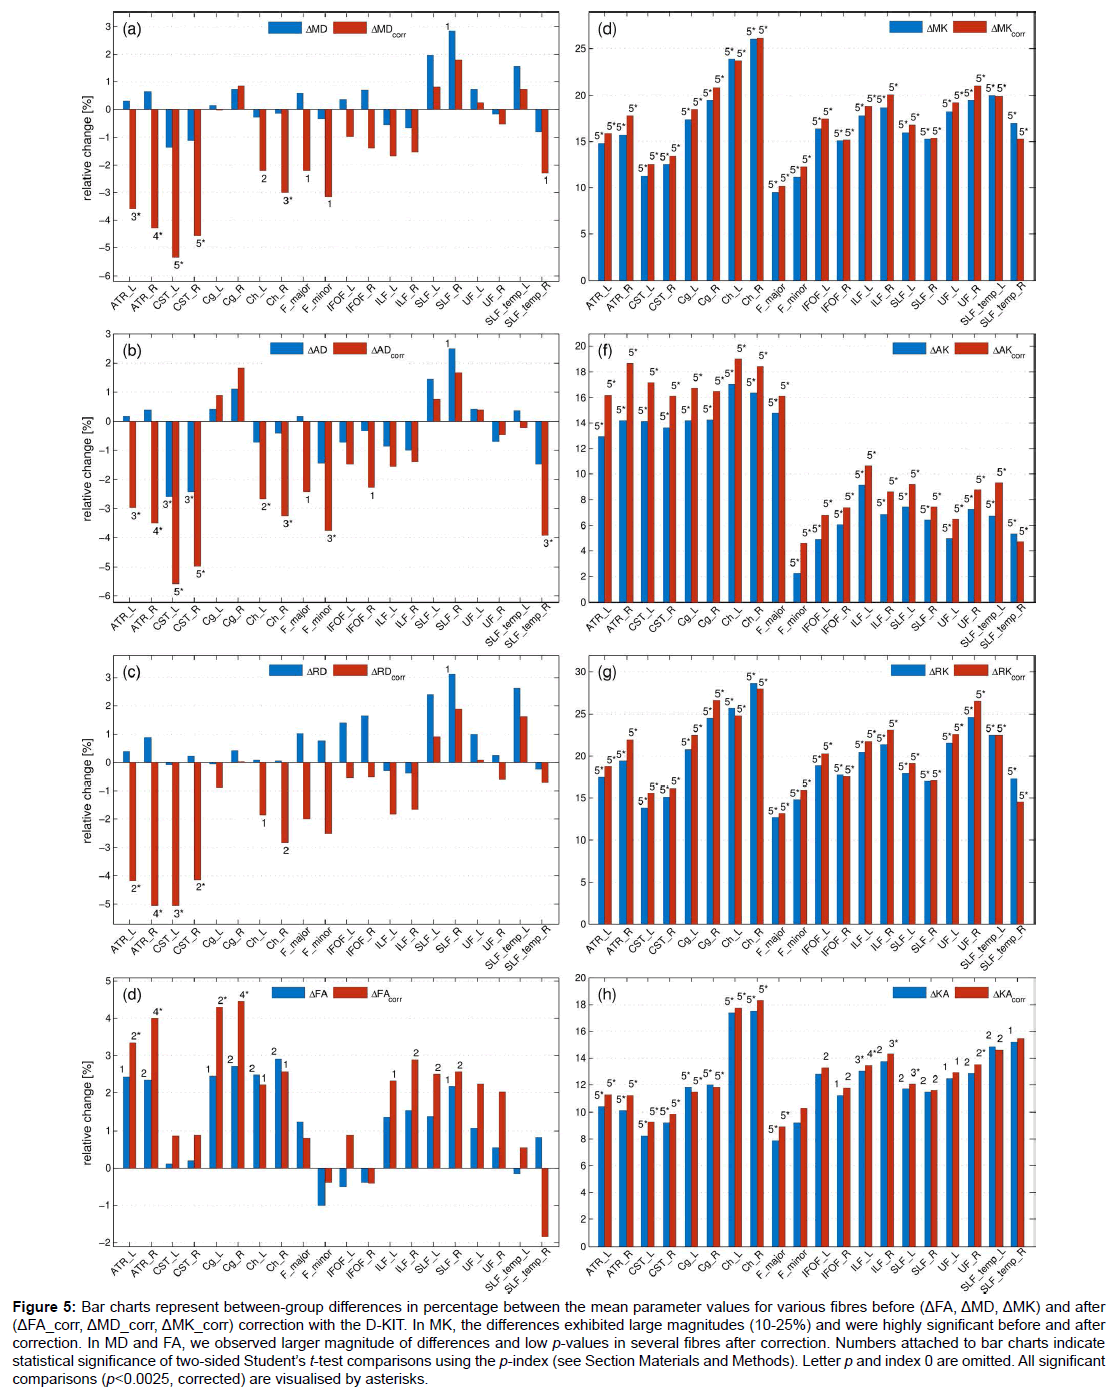
Figure 5: Bar charts represent between-group differences in percentage between the mean parameter values for various fibres before (ΔFA, ΔMD, ΔMK) and after (ΔFA_corr, ΔMD_corr, ΔMK_corr) correction with the D-KIT. In MK, the differences exhibited large magnitudes (10-25%) and were highly significant before and after correction. In MD and FA, we observed larger magnitude of differences and low p-values in several fibres after correction. Numbers attached to bar charts indicate statistical significance of two-sided Student’s t-test comparisons using the p-index (see Section Materials and Methods). Letter p and index 0 are omitted. All significant comparisons (p<0.0025, corrected) are visualised by asterisks.
Figure 5 shows the results of the t-test between-group comparisons before and after correction with the D-KIT in terms of the relative differences between the means (in percentage) and p-values. Additionally, Table 1 quantifies the effect size before and after correction in terms of absolute Cohen’s d values. The D-KIT correction has altered the observed between-group differences in the following way.
DT metrics exhibited larger magnitudes of between-group differences accompanied with decreased p-values in several fibres after the D-KIT correction. For example, before correction, MD did not show significant between-group differences in any of the fibres (except for one suggestively significant difference in SLF_R). After correction, however, five fibres (ATR_L/ATR_R, CST_L/CST_R, Ch_R) exhibited significant decreases of MD from childhood to adult age and three fibres (Ch_L, F_major, F_minor) showed suggestively significant decreases. P-values decreased as well as demonstrated by higher p-indexes. Similar patterns were observed for AD and RD. FA showed significant increases from childhood to adult range in 4 fibres (ATR_L/ATR_R, Cg_L/ Cg_R) and suggestively significant increases in 6 fibres (Ch_R/Ch_L, ILF_L/ILF_R, SLF_L/SLF_R) after correction; p-values decreased. In contrast, no significant between-group differences were observed in FA before correction, although suggestively significant differences were still observed in 7 fibres (ATR_L/ATR_R, Cg_L/Cg_R, Ch_R/Ch_L, SLF_R). Cohen’s d value, Table 1, showed a clear tendency to increase after correction in most of the fibres and in most of the parameters excluding those in which the effect size was rather low both before and after correction. In particular, especially large improvements increasing the effect size from “low” (d<0.2) to “large” (d>0.8) were observed for all diffusivity parameters of ATR and CST fibres.
| dFA | dMD | dAD | dRD | dMK | dAK | dRK | dKA | |
|---|---|---|---|---|---|---|---|---|
| ATR_L | 0.84 | 0.09 | 0.06 | 0.10 | 3.5 | 2.96 | 3.42 | 1.84 |
| 1.05 | 1.26 | 1.29 | 1.12 | 3.69 | 3.25 | 3.52 | 2.27 | |
| ATR_R | 0.88 | 0.21 | 0.14 | 0.24 | 3.95 | 2.63 | 4.27 | 2.12 |
| 1.44 | 1.51 | 1.42 | 1.44 | 4.42 | 2.91 | 4.64 | 2.74 | |
| CST_L | 0.04 | 0.53 | 1.19 | 0.03 | 3.16 | 2.40 | 2.89 | 2.03 |
| 0.24 | 2.17 | 2.76 | 1.25 | 2.92 | 2.60 | 2.54 | 2.10 | |
| CST_R | 0.08 | 0.47 | 1.17 | 0.07 | 3.20 | 2.32 | 3.04 | 2.0 |
| 0.30 | 1.88 | 2.45 | 1.10 | 3.20 | 2.51 | 2.76 | 2.18 | |
| Cg_L | 0.79 | 0.06 | 0.15 | 0.02 | 3.82 | 3.13 | 3.16 | 1.97 |
| 1.11 | 0.01 | 0.30 | 0.25 | 3.82 | 2.97 | 3.26 | 2.20 | |
| Cg_R | 0.89 | 0.22 | 0.34 | 0.11 | 4.78 | 2.84 | 4.09 | 2.0 |
| 1.47 | 0.25 | 0.54 | 0.01 | 5.27 | 2.84 | 4.37 | 2.27 | |
| Ch_L | 0.91 | 0.08 | 0.22 | 0.03 | 4.74 | 3.97 | 4.07 | 2.82 |
| 0.75 | 0.89 | 1.05 | 0.69 | 4.71 | 3.93 | 3.96 | 3.05 | |
| Ch_R | 0.98 | 0.05 | 0.14 | 0.02 | 3.63 | 3.13 | 3.51 | 2.31 |
| 0.79 | 1.17 | 1.28 | 0.96 | 3.83 | 3.30 | 3.59 | 2.58 | |
| F_major | 0.49 | 0.16 | 0.04 | 0.24 | 2.39 | 1.76 | 2.22 | 2.35 |
| 0.32 | 0.74 | 0.82 | 0.57 | 2.57 | 2.0 | 2.18 | 2.65 | |
| F_minor | 0.30 | 0.08 | 0.40 | 0.14 | 2.68 | 2.46 | 2.57 | 0.28 |
| 0.30 | 0.80 | 1.17 | 0.49 | 2.84 | 2.79 | 2.59 | 0.55 | |
| IFOF_L | 0.16 | 0.10 | 0.24 | 0.30 | 3.91 | 3.71 | 3.03 | 0.63 |
| 0.26 | 0.29 | 0.51 | 0.12 | 4.19 | 3.86 | 3.23 | 0.88 | |
| IFOF_R | 0.14 | 0.19 | 0.10 | 0.37 | 3.80 | 2.81 | 3.65 | 0.81 |
| 0.13 | 0.41 | 0.78 | 0.12 | 3.92 | 2.95 | 3.71 | 0.99 | |
| ILF_L | 0.49 | 0.15 | 0.27 | 0.07 | 4.14 | 3.59 | 3.38 | 1.32 |
| 0.79 | 0.53 | 0.52 | 0.50 | 4.42 | 3.70 | 3.60 | 1.51 | |
| ILF_R | 0.54 | 0.20 | 0.33 | 0.10 | 3.74 | 2.94 | 3.66 | 0.98 |
| 1.03 | 0.47 | 0.44 | 0.46 | 4.04 | 2.97 | 3.98 | 1.25 | |
| SLF_L | 0.48 | 0.51 | 0.45 | 0.53 | 4.31 | 3.33 | 3.72 | 1.02 |
| 0.87 | 0.23 | 0.25 | 0.21 | 4.57 | 3.45 | 3.97 | 1.25 | |
| SLF_R | 0.76 | 0.83 | 0.86 | 0.77 | 3.75 | 2.86 | 3.30 | 0.88 |
| 0.90 | 0.54 | 0.59 | 0.48 | 3.88 | 2.92 | 3.44 | 1.03 | |
| UF_L | 0.33 | 0.18 | 0.12 | 0.22 | 4.15 | 3.81 | 3.34 | 0.68 |
| 0.63 | 0.06 | 0.11 | 0.02 | 4.0 | 3.86 | 3.18 | 0.86 | |
| UF_R | 0.16 | 0.04 | 0.2 | 0.06 | 3.48 | 2.85 | 3.26 | 0.91 |
| 0.55 | 0.13 | 0.13 | 0.12 | 3.53 | 3.02 | 3.20 | 1.06 | |
| SLF_temp_L | 0.04 | 0.43 | 0.10 | 0.62 | 4.08 | 3.96 | 3.21 | 0.91 |
| 0.10 | 0.20 | 0.07 | 0.35 | 3.60 | 3.68 | 2.89 | 1.02 | |
| SLF_temp_R | 0.24 | 0.25 | 0.52 | 0.05 | 3.37 | 3.05 | 2.83 | 0.68 |
| 0.43 | 0.71 | 1.28 | 0.16 | 2.85 | 2.96 | 2.19 | 0.58 |
Table 1: Absolute Cohen’s d values for various metrics before (upper row associated with each fibre) and after (lower row associated with each fibre) the D-KIT correction. The subscript of Cohen’s d indicates the parameter for which it was evaluated, i.e., dMK is Cohen’s d for MK, dFA is Cohen’s d for FA, and so on.
KT metrics. In MK and similarly in other KT metrics, the relative differences exhibited large magnitudes (10-25%) and were highly significant (p ≤ 0.00001), whereas Cohens’d values were very large (with the majority of values as large as exceeding 2.0) already before correction; these features remained robust also after correction with striking similarity of patterns across various fibres.
Discussion and Conclusion
We developed a simple, robust D-KIT enabling us to significantly reduce PVE and demonstrated its performance in between-group comparisons of age-related differences of DT/DK metrics in atlasderived WM ROIs. Our results suggest that D-KIT corrected diffusion measures in WM regions reveal enhanced tissue specificity and enhance statistical significance (lower p-values) in between-group comparisons.
The construction of the D-KIT is based on exploiting diffusion kurtosis properties of the brain tissue, in particular, the doublepeak bell-shaped distribution of kurtosis values. Technically, it uses a dual threshold combination of the typical FA constraint with an additional constraint on MK. FA constraints are routinely used for rough segmentation of WM and non-WM [27,41,42] making use of low anisotropy of GM and fluid. In particular, FA thresholds are used to constrain streamlines to WM regions in deterministic fibre tractography [43-45]. However, more accurate tissue segmentation as well as elimination of PVE in diffusion MRI images require an application of dedicated methods.
The PVE reduction based on the D-KIT should be considered in the context of other approaches suggested in the literature. Most of efforts so far have been invested in the development of methods for CSF suppression related to DTI. Contamination by CSF represents a large source of errors in the analysis of diffusion metrics [46,47] giving rise to an overestimation of diffusivities and a reduction of FA values. The most eminent methods are represented by the DTI signal acquisition method combined with fluid attenuated inversion recovery (FLAIR) [48,49] and the free water elimination (FWE) method [50,51] accounting for mixed diffusion signal within a voxel. It was demonstrated that, in general, suppression of CSF contamination enhances the accuracy and reproducibility of DTI metrics and improves tractography results [48,49,52-54], especially in periventricular regions. The FWE correction was also applied to improve accuracy of DTI-derived metrics of limbic tracts in the study of their developmental trajectories [55].
Correcting for CSF contamination was shown to be of paramount importance for disentangling atrophy-based artefacts in ageing [54,56] and neurodegenerative pathologies, such as mild cognitive impairment [57], Huntington’s disease [52], or Alzheimer’s disease [58]. Accurate estimation of diffusion metrics can be especially important in elucidation of very early stages of Alzheimer’s disease. This is because, although traditional understanding of Alzheimer’s disease has been primarily associated with GM, the advent of DTI studies provided evidence for WM being also heavily affected (see [59] for a review). Moreover, the associated WM degeneration is now assumed to be an early pathological feature of Alzheimer’s pathogenesis occurring years or even decades before the onset of clinical symptoms [58]. Microstructural changes were found in many WM regions and individual tracts, such as UF, SLF, corpus callosum and fornix, predicting memory decline and progression from mild cognitive impairment to the Alzheimer’s disease [9,60-62]. Due to such studies, DTI is now emerging as potential tool to detect early microstructural WM changes in the Alzheimer’s disease. However, the underlying mechanisms (that can be secondary to GM pathology through Wallerian degeneration or due to processes originating directly in WM) are not yet fully clarified. Also, studies exploring correlations between DTI parameters and cognitive scores have reported some controversial results [63-66]. This might be both due to confounding factors in estimation of parameter values and since these parameters are influenced by many other non-specific biological variables. More recently, application of advanced diffusion models, such as DKI, have added new promising biomarkers sensitive to neurodegenerative WM alterations in the Alzheimer’s disease [67,68]. In this context, our simple method allowing one to reduce the influence of PVE on estimation of both DT and KT parameters can have value for developing techniques with enhanced sensitivity to detect early preclinical WM abnormalities associated with the Alzheimer’s disease.
While usefulness of the CSF correction for more faithful characterisation of anatomic and microstructural tissue properties in development and pathology is undoubted, the practicability of the suggested methods often remains impeded by the lack of robustness, introduction of additional limitations and difficulties in adaptation to clinical applications. For example, FLAIR preparation in DTI prolongs the scanning time, reduces SNR and requires cardiac gating to avoid severe motion artefacts [69]. The FWE uses the voxel-by-voxel CSF correction with the help of the two-compartment (tissue+CSF) model fitting that can be applied both with single- and multi-shell diffusion weightings [50]. The advantage of the single-shell approach is that it can be applied as a post-processing step with data acquired by standard DTI protocols, i.e., without demanding additional acquisition time. However, this method requires introduction of local spatial constraints within a regularisation procedure in order to stabilise the (otherwise illposed) fitting of the bi-tensor model. Multi-shell approaches allow one to avoid such constraints but require additional acquisition time [51].
In this context, it should be, first of all, noted that the D-KIT is developed for applications with non-Gaussian diffusion protocols, such as DKI, rather than with conventional DTI. It is applicable with any diffusion protocols that allow for evaluation of diffusion kurtosis at high b-values (>1.5 μm-2 ms). That is, it requires the same acquisition time as DKI (minimum of three b-value data points versus two in DTI) but does not introduce any additional difficulties, such as those by FLAIR. On the other hand, DKI is currently in the process of establishing itself as a routine method in clinical diffusion MRI, so that the corresponding protocols become ever more adapted to the clinical environment. Therefore, the use of the D-KIT can be expected to grow in parallel with the use of DKI and other non-Gaussian methods. Secondly, the D-KIT can be applied for post-hoc correction of already acquired DKI data. In this aspect it is analogous to FWE method that can be applied with already acquired, typically, single-shell DTI datasets. However, the D-KIT does not allow for estimations of additional voxel-based biomarkers since it works with MK distributions across the tissue. The FWE method, in contrast, allows one to map the relative free water fraction within a voxel as an additional contrast. A useful application of free water fraction mapping was demonstrated, for example, in studies of Parkinson’s disease [70-72]. Nevertheless, as a pure correction method, the D-KIT revealed itself as simple and robust in efficiently reducing PVE along the tissue borders without paying the penalty of potential errors introduced by (non-trivial) fitting and regularisation procedures. Such errors can be especially pronounced in the voxels with low SNR. With respect to FWE the D-KIT can be considered as a complimentary method that can be applied prior to FWE in order exclude strongly contaminated voxels from further analysis.
An advantageous feature of the D-KIT for WM examination is that it acts not only upon the CSF but also upon GM contamination. Moreover, it will also automatically exclude the voxels in which high anisotropy accompanied by low MK is erroneously encountered due to noise (low SNR). The results of the fitting in the voxels retained by the D-KIT are not altered in comparison to uncorrected ones. However, improved estimations are achieved by excluding contaminated (“bad”) voxels from the statistical analysis, such as in the between-group comparisons demonstrated in this work. It is worth mentioning that, via increasing the effect size of between-group differences, application of the D-KIT can also be useful for reducing the sample size requirements for a statistically powerful between-group comparisons [73]. This can be especially important in studies of rare diseases as well for the study of age-related physiological development. A huge cross sectional study in 885 individuals ranging from 3-20 years identified the changes in white matter tracts likely related to increasing myelination from the ages of 11-15 years as the strongest predictor for age [74].
The diffusion protocol applied in this work sets up relatively small isotropic voxel volume (1.93 mm3). In larger voxels of (2-3)3 mm3 more frequently used in DTI/DKI protocols, the D-KIT correction would be even more efficient since the PVEs are more pronounced in larger voxels [47]. The PVEs can generally depend also on the shape and topological properties of the WM bundles [27], such as bundle volume, orientation and curvature. Partial volume artefacts become especially critical for the estimation of diffusion metrics in neurodegenerative and ageing processes associated with tissue volume loss [56,75]. Tissue volume loss can modulate the PVE-related artefacts in diffusion analyses in a complex non-linear manner introducing confounding variables in between-group comparisons, tractography results and longitudinal studies.
Our histogram-based analysis of the low MK thresholds revealed low variability across the subjects and across the fibre bundles. This empirical finding allows one to suggest a practicable simplification of the formalised approach of MKLHM determination developed in this work. Indeed, in the same way as experiential values between 0.15 to 0.25 are used for the FA threshold, values between 0.7 and 0.8 for MKLHM can be recommended for a simplified application of the D-KIT in the whole brain of the middle-aged adults. In children [76] and eventually, in very elderly adults [4], MK values may depend on the age more strongly, therefore, more differentiated approach would be required. Alternative approaches to determine optimal low MK threshold can involve using percentile analysis of MK histograms. Previously, percentile analyses of MD histograms, for example, have been successfully employed in assessment of brain tumours [77,78]. It remains to be investigated in future work whether a similar approach based on MK histograms can also provide more sensitive biomarkers.
In conclusion, using differences of diffusion-kurtosis histograms in different tissues we developed a simple robust template-based method to reduce contamination of WM structures of interest by PVE from neighbouring GM and CSF regions. Our work shows that excluding affected voxels from statistical analyses allows one to reduce confounding effects due to PVE and improves statistical results. The performance of the developed method was demonstrated in the semi-automatic atlasbased comparison of two differently aged groups of healthy subjects. We showed that, after the D-KIT correction, the effect sizes of the between-group differences in many regional DTI/DKI metrics become larger whereas p-values of the t-tests decrease. The D-KIT is expected to be especially useful for detection of subtle between-group differences and longitudinal changes in studies of neurodegenerative pathologies and ageing associated with WM atrophy.
Acknowledgement
FG thanks Dr. Ivan I. Maximov for his contribution in post-processing of diffusion data.
References
- Basser PJ, Pierpaoli C (1996) Microstructural and physiological features of tissues elucidated by quantitative-diffusion-tensor MRI. J Magn Reson B 111: 209-219.
- Jensen JH, Helpern JA, Ramani A, Lu H, Kaczynski K (2005) Diffusional kurtosis imaging: The quantification of non-gaussian water diffusion by means of magnetic resonance imaging. Magn Reson Med 53: 1432-1440.
- Kochunov P, Williamson DE, Lancaster J, Fox P, Cornell J, et al. (2012) Fractional anisotropy of water diffusion in cerebral white matter across the lifespan. Neurobiol Aging 33: 9-20.
- Das SK, Wang JL, Bing L, Bhetuwal A, Yang HF (2016) Regional values of diffusional kurtosis estimates in the healthy brain during normal aging. Clin Neuroradiol.
- Kubicki M, McCarley R, Westin CF, Park HJ, Maier S, et al. (2007) A review of diffusion tensor imaging studies in schizophrenia. J Psychiatr Res 41: 15-30.
- Chua TC, Wen W, Slavin MJ, Sachdev PS (2008) Diffusion tensor imaging in mild cognitive impairment and Alzheimer's disease: A review. Curr Opin Neurol 21: 83-92.
- Steven AJ, Zhuo J, Melhem ER (2014) Diffusion kurtosis imaging: An emerging technique for evaluating the microstructural environment of the brain. AJR Am J Roentgenol 202: W26-33.
- Zhu J, Zhuo C, Qin W, Wang D, Ma X, et al. (2015) Performances of diffusion kurtosis imaging and diffusion tensor imaging in detecting white matter abnormality in Schizophrenia. Neuroimage Clin 7: 170-176.
- Acosta-Cabronero J, Alley S, Williams GB, Pengas G, Nestor PJ (2012) Diffusion tensor metrics as biomarkers in Alzheimer's disease. PLoS One 7: e49072.
- Acosta-Cabronero J, Nestor PJ (2014) Diffusion tensor imaging in Alzheimer's disease: Insights into the limbic-diencephalic network and methodological considerations. Front Aging Neurosci 6: 266.
- Atkinson-Clement C, Pinto S, Eusebio A, Coulon O (2017) Diffusion tensor imaging in Parkinson's disease: Review and meta-analysis. Neuroimage Clin 16: 98-110.
- Muller HP, Glauche V, Novak MJ, Nguyen-Thanh T, Unrath A, et al. (2011) Stability of white matter changes related to Huntington's disease in the presence of imaging noise: A DTI study. PLoS Curr 3: RRN1232.
- Roosendaal SD, Geurts JJ, Vrenken H, Hulst HE, Cover KS, et al. (2009) Regional DTI differences in Multiple sclerosis patients. Neuroimage 44: 1397-1403.
- Snook L, Plewes C, Beaulieu C (2007) Voxel based versus region of interest analysis in diffusion tensor imaging of neurodevelopment. Neuroimage 34: 243-252.
- Lebel C, Walker L, Leemans A, Phillips L, Beaulieu C (2008) Microstructural maturation of the human brain from childhood to adulthood. Neuroimage 40: 1044-1055.
- Lei W, Li N, Deng W, Li M, Huang C, et al. (2015) White matter alterations in first episode treatment-naive patients with deficit Schizophrenia: A combined VBM and DTI study. Sci Rep 5: 12994.
- Ambrosi E, Rossi-Espagnet MC, Kotzalidis GD, Comparelli A, Del Casale A, et al. (2013) Structural brain alterations in bipolar disorder II: A combined voxel-based morphometry (VBM) and diffusion tensor imaging (DTI) study. J Affect Disord 150: 610-615.
- Takao H, Abe O, Yamasue H, Aoki S, Kasai K, et al. (2010) Cerebral asymmetry in patients with schizophrenia: A voxel-based morphometry (VBM) and diffusion tensor imaging (DTI) study. J Magn Reson Imaging 31: 221-226.
- Smith SM, Jenkinson M, Johansen-Berg H, Rueckert D, Nichols TE, et al. (2006) Tract-based spatial statistics: Voxelwise analysis of multi-subject diffusion data. Neuroimage 31: 1487-1505.
- Tan X, Fang P, An J, Lin H, Liang Y, et al. (2016) Micro-structural white matter abnormalities in type 2 diabetic patients: A DTI study using TBSS analysis. Neuroradiology 58: 1209-1216.
- Jones DK, Symms MR, Cercignani M, Howard RJ (2005) The effect of filter size on VBM analyses of DT-MRI data. Neuroimage 26: 546-554.
- Froeling M, Pullens P, Leemans A (2016) DTI analysis methods: Region 9 of interest analysis. Springer 2016: 175-82.
- Mori S, Oishi K, Jiang H, Jiang L, Li X, et al. (2008) Stereotaxic white matter atlas based on diffusion tensor imaging in an ICBM template. Neuroimage 40: 570-582.
- Wakana S, Caprihan A, Panzenboeck MM, Fallon JH, Perry M, et al. (2007) Reproducibility of quantitative tractography methods applied to cerebral white matter. Neuroimage 36: 630-644.
- Wakana S, Jiang H, Nagae-Poetscher LM, van Zijl PC, Mori S (2004) Fiber tract-based atlas of human white matter anatomy. Radiology 230: 77-87.
- Hua K, Zhang J, Wakana S, Jiang H, Li X, et al. (2008) Tract probability maps in stereotaxic spaces: Analyses of white matter anatomy and tract-specific quantification. Neuroimage 39: 336-347.
- Vos SB, Jones DK, Viergever MA, Leemans A (2011) Partial volume effect as a hidden covariate in DTI analyses. Neuroimage 55: 1566-1576.
- Jeon T, Mishra V, Uh J, Weiner M, Hatanpaa KJ, et al. (2012) Regional changes of cortical mean diffusivities with aging after correction of partial volume effects. Neuroimage 62: 1705-1716.
- Koo BB, Hua N, Choi CH, Ronen I, Lee JM, et al. (2009) A framework to analyze partial volume effect on gray matter mean diffusivity measurements. Neuroimage 44: 136-144.
- Grinberg F, Maximov II, Farrher E, Neuner I, Amort L, et al. (2016) Diffusion kurtosis metrics as biomarkers of microstructural development: A comparative study of a group of children and a group of adults. Neuroimage 144: 12-22.
- Jensen JH, Helpern JA (2010) MRI quantification of non-Gaussian water diffusion by kurtosis analysis. NMR Biomed 23: 698-710.
- Poot DH, den Dekker AJ, Achten E, Verhoye M, Sijbers J (2010) Optimal experimental design for diffusion kurtosis imaging. IEEE Trans Med Imaging 29: 819-829.
- Johansen-Berg H, Behrens TE, Robson MD, Drobnjak I, Rushworth MF, et al. (2004) Changes in connectivity profiles define functionally distinct regions in human medial frontal cortex. Proc Natl Acad Sci U S A 101: 13335-13340.
- McGibney G, Smith MR (1993) An unbiased signal-to-noise ratio measure for magnetic resonance images. Med Phys 20: 1077-1078.
- Miller AJ, Joseph PM (1993) The use of power images to perform quantitative analysis on low SNR MR images. Magn Reson Imaging 11: 1051-1056.
- Andre ED, Grinberg F, Farrher E, Maximov, II, Shah NJ, et al. (2014) Influence of noise correction on intra- and inter-subject variability of quantitative metrics in diffusion kurtosis imaging. PLoS One 9: e94531.
- Leemans A, Jeurissen B, Sijbers J, Jones DK (2009) Explore DTI: A graphical toolbox for processing, analyzing and visualizing diffusion MR data. In Proc Intl Soc Mag Reson Med.
- Cohen J (1988) Statistical power analysis for the behavioral sciences. Lawrence Erlbaum AssociatesL: Hillsdale NJ.
- Grinberg F, Maximov, II, Farrher E, Neuner I, Amort L, et al. (2017) Diffusion kurtosis metrics as biomarkers of microstructural development: A comparative study of a group of children and a group of adults. Neuroimage 144: 12-22.
- Grinberg F, Farrher E, Kaffanke J, Oros-Peusquens AM, Shah NJ (2011) Non-Gaussian diffusion in human brain tissue at high b-factors as examined by a combined diffusion kurtosis and biexponential diffusion tensor analysis. Neuroimage 57: 1087-1102.
- Liu Z, Zhu H, Marks BL, Katz LM, Goodlett CB, et al. (2009) Voxel-wise group analysis of DTI. Proc IEEE Int Symp Biomed Imaging 2009: 807-810.
- Mukherjee P, Chung SW, Berman JI, Hess CP, Henry RG (2008) Diffusion tensor MR imaging and fiber tractography: Technical considerations. AJNR Am J Neuroradiol 29: 843-852.
- Domin M, Langner S, Hosten N, Lotze M (2014) Comparison of parameter threshold combinations for diffusion tensor tractography in chronic stroke patients and healthy subjects. PLoS One 9: e98211.
- Taoka T, Morikawa M, Akashi T, Miyasaka T, Nakagawa H, et al. (2009) Fractional anisotropy--threshold dependence in tract-based diffusion tensor analysis: Evaluation of the uncinate fasciculus in Alzheimer disease. AJNR Am J Neuroradiol 30: 1700-1703.
- Hagler DJ, Ahmadi ME, Kuperman J, Holland D, McDonald CR, et al. (2009) Automated white-matter tractography using a probabilistic diffusion tensor atlas: Application to temporal lobe Epilepsy. Hum Brain Mapp 30: 1535-1547.
- Salminen LE, Conturo TE, Bolzenius JD, Cabeen RP, Akbudak E, et al. (2016) Reducing csf partial volume effects to enhance diffusion tensor imaging metrics of brain microstructure. Technol Innov 18: 5-20.
- Alexander AL, Hasan KM, Lazar M, Tsuruda JS, Parker DL (2001) Analysis of partial volume effects in diffusion-tensor MRI. Magn Reson Med 45: 770-780.
- Chou MC, Lin YR, Huang TY, Wang CY, Chung HW, et al. (2005) FLAIR diffusion-tensor MR tractography: Comparison of fiber tracking with conventional imaging. AJNR Am J Neuroradiol 26: 591-597.
- Papadakis NG, Martin KM, Mustafa MH, Wilkinson ID, Griffiths PD, et al. (2002) Study of the effect of CSF suppression on white matter diffusion anisotropy mapping of healthy human brain. Magn Reson Med 48: 394-398.
- Pasternak O, Sochen N, Gur Y, Intrator N, Assaf Y (2009) Free water elimination and mapping from diffusion MRI. Magn Reson Med 62: 717-730.
- Hoy AR, Koay CG, Kecskemeti SR, Alexander AL (2014) Optimization of a free water elimination two-compartment model for diffusion tensor imaging. Neuroimage 103: 323-333.
- Steventon JJ, Trueman RC, Rosser AE, Jones DK (2016) Robust MR-based approaches to quantifying white matter structure and structure/function alterations in Huntington's disease. J Neurosci Methods 265: 2-12.
- Hoy AR, Kecskemeti SR, Alexander AL (2015) Free water elimination diffusion tractography: A comparison with conventional and fluid-attenuated inversion recovery, diffusion tensor imaging acquisitions. J Magn Reson Imaging 42: 1572-1581.
- Albi A, Pasternak O, Minati L, Marizzoni M, Bartres-Faz D, et al. (2017) Free water elimination improves test-retest reproducibility of diffusion tensor imaging indices in the brain: A longitudinal multisite study of healthy elderly subjects. Hum Brain Mapp 38: 12-26.
- Yu Q, Peng Y, Mishra V, Ouyang A, Li H, et al. (2014) Microstructure, length and connection of limbic tracts in normal human brain development. Front Aging Neurosci 6: 228.
- Metzler-Baddeley C, O'Sullivan MJ, Bells S, Pasternak O, Jones DK (2012) How and how not to correct for CSF-contamination in diffusion MRI. Neuroimage 59: 1394-1403.
- Berlot R, Metzler-Baddeley C, Jones DK, O'Sullivan MJ (2014) CSF contamination contributes to apparent microstructural alterations in mild Cognitive impairment. Neuroimage 92: 27-35.
- Hoy AR, Ly M, Carlsson CM, Okonkwo OC, Zetterberg H, et al. (2017) Microstructural white matter alterations in preclinical Alzheimer's disease detected using free water elimination diffusion tensor imaging. PLoS One 12: e0173982.
- Amlien IK, Fjell AM (2014) Diffusion tensor imaging of white matter degeneration in Alzheimer's disease and mild Cognitive impairment. Neuroscience 276: 206-215.
- Reas ET, Hagler DJ, White NS, Kuperman JM, Bartsch H, et al. (2017) Sensitivity of restriction spectrum imaging to memory and neuropathology in Alzheimer's disease. Alzheimers Res Ther 9: 55.
- Kitamura S, Kiuchi K, Taoka T, Hashimoto K, Ueda S, et al. (2013) Longitudinal white matter changes in Alzheimer's disease: A tractography-based analysis study. Brain Res 1515: 12-18.
- Sexton CE, Kalu UG, Filippini N, Mackay CE, Ebmeier KP (2011) A meta-analysis of diffusion tensor imaging in mild cognitive impairment and Alzheimer's disease. Neurobiol Aging 32: 2322 e5-18.
- Bozzali M, Falini A, Franceschi M, Cercignani M, Zuffi M, et al. (2002) White matter damage in Alzheimer's disease assessed in vivo using diffusion tensor magnetic resonance imaging. J Neurol Neurosurg Psychiatry 72: 742-746.
- Ibrahim I, Horacek J, Bartos A, Hajek M, Ripova D, et al. (2009) Combination of voxel based morphometry and diffusion tensor imaging in patients with Alzheimer's disease. Neuro Endocrinol Lett 30: 39-45.
- Morikawa M, Kiuchi K, Taoka T, Nagauchi K, Kichikawa K, et al. (2010) Uncinate fasciculus-correlated cognition in Alzheimer's disease: A diffusion tensor imaging study by tractography. Psychogeriatrics 10: 15-20.
- Stahl R, Dietrich O, Teipel SJ, Hampel H, Reiser MF, et al. (2007) White matter damage in Alzheimer disease and mild Cognitive impairment: Assessment with diffusion-tensor MR imaging and parallel imaging techniques. Radiology 243: 483-492.
- Fieremans E, Benitez A, Jensen JH, Falangola MF, Tabesh A, et al. (2013) Novel white matter tract integrity metrics sensitive to Alzheimer disease progression. AJNR Am J Neuroradiol 34: 2105-2112.
- Gong NJ, Wong CS, Chan CC, Leung LM, Chu YC (2013) Correlations between microstructural alterations and severity of cognitive deficiency in Alzheimer's disease and mild cognitive impairment: A diffusional kurtosis imaging study. Magn Reson Imaging 31: 688-694.
- Krupa K, Bekiesinska-Figatowska M (2015) Artifacts in magnetic resonance imaging. Pol J Radiol 80: 93-106.
- Ofori E, Pasternak O, Planetta PJ, Burciu R, Snyder A, et al. (2015) Increased free water in the substantia nigra of Parkinson's disease: A single-site and multi-site study. Neurobiol Aging 36: 1097-1104.
- Ofori E, Pasternak O, Planetta PJ, Li H, Burciu RG, et al. (2015) Longitudinal changes in free-water within the substantia nigra of Parkinson's disease. Brain 138: 2322-2331.
- Planetta PJ, Ofori E, Pasternak O, Burciu RG, Shukla P, et al. (2016) Free-water imaging in Parkinson's disease and atypical Parkinsonism. Brain 139: 495-508.
- Ellis PD (2010) The essential guide to effect sizes: Statistical power, meta-analysis and the interpretation of research results. Cambridge University Press, New York.
- Brown TT (2017) Individual differences in human brain development. Wiley Interdiscip Rev Cogn Sci 8: e1389.
- Gunning-Dixon FM, Brickman AM, Cheng JC, Alexopoulos GS (2009) Aging of cerebral white matter: A review of MRI findings. Int J Geriatr Psychiatry 24: 109-117.
- Paydar A, Fieremans E, Nwankwo JI, Lazar M, Sheth HD, et al. (2014) Diffusional kurtosis imaging of the developing brain. AJNR Am J Neuroradiol 35: 808-814.
- Choi YS, Ahn SS, Kim DW, Chang JH, Kang SG, et al. (2016) Incremental prognostic value of ADC histogram analysis over MGMT promoter methylation status in patients with glioblastoma. Radiology 281: 175-184.
- Kang Y, Choi SH, Kim YJ, Kim KG, Sohn CH, et al. (2011) Gliomas: Histogram analysis of apparent diffusion coefficient maps with standard- or high-b-value diffusion-weighted MR imaging--correlation with tumor grade. Radiology 261: 882-890.
Citation: Grinberg F, Farrher E, Gao X, Konrad K, Neuner I, et al. (2017) Novel Diffusion-Kurtosis-Informed Template Reduces Distortions due to Partial Volume Effects and Improves Statistical between-Group Comparisons. J Alzheimers Dis Parkinsonism 7: 393. DOI: 10.4172/2161-0460.1000393
Copyright: © 2017 Grinberg F, et al. This is an open-access article distributed under the terms of the Creative Commons Attribution License, which permits unrestricted use, distribution, and reproduction in any medium, provided the original author and source are credited.
Select your language of interest to view the total content in your interested language
Share This Article
Recommended Journals
Open Access Journals
Article Tools
Article Usage
- Total views: 6337
- [From(publication date): 0-2017 - Dec 10, 2025]
- Breakdown by view type
- HTML page views: 5361
- PDF downloads: 976