On Determination of the Optimum Tilt of Solar Installations
Received: 06-Feb-2019 / Accepted Date: 20-Feb-2019 / Published Date: 26-Feb-2019
Abstract
The work deals with the method of determining the optimum tilt of a solar station in the absence or insufficiency of solar radiation meteorological data. The criterion of optimum tilt is maximum energy capture by solar energy station in a certain period of the year. The time change of solar radiation is determined by empirical formulas. The whole chain of working formulas is presented. Calculations were made for the territory of the Parkent region (Uzbekistan) and the southern orientation of the solar station. The optimum tilt angels of SI for this region are determined. It is shown that when the angle of inclination of the SI changes by ± 10 degrees from the optimum position, its day insolation changes no more than 3%. A comparative analysis of the effectiveness of SI with a tracking system and without it was performed. In this case effectiveness increase of SI is 15%-35% (wintersummer).
Keywords: Solar radiation; Direct radiation; Diffuse radiation; Reflected radiation; Weather station; Sunshine; Conversion factor; Solar constant; Total energy; Insolation; Efficiency; Orientation; Optimum tilt; Declination; Latitude; Azimuth; Altitude; Zenith; Albedo coefficient; Coefficient of turbidity
Introduction
The most important characteristic of a Solar Installation (SI) is the energy efficiency, i.e. capacity of installation to catch the maximum possible energy in a certain period of time. For this, the SI must be oriented in a certain way along the sides of the light and inclined relative to the horizon. Usually, for the captured energy Qτ of SI the daily, monthly and yearly periods of time is taken into consideration.
To correctly determine Qτ, data on changes in Solar Radiation (SR) are required for each day. An important source of information for solar radiation is weather stations. Unfortunately, while the number of meteorological stations on Earth is quite limited, and at the same time, as some researchers indicate, the data of meteorological stations are valid within 30-50 km. To determine the optimum tilt of the SI for a particular area, the data of long-term SR measurements are usually used [1,2]. The use of averaged long-term solar radiation data is an important point in the calculations. In practice, consider a period of 20 or more years. Such calculations are performed for many cities in the world [3].
Determination of the optimal angle of inclination of SI based on meteorological data is a rather laborious task. In addition, for many localities there are actually no archived meteorological data on the incoming solar radiation. And, therefore, in the absence or lack of meteorological data, it is necessary to resort to model calculations of solar radiation. In this case, usually all days are considered cloudless (clear sky model).
The use of such models has been considered in many publications, for example [4-6]. It is important to note that the determination of the effectiveness of the SI using clear sky model in the considered cases becomes possible, and the amount of computational work is greatly reduced. In addition, the requirements for the accuracy of determining the optimal tilt angle of SI are not high and therefore the accuracy of the results will be satisfactory.
In this paper, we consider in detail the method for determining the optimum tilt of the SI precisely for this case and this approach is applied to the meteorological conditions of Parkent region (Uzbekistan).
There are 6 modern weather stations in Uzbekistan and one of them is located in Parkent region [7]. Note that the double mirror megawatt Large Solar Furnace (LSF) is also located in this region [8]. We consider a calculation model for determining the energy efficiency of SI, in which the following assumptions are considered:
1. No overcast days (clear sky model).
Such model is acceptable only for certain climatic zones, i.e. where there are few cloudy days (application condition).
2. The components of solar radiation falling on SI are determined by calculation on the basis of well-established empirical formulas. A criterion for empirical formula is the best description of meteorological data.
3. For each month, one empirical formula of total solar radiation is used. At that, for each day the corresponding solar declination and the solar constant are used. This assumption can significantly reduce the amount of computational work.
According to [9], the duration of sunshine in the north of Uzbekistan is an average of 2800 h/year. To the south, the values increase, and in the far south (Termez city) the duration of sunshine reaches 3050 h/year (70% of the daytime). Cloudy days without sunshine in Uzbekistan are rare. In the northern and mountainous regions, their number reaches 45-50 per year, decreasing in the extreme south to 25. The greatest number of such days is in December-January: from 10 to 25 (in the sum of two months), from June to September inclusive, from 1 to 4 days without sunshine, an average of 10 years. Note that, according to the definition of the World Meteorological Organization (WMO), the threshold value of direct solar radiation for calculating the sunshine time is 120 watt/m2 [10].
Thus, due to few cloudy days, it seems that the assumption of cloudless days in solving this problem, at least for Uzbekistan is correct (1 assumption). Consider the second assumption. First we give the known relations that are necessary in the calculations.
Methodology
We introduce the Cartesian coordinate system with the axes directions: X-to zenith, Y-to the west, Z-to the south and designations, as shown in Figure 1. Let the orientation of the receiver be given by the angles ar and hr (hr= 90°-β, β is the tilt angle).

Figure 1: The coordinate system and notation.
In this coordinate system, the coordinates of the unit vectors of the Sun  and SI ( receiver)
  are determined from the following formulas:
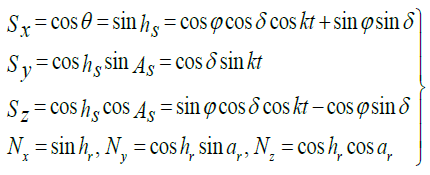 (1)
(1)
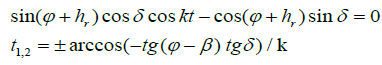
The time of sunrise and sunset (duration of light day τ= t2-t1) is determined from the expression (Sx=0)

Where δ - declination of the Sun, k = 15 deg./h, ϕ - geographical latitude, t - time.
The angle θsn between the vectors  and
and is determined from expression

and taking into account expressions (1), we have
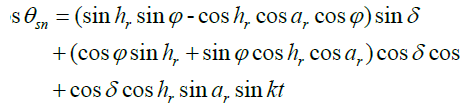 (3)
(3)
For the southern orientation of the receiver (ar= 0), this expression takes the form
 (4)
(4)
Note that for θsn> 90°, the Sun passes beyond the plane of the receiver. Then
 (5)
(5)
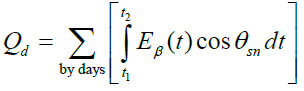
The energy received by the receiver during the day Qτ (insolation) is determined from expression
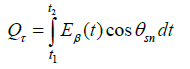
where the complex function  describes the change in the total solar radiation during the day, and for the integration boundary, the smaller of the two time intervals is taken which is determined from formulas (2) and (5). The maximum energy is achieved when
  , i.e. SI with a tracking system for the Sun. For a certain period of the year.
 (6)
(6)
If we assume that the solar radiation is constant (which is unacceptable), and  equating the derivative of the total daylight insolation with hr (to determine the maximum), we obtain the following
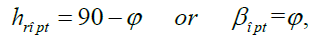 (7)
(7)
Thus, in this case, the optimal angle of inclination of the solar installation is equal to the geographical latitude of the terrain. Due to the fact that in practice this value of the angle (φ) does not always provide the maximum of the captured energy, a number of authors, depending on the season, offer an expression as  where a and b are some numbers (a = 0.9 ÷ 1.1). For example, for winter,
 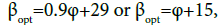 for spring
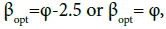 for summer
If the average angle between the equinox and the summer solstice is taken as the optimal angle for summer, then  Similarly, for winter (the average angle between the equinox and the winter solstice)
  Also note that in the Internet resources there are sites for online determination of the angle
  .
.
There are enough publications on this issue, for example, [11-14].
Analysis of the values of βopt from the data presented shows that they differ significantly from each other. The correct optimal angle is determined on the basis of numerical calculations, by the maximum of the function (6). Analysis of the literature shows that small deviations up to 5 degrees from the optimal angle have a negligible effect on the installation's performance, and the difference in weather conditions has a greater effect on the performance of the installation. At the same time, the use of a seasonal optimal angle makes it possible to increase the installation efficiency by up to 20 percent.
Let us now consider the question of the dependence of solar radiation on time. The total solar radiation is the sum of three components: direct radiation, diffuse radiation and reflected radiation. The total solar radiation entering the inclined surface is determined by the formula
 (8)
(8)
If we denote the direct normal radiation through  then the radiation on the inclined receiver
  at the angle of incidence of the rays θsn is expressed by the formula
  and the direct horizontal radiation is expressed by the formula
 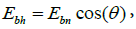 then
then
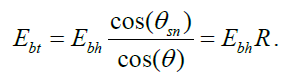
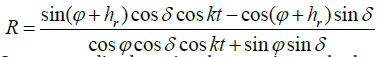
The quantity R is called the coefficient of conversion of direct radiation from horizontal to an inclined surface. On the basis of the above relations we have
In many studies, knowing the experimental values of  (according to meteorological stations data), the radiation in the inclined SI is calculated according to formula (9).
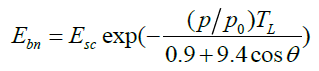
During the passage of solar radiation through the earth's atmosphere, it is absorbed, diffused and reflected. Ozone, water vapor, cloud, aerosols, air molecules, etc. can absorb radiation. The presence of these substances in the atmosphere is called atmospheric turbidity. Reduction of direct solar radiation is described by an exponential function. The most common empirical formula for this function, which we used in the calculations, has the form [15,16].
 (10)
(10)
where Esc is the solar constant, TL is the turbidity factor of the atmosphere (Linke coefficient). Expressions for the declination of the Sun (Spencer's formula, accuracy 2.5%) and the solar constant Esc, depending on the ordinal number of the day, are presented in the book [17]; p/p0 is the pressure correction coefficient, the value of which is often close to 1.
The maximum value of TL for industrial zones can reach 5.8. For high-altitude areas, the change interval is 0,5÷2,3, and for rural areas 2÷3,5 during the year.
To determine the parameters of this empirical formula, we visually chose a clear cloudless day from the Parkent meteorological station (MS4-12-01) [3] and for it the distribution of a solar radiation was calculated by the formula (7). Figure 2 shows the results of numerical calculations for various values of TL and weather station data curve (meteo). It is seen that at TL = 2.9 there is a good match in a large area. Such calculations were also carried out for other months. Analysis of these calculations shows that the second assumption is also correct, most likely with good accuracy.

Figure 2: Daily distributions of solar radiation.
There are many methods and empirical formulas to calculate diffusive solar radiation. For engineering calculations, the classical Berlage formula with coefficients 1/2 or 1/3 is used, and more accurate empirical formulas are used by Makhotkin, Kastrov, Sivkov, and others [18].
Celestial diffuse radiation Eds can be calculated by the formula [19]
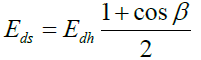 (11)
(11)
where Edh is the horizontal diffuse radiation, which is determined by the formula
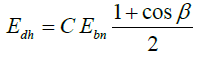 (12)
(12)
Here C is the diffuse radiation factor. The values of this parameter for the months of the year are as follows (0.058; 0.060; 0.071; 0.097; 0.121; 0.134; 0.136; 0.122; 0.092; .073; 0.063; 0.057).
The diffuse radiation reflected from the Earth is calculated from the formula
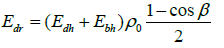 (13)
(13)
where ρ0 is the reflection coefficient (albedo) of the Earth's surface. According to [18,19] and Internet resources, the albedo of typical horizontal surfaces is as follows: fresh snow -0.85; Green lawn - 0.26; City - 0.1; Sand, dry, brown - 0.19; dried grass - 0.16-0.19, etc.
Now for the total solar radiation Eβ entering the inclined surface, we can write the formula
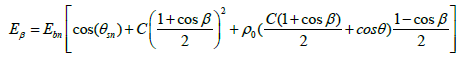 (14)
(14)
Now we estimate the third assumption. In the climatic conditions of the Uzbekistan, the direct radiation significantly dominates of other components. According to the Parkent meteorological station, 4 cloudless days were chosen in 1 month. The daily distribution of direct solar radiation for these dates is presented on Figure 3a. Figure 3b presents the same data, but normalized to its maximums. It can be seen from these graphs that the structures of these radiation distributions are close to each other for these dates. Thus the third assumption is also correct.

Figure 3a: The normalized daily distribution of direct solar radiation.

Figure 3b: The daily distribution of direct solar radiation.
Thus, it appears that the results obtained by such assumptions will, in our opinion, be correct. Detailed substantiation of such statements with appropriate mathematical criteria, which will require processing a large amount of data, will be performed in further studies.
Results and Discussion
The parameters of the above empirical formulas for the best description of meteorological data are determined. The calculations were made for geographic latitude of 41.32° and a longitude of 69.74° (Parkent region, 45 km from Tashkent (capital of Uzbekistan), 1081 m above sea level). First of all, we note that if we use the optimal angle of the selected date for the other days of the month of this date, in summer the insolation of the SI will not change, and in winter the change will not exceed 5%. Apparently, this is due to the fact that during the month (in summer), the decline in the Sun will change insignificantly (1,6°- 2,5°). In winter, the difference reaches 7°. Therefore, in order to limit the amount of calculations, computations were made for the characteristic declensions of the Sun and at the same time one empirical formula is used for each month. This formula corresponds to some clear day of the month in question. For example, for the date 18.06.2013, the climatic parameters of the empirical formulas are as follows: TL=3.2; ρ0=0.20 (dried grass, sand, dry, brown), C = 0.134 (June).
Calculations have been carried out for the determination of Qd of SI for different dates (declination of the Sun, δ). In Figure 4 graphs of the dependence of insolation of SI on its inclination angle for various characteristic declensions of the Sun are presented. From this graph, the optimum tilt for specific dates is determined. According to this graph, it is possible to trace the change in the value of the energy captured by the SI, depending on its angle of tilt.

Figure 4: A dependence of SI efficiency on its tilt angle.
Analysis of this graph shows that when the Sun is declining close to zero, the values of the geographical latitude of the terrain can be taken into the quality of the optimal angle. When the declination of the Sun is close to -12°, to the geographical latitude of the terrain, it is necessary to add ≈15°, and when the declination is close to -23°, it is necessary to add ≈ 25°. In the case when the declination of the Sun is close to 23°, the orientation of the SI should be almost horizontal (βopt ≈ 5°). Thus, the above-mentioned rules of the type βopt= aφ ± b for determining the optimal tilt angle of the SI has, to put it mildly, a recommendation character. The reason for the wide distribution of this rule is most likely related, as can be seen from the above graph, due to the weak effect of changing the angle of inclination of the SI on its productivity. In all curves, when the angle of inclination of the SI changes by ± 10 degrees from the optimum position, the daylight insolation (Qd) of the installation does not change more than 3%. Note that if the change in the angle of inclination does not occur from the optimal position of the SI, then the figure given will be larger. For example, for August of the month, if the orientation of the SI is changed, for example, from β=50° to ± 10°, the insolation of the SI will change by 9.5% and 7%, respectively. Also note that in winter, insolation of SI is almost 2 times less than in summer.
Obviously, to maximize the diffuse energy of the Sun, the surface of the SI must be oriented as much as possible horizontally, and for the energy reflected from the Earth more vertical, and finally, for direct solar radiation, perpendicular to the incident rays of the Sun.
Therefore, information about the relationship between the components of solar radiation is important for each terrain. Often the diffuse component of solar radiation is of the order of 10% of the total solar radiation. As noted in [14], for the Earth's territories close to the equator (-30° S latitude 30° N), the main component of the SR is, as a rule, direct radiation. In the work, the radiation-climatic conditions characteristic for Russia (for example, the predominance of diffuse radiation in most regions of Russia) are noted and a calculation method for determining the optimal inclined angle of the SI is given. Thus, the radiation and climatic conditions of the terrain play an important role in the solution of such problems.
Let's consider the question of how much better the energy efficiency of the SI in the presence of a system for tracking the Sun. The tracking system ensures the orientation of the SI on the Sun in such a way that the direct rays all the time fall perpendicularly to the surface of the SI. In this case, insolation will be maximum. The calculations show that the SI with the tracking system is approximately 15%-35% (wintersummer) more efficient than the fixed SI with the optimum tilt.
It should be noted that numerical calculations for the optimization of a function similar to (6) were also performed in [20], but based on 20 year weather data. This calculations carried out in this paper were performed for the Binghamton area, New York, USA with geographical latitude of 42°5'55". It can be noted that the difference in the geographical latitudes of Parkent region (41°20') and Binghamton is approximately 46', i.e. they are very close. Figure 5 presents a graph for determining the optimal SI angle for various intervals, days, months, seasons, and year, taken from [20].

Figure 5: Dependence of SI efficiency on its tilt angle.
Of course, to expect a very good similarity of the calculated data for these two areas is not correct due to the differences of many other factors, but a certain generality of the obtained results can be expected. Indeed, a comparative analysis of these data shows that, for example, a similar values of the characteristic optimal angles of the SI for these areas.
Conclusion
Thus, in the absence or lack of meteorological data, the use of given model calculations allows to determinate with good accuracy any parameters of solar energy resources, in our case, the optimal tilt angle of the SI. As the requirements for the accuracy of determining the optimal tilt angle of the SI are not high, and therefore the results will be correct. At the same time, the amount of calculations is significantly reduced.
Such calculations were carried out for the Parkent region (Uzbekistan). It can be noted that around the maximum point in the range of ± 5°, the value of the function (Q) does not noticeably change. For the given territory, the optimum tilt of the SI is 5° (June), 20° (April, August), 40° (March, September), 55° (February, October), 65° (December). Seasonal and annual optimal angles of SI can be determined by the proposed method.
A comparative analysis of the obtained results for the Parkent region with such data for the Binghamton, New York, USA shows that, for example, the values of the optimal tilt angles of SI for these regions are close to each other.
References
- Reno MJ, Hansen CW, Stein JS (2012) Global horizontal irradiance clear sky models: implementation and analysis. Sandia National Laboratories.
- Jamil B, Khan MM (2014) Estimation of clear-sky solar radiation using ASHRAE model for Aligarh, India. Int J Eng Res Technol 7: 227-236.
- Al-Jumaily KJ, Al-Zuhairi MF, Mahdi ZS (2012) Estimation of clear sky hourly global solar radiation in Iraq. Int J Energ Environ 3: 659-666.
- Rakhimov EY, Sadullaeva SE, Kolomiets YG, Tashmatov XK (2017) Analysis of the solar potential of the Republic of Uzbekistan. Appl Solar Energy 53: 344-346.
- Kiseleva SV, Yu KG, Popel OS (2015) Assessment of solar energy resources in Central Asia. Appl Solar Energy 51: 214-218.
- Jain D, Lalwani M (2017) A review on optimal inclination angels for solar arrays. Int J Renew Energy Res 7: 1053-1061.
- Lutpullaev S, Fayziev SH, Sobirov Y, Gulomova N, Norbert G (2015) On the measurement of solar resources in Uzbekistan. 2: 30-33.
- Yu AR, Paizullakhanov MS (2018) Characteristic features of the energy modes of a large solar furnace with a capacity of 1000 kW. Appl Solar Energy. 54: 99-109.
- Chub BE (2007) Climate change and its impact on hydro meteorological processes, agroclimatic and water resources of the Republic of Uzbekistan.
- Guide to Meteorological Instruments and Methods of Observation (2008) WMO-No. 8. Seventh edition. World Meteorological Organization.
- Liu FJ, Chang TP (2015) Optimizing the tilt angle of solar collector under clear sky by particle swarm optimization method. J Appl Sci Eng 18:167-172.
- Khorasanizadeh H, Aghaei A (2014) Attaining optimum tilts of flat solar surfaces utilizing measured solar data: case study for Ilam, Iran. Iranica J Energy Environ 5: 224-232.
- Handoyo EA, Ichsani D, Prabowo (2012) The optimal tilt angle of a solar collector. International Energy Procedia 32: 166-175.
- Bastron AV, Muratov MR (2014) Optimization of the tilt angle of the reception area and heat performance of the solar collector at operation under the the conditions of Krasnoyarsk.
- Becker S (2001) Calculation of direct solar and diffuse radiation in Israel. Int J Climatol 21: 1561-1576.
- Dufï¬e JA, Beckman WA (2013) Solar Engineering of Thermal Processes.
- Sivkov SI (1968) Methods for calculating the characteristics of solar radiation. 232: 81.
- Samoilov DB (2006) Calculation of the amount of heat supplied from solar radiation to the Earth's surface. Methodical instructions.
- Sarailoo M, Akhlaghi S, Rezaeiahari M, Sangrody H (2017) Residential Solar Panel Performance Improvement based on Optimal Intervals and Optimal Tilt Angle. IEEE Power & Energy Society General Meeting.
Citation: Akbarov RY (2019) On Determination of the Optimum Tilt of Solar Installations. Innov Ener Res 8: 223.
Copyright: © 2019 Akbarov RY. This is an open-access article distributed under the terms of the Creative Commons Attribution License, which permits unrestricted use, distribution, and reproduction in any medium, provided the original author and source are credited.
Select your language of interest to view the total content in your interested language
Share This Article
Recommended Journals
Open Access Journals
Article Usage
- Total views: 4043
- [From(publication date): 0-2019 - Sep 30, 2025]
- Breakdown by view type
- HTML page views: 3185
- PDF downloads: 858