Optimization of operational parameters for adsorption of cellulases onto microcrystalline cellulose using REML and RSM methodologies.
Received: 19-Jan-2022 / Manuscript No. jabt-22-51861 / Editor assigned: 21-Jan-2022 / PreQC No. jabt-22-51861(PQ) / Reviewed: 04-Feb-2022 / QC No. jabt-22- 51861 / Revised: 09-Feb-2022 / Manuscript No. jabt-22-51861(R) / Published Date: 11-Feb-2022 DOI: 10.4172/2155-9872.1000439
Abstract
In most of the developed countries, the most of the transport running is on some form of biofuel. The main feedstocks used to produces biofuel are wheat and corn grans. The addition of bioethanol into motor fuels has increased the pressure to the grains supply market and food prices are on the increase due to a relation with the grains prices. A use of waste lignocellulosic materials (agricultural waste and /or forestry waste) would release this pressure.
The cost of biofuel production is based on the costs of two main reactant materials i) lignocellulosic materials, ii) enzymes. The cost of enzymes can be reduced by reuse of them. Apart from the redesigning of enzymes to increase enzymes stability at elevated temperature etc., it is also important to look into the optimization of operating parameters. The optimization of the adsorption parameters was performed by using statistical analysis tools such as Response Surface Methodology (RSM) and Restricted Maximum Likelihood Estimation (RMLE). The obtained binomial quadratic model predicted almost the same values of the cellulases adsorbed as that of experimental values within a percent error of x±6. The optimized values of the operating parameters were modified according to available practical knowledge and the model was validated. It was found to be in the agreement of the experimental values. The optimized conditions would help biofuel industry in designing their production process.
Highlights
The operating parameters for enzymatic adsorption such as adsorption temperature, enzymes concentration, and incubation time were optimized for production of biofuel.
The RSM response equation can be used for controlling efficiency of the adsorption reaction with multiple variables.
The interaction of operating parameters for the enzymatic adsorption and its efficiency was systemically analyzed for the first time using RSM and REML methods.
Keywords
RMLE; RSM; Lignocellulosic; Langmuir; Enzymatic adsorption; Optimization; Biofuel from biomass
Introduction
The most abundant biomass on earth is lignocellulosic material and its production 1.815 ×10⁹ tons per annum [1]. Agricultural residues and forestry wastes represent more than 90% of lignocellulosic material (biomass) in the world [2, 3] where lignocellulosic biomass contains 40- 75% of polysaccharides [4], which can be used for production of biofuel, hydrogel, and speciality chemicals. If Canada use waste lignocellulosic materials (agricultural waste, forestry waste) for the production of bioethanol, the cost of domestic ethanol will reduce. For example, Canada is producing 37.5 × 10⁶ tons of wheat straw, which in turn can produce 13.125 × 10⁹ liters of ethanol [5]. The annual allowable cut (AAC) for Canadian forest grow is 250 × 106 m3, which can produce 52000 × 106 liters of biofuel [6]. Therefore, Canada can use indigenous waste materials to produce bioethanol without being a burden on grain foods supplies, animal feed cycle or on tree conservation.
Bioethanol produced form grains (wheat and corn) is called first generation bioethanol production. The process comprises of sugar extraction with subsequent fermentation to bioethanol. The secondgeneration bioethanol production is from crops, which include agroresidues like rice and wheat straw, cane trash, corncobs and stover, cotton stalk, bagasse. In this case the polysaccharide are extracted and hydrolyzed to give monosaccharide units which are fermented to bioethanol [7]. Figure 1 shows a single chain of polysaccharide which is converted to disaccharide and finally to it’s a monomer unit i.e. glucose (Figure 1).
In the case of second-generation bioethanol production carbohydrate in biomass are not freely accessible for the conversion to bioethanol. Therefore, biological conversion of biomass to bioethanol involves various processes. The major steps include pretreatment of biomass to make it easily accessible (convertible) in downstream processes. The cellulose and hemicellulose portions of lignocellulosic biomass are then hydrolyzed to glucosidic units after that the sugars are fermentation to bioethanol. Finally, distillation separates bioethanol from water [8].
The economic impact of the enzymatic hydrolysis of cellulose of lignocellulosic feedstocks has been studying since early 2000s. The use of high input concentrations of cellulolytic enzyme enhance both the adsorption rate and the yield of the hydrolysis, the cost of the bioethanol production process is appreciably increased [9]. In a number of industries, a healthy environment is sustained due to enzymes, inclusive of animal feed, detergent, food, leather, oil, paper and pulp, petroleum, specialty chemical, textile, and biochemical industry. Cellulase is the enzyme that catalyzing the hydrolysis of β-1,4-glucoside linkages of cellulose (polysaccharide) chain and roughly classed into endolytic enzymes (endo-β-1,4-d-glucanase, EC 3.2 [10]. There is a need to reduce the cost of enzymatic hydrolysis to commercialize the production. Some authors have suggested to optimizing the enzymatic hydrolysis of cellulosic fraction obtained from lignocellulosics. To optimize the process parameters the statistical methods are increasingly in use. The methods orient experimental planning and design of experiments and, consequently modulate enzymatic and microbial metabolic responses [11, 12]. In this study response surface methodology was used to predict the best combination of three independent variables (i.e. the concentration of cellulolytic enzyme, reaction temperature, contact time). All three are related to the adsorption of cellulases in order to optimize the adsorption process. Conventionally, the optimization is performed by varying one factor at a time (OFAT). This technique is workable as long as a limited number of variables influences the process. Even then, the interaction effects of all variables cannot be assessed because it is cumbersome to manage trial of several variables are to be considered. Therefore, statistical tools such as Placket Burman and Response Surface Methodology (RSM) are used [13, 14]. RSM optimize process conditions, influence of various factors and their interactions on the manifestations under investigation (response value) [15, 16]. It fits a quadratic polynomial model through central composite experiment; moreover, it suggests experiment design and result in the form of an expression. In this study, the physicochemical parameters having influence on the adsorption of cellulases were studied through the classical OFAT method. Afterwards RSM was applied to predict the best combination of three independent parameters (enzymatic concentration, contact time/reaction time, incubation temperature), and interaction effects of those parameters. To the best of our knowledge, optimization of cellulases adsorption process has not been well published. Furthermore, the interaction of reaction temperature, enzyme concentration, and reaction time on the enzymatic adsorption efficiency was systemically analyzed for the first time using RSM and REML methods.
Materials And Methods
Cellulases, a commercial cellulase mixture, brown liquid, (NS50013, batch # CCN03129) from Trichoderma reesei was generously donated by Novozymes (Denmark). The solution contains exocellulases (cellobiohydrolases: CBHI and CBHII). CBHI hydrolyses both amorphous and crystalline cellulose. Endocellulases (Endoglucanases: EGI and EGII), adsorb preferentially on amorphous cellulose. The commercial enzyme mixture contains almost: CBH I (60%), CBH II (15%), EG I and II (20%), and BG (2%) [17, 18]. Molecular weights of the mixture components were 52000 for EGs [19, 20], 23000-58000 for EGs [21], and 60500 - 62000 for CBHs [21]. To simplify, the molecular weight of cellulases was taken as 60000. The enzymes mixrure was stored at 4°C until used. Every time before use mother solutions (varying concentrations) of cellulases were prepared, form the original stock solution.
Avicel PH 101 (analytical grade, 50 μm, 100% solids) was purchased from Sigma Aldrich, Canada. Avicel PH 101 was a microcrystalline cellulose. with an activity of 53 FPU/ml.
Methods
Adsorption of cellulases
5 ml of cellulases solution, V, (citrate buffer solution at pH 5) was added to 100 mg of the cellulose substrate, M. Mixed in glass tubes of 10 ml, in an incubator shaker at 100 rpm. After a predefined contact time (adsorption reaction), each tube was centrifuged at 4000 rpm for 4 minutes and the supernatant was skimmed off. The concentration of free (unbound) cellulases in the supernatant, Ef, was quantified by way of modified Lowry Method using Biochrom Libra S50 UV/ Vis Spectrophotometer. The concentration of cellulase that remained adsorbed onto a solid substrate was determined as the difference between the total concentration of cellulase initially applied and the concentration of free cellulase in the decanted supernatant solution. Triplicates were used for each of the contact times. The solid residues (thick slurry) remaining after the centrifugation step was immediately used for desorption study. The cellulases adsorbed per mg of substrate were calculated by Equation.
Incubation for Adsorption
New Brunswick Shakers Innova 40 was used for adsorption studies for incubation of adsorption samples. It is an orbital shaker with controllable rpm and temperature. With the help of a glass thermometer, the temperatures of the incubator were monitored from 20°C and 70°C and no difference in temperature readings was observed.
Analysis
The Biochrom Libra S50 model is a low maintenance UV/Visible spectrophotometer. Spectrophotometers utilize a monochromator enclosing a diffraction grating to produce the analytical spectrum. The grating can be either movable or fixed. In the Biochrom Libra S50 model, the grating is fixed and a different detector in the array measures the intensity of each wavelength of light. After amplification of the energy received, the display gives out the readings as shown in Figure 2.

Figure 2: Detection mechanism of a spectrophotometer.
Spectrophotometry is an important technique used in enzymology, which involves protein isolation, enzyme kinetics and biochemical analyses [22,23]. The principle of spectrophotometry includes comparing the absorbance of a blank sample that contains everything of the enzyme solution but not the substance (or enzyme) of interest to a sample, that contains the substance. The spectrophotometer is used to measure colored compounds in the visible region of light (between 350 nm and 800 nm) [24, 25]. In enzymology experiments, a chemical and/ or physical property is chosen and the procedure that is used is specific to that property in order to derive more information about the sample, such as the enzyme purity, enzyme quantity, enzyme activity, etc. Because a spectrophotometer measures the wavelength of a compound through its color, an enzyme binding substance can be added so that it can undergo a color change and be measured. Spectrophotometer is considered to be a highly accurate instrument which is very sensitive, hence, extremely precise, especially in determining color change [26].
Determination of initial rates of reaction
Initial rates of adsorption of cellulases on microcrystalline cellulose were determined at a variety of reaction conditions. The temperature was maintained at 25°C with varying enzyme loading. Reactions were carried out for 90 min at 100 RPM. Aliquots of the reaction mixture were taken sequentially at predetermined time to measure the amount of the enzymes adsorbed. The initial reaction rates were determined by drawing tangents on the adsorption profiles (adsorbed cellulases verses contact time). Experiments were carried out in triplicates and the concentration of the microcrystalline cellulose was constant.
Kinetics and mechanism of adsorption
To determine the kinetic parameters of adsorption, a large number of experiments were carried out by varying the concentration of cellulases for a fixed amount of microcrystalline cellulose. As per adsorption mechanism, cellulases enzymes [E] were bound to a substrates microcrystalline cellulose [S] to form a complex [ES]. This complex then isomerises to form another complex [EP], which releases product [P] and enzymes [E]. Kinetic parameters were determined graphically. A conceptual diagram about the complete hydrolysis process is given in Figure 3. While the dashed section is showing the adsorption part of it which is under consideration (Figure 3).

Figure 3: Concept of adsorption of Enzymes (E) onto a substrate (S).
The kinetic results of the adsorption of cellulases from Trichoderma reesei showed that the percent of adsorption of cellulases on microcrystalline cellulose was maximum at 30-50°C. As temperatures rise, enzymes gains more kinetic energy resulting in more collisions of enzymes with the microcrystalline cellulose, meaning faster adsorption reactions. Every enzyme has an optimum temperature where the reaction is at its quickest, after this, the active site of the enzyme is affected, and it results in the slowing down of the reaction, which will eventually stop. There was a negligible change with increase in temperature from 30 to 50°C. Increasing temperature beyond 50°C slows down the adsorption of celluloses onto microcrystalline cellulose.
Optimization of adsorption
The strategy to optimize the adsorption process included a traditional approach known as one-factor-at-a-time (OFAT). The OFAT is contingent on changing only one factor at time and keeping other factors constant. The operating parameters were varied one at a time in the aqueous medium and their impacts on cellulase adsorption were measured. The contact time of the cellulase was varied in the range of 0 to 90 minutes; the incubation temperature in the range of 30–70°C; cellulases concentration in the range of 100.0–250.00 μg mL-1.
Responses of experimental design
The downsides associated with OFAT are: (a) the method is exceptionally disorganized and inefficient, which leads to an unnecessarily large number of experimental runs, (b) the investigator is unable to study interactions among the factors. Therefore, statistical optimization technique design of experiment (DOE) was used in this study. The software used for this purpose was Stat-Ease, Design Expert Version 12 (trial). For optimization, the coding of factors is given in Table 1. It is a layout of 2-level design using +1 and -1 notations for the high level and low level, respectively (Table 1).
The composition of experimental runs using central composite design (CCD) for the optimization of the variables and responses is given in Table 2.
The experimental design set up is shown in Table 2. RSM features the interaction of depending variables and promotes simultaneously optimizing of all process variables with a smallest number of experimental runs. A second-order polynomial equation describing the empirical relationship between the independent variables and response is given underneath.
where, Adsorbed is the predicted response of cellulases adsorbed, β0 is the intercept, β1,β2, β3, are the linear coefficients, β11,β22,β33, are the squared coefficients, and β12,β13,β23 are the interaction coefficients. To find the optimum combination and effect of parameters on the adsorption of enzymes 15 experiments were performed. Experimental data from the CCD was analyzed using regression analysis.
Analysis
The statistical analysis were performed by using Restricted Maximum Likelihood Estimation (REML). REML is actually a way to estimate variance components which estimates generalized least squares (GLS) of the fixed effects parameters. GLS is the same as least squares however; it constitute covariances among the responses.
REML obtained regression residuals for the experimental values by the fixed effects portion of the model, ignoring any variance factors. Then a statistical model is selected for these residuals. All the residuals have mean 0. Once a statistical model for these residuals is obtained, then maximum likelihood estimation on the residuals is performed to estimate the variance components. This approach adjusts the variance estimates by the Maximum Likelihood Estimation (MLE) based on regression residuals. As the consequence of this adjustment the error variance is estimated by using a denominator of (n – p), where p is the quantity of fixed effects parameters. In the simplest case the REML estimate of variance would be MSE with a (n – 1) denominator. The claim to fame of REML is this unbiasing of the error variance.
For the analysis, Fischer’s F test was performed to judge the model’s overall significance, allied probability values, and the regression model measured the goodness of fit. The fitted polynomial equation is presented in the form of 3D and contour plots. Finally, the model was ratified.
Results and discussion
In the study of adsorption of cellulases, the main factor is the amount of cellulases adsorbed. This amount is varied by the change in concentration of substrate, which is microcrystalline in this case, concentration of enzymes, time of contact between cellulose and cellulases, temperature of the reaction mixture. For the purpose of experimentation, the amount of cellulose was fixed (i.e. 100 mg) and rest of the parameters were changed as given in the section ‘Optimization of adsorption’. Figure 1 shows initial rate of adsorption of cellulases (enzymes) on the microcrystalline cellulose (MCC) at 30 °C. Total contact time was 90 minutes. The initial rates of adsorption of cellulose was measured from the start of adsorption reaction. The initial rates of adsorption of cellulases onto the microcrystalline cellulose are given in Figure 4.

Figure 1: Breaking down of polysaccharide to simple glucose unit.

Figure 4: Initial rate of adsorption of enzymes on MCC at 25OC at 95% probability.
It was observed that the initial rate of adsorption of cellulases onto the fixed amount MCC, at 100 rpm, 25°C, was increased with the increase in initial enzyme concentration [E0] from 125 to 250-μg mL-1 [27, 28]. There was no significant change in initial rate of adsorption of cellulases at 275 μg mL-1 than that of 250 μg mL-1 It was also observed that 85-90% of total enzymes adsorbed within first 10 minutes of adsorption reaction. The reaction was very fast in start then it gradually slows down. It obtained equilibrium at 30 minutes but experiment was carried out until 90 minutes. This would be more understandable by comparing the initial reaction rate, which varied from 1.13 × 10⁻¹ to 2.03 × 10⁻¹ μg mL-1 sec-1 for the corresponding concentration range of 125 to 250 μg mL-1. On the other hand, the rates of reaction decreased with the passage of reaction time. For example, the initial rate of reaction 1.130 ×10⁻¹ μg mL-1 sec-1 decreased such that the average rate of reaction comes out to 1.6 × 10⁻² μg mL-1 sec-1.
RSM model fitting
The statistical analysis technique RSM was used to optimize all the various parameters of enzymatic adsorption. The composition of various runs of the CCD in term of coded factors, are given in Table 1. The experiments were performed in random order to avoid bias. The data was tried to fit to the various models (linear, two factorial, quadratic and cubic) showed that the desorption of enzymes onto MCC was best described by a quadratic model. The model Equation ‘C’ is given in the terms of coded factors:
| Factor | Name | Units | Type | Min | Max | Coded low | Coded high |
|---|---|---|---|---|---|---|---|
| A | Conc. | µg mL-1 | Numeric | 100.00 | 250.00 | -1 ↔ 100.00 | +1 ↔ 250.00 |
| B | Time | Min | Numeric | 10.00 | 90.00 | -1 ↔ 10.00 | +1 ↔ 90.00 |
| C | Temp. | OC | Numeric | 30.00 | 70.00 | -1 ↔ 30.00 | +1 ↔ 70.00 |
Table 1: The factor setting (coding).
Cellulases Adsorbed = 103.42 + 15.01 *A + 9.12 * B -6.95 * C -2.81 *A * B- 5.45 A*C
-6.33 * B*C -3.66 * A2 -0.52 * B2 -8.88* C2 … (C)
The equation in terms of coded factors can be used to make predictions about the response for given levels of each factors and the coded equation is useful for identifying the relative impact of the factors by comparing the factors coefficient. The final Equation ‘D’ in terms of actual factors is:
Cellulases adsorbed = -43.85 +0.65* Conc. + 0.46 * Time + 2.55 * Temp.
-0.0009* Con. * Time – 0.0036 *Conc. *Temp- 0.0008 *Time *
Temp – 0.0006* Conc2 -0.0003 * Time2 -0.022 *Temp2 … (D)
The amounts of actual cellulases adsorbed onto MCC are compared with the predicted values of cellulases adsorbed obtained by using Equation ‘D’. The comparison is given in Table 3.
| Factor A Conc. μg mL-1 |
Factor B Time min |
Factor C Temp. OC |
Actual Ads. μg mL-1 |
Predicted Ads. μg mL-1 |
% Error |
|---|---|---|---|---|---|
| 175 | 10 | 30 | 93.04 | 92.08 | 1.42 |
| 175 | 50 | 50 | 99.04 | 104.90 | 5.89 |
| 175 | 50 | 50 | 100.23 | 104.90 | 4.66 |
| 150 | 40 | 50 | 97.80 | 96.57 | 1.25 |
| 150 | 90 | 70 | 89.80 | 94.83 | 5.60 |
| 150 | 90 | 30 | 110.41 | 105.31 | 4.62 |
| 200 | 55 | 70 | 98.65 | 92.90 | 5.82 |
| 200 | 10 | 50 | 99.64 | 101.02 | 1.40 |
| 200 | 90 | 30 | 112.41 | 117.86 | 4.84 |
| 100 | 90 | 50 | 98.78 | 96.92 | 1.88 |
| 100 | 10 | 70 | 62.64 | 63.76 | 1.79 |
| 100 | 40 | 30 | 70.66 | 74.41 | 5.30 |
| 250 | 90 | 55 | 117.85 | 123.77 | 5.02 |
| 250 | 10 | 70 | 85.56 | 90.61 | 4.68 |
| 250 | 40 | 30 | 116.71 | 118.81 | 1.80 |
Table 3: Comparison of the actual celluloses adsorbed with the predicted calluses adsorbed by using a RSM model equation.
The percentage error calculated between the two values of cellulases adsorbed was found to be less than 6%. The acceptability of the model and significance of the operating parameters are generally checked by model F values, p-values. According to the Table 4, a p-value less than 0.050 implies that the model is significant. In this case, the model terms A (concentration), B (Time of contact), C (Temperature) are significant terms (Table 4).
The p-values larger than 0.10 imply that the model terms are not significant [29, 30]. Therefore, no quadratic parameters (A2, B2) and interaction quadratic parameters are significant but C2. There is only a 0.01% probability that a “Model F-Value” this large could occur due to noise [31]. Values of “Prob > F” less than 0.0500 indicates model terms are significant [32]. The coefficient of determination (R2) turned out to be 0.9412, which showed the suitability of the model to represent the relationship between the reaction parameters. Figure 5 is a normal probability plot showing the correlation of the actual values of adsorption and the predicted values of the model. A linear distribution of the values confirmed a well-fitting model. The effect of reaction parameters on the ester synthesis was then studied using equation ‘c’ (Figure 5).
The relationship between the theoretical percentiles and the sample percentiles is approximately linear. This normal probability plot shows that the residuals are normally distributed, but there is just one outlier. The relationship is approximately linear with the exception of the one data point. Therefore, the error terms are normally distributed upon ignoring the outlier from the data set.
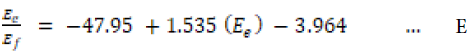
However, based on values of the mean percentage error and the R2 value, the linear form of the Langmuir isotherms appear to produce a reasonable model for the adsorption of cellulases onto microcrystalline cellulose. Langmuir isotherm gives a correlation between various concentrations at the equilibrium contact time. The isotherms at various concentration at 30°C and plots of equilibrium data are given in our paper entitled, “Adsorption and desorption of cellulases NS 50013 onto/from Avicel PH 101: a simple functional model”. The representative linear regression equation obtained using Scatchard plot of Langmuir isotherm is given belowas Equation ‘E’:
Scatchard plot make it easier to identify inflection points in heterogeneous adsorption processes [33]. The plot of adsorption of cellulases onto microcrystalline cellulose against the ratio of enzymes adsorbed to the cellulases free in the solution showed no inflection. The non-adsorbed cellulases Ef were directly proportional to the initial cellulases concentration E0. That was the case of two variables i.e. contact time and enzymes concentration while substrate con centration, temperature and shear conditions were fixed. In the presented case cellulases adsorbed were a function of three variables i.e. contact time, enzymes concentration and reaction temperature. Therefore, we have to use statistical analysis tools.
Optimization
Effect of parameters
The relationships between temperature and other reaction parameters were studied by a series of contour plots, which were generated from the predicted model. The plots efficiently indicate the effect of the reaction parameters on the synthesis of the ester. Figure 5 depicts the combined effect of the enzyme loading and the molar ratio on the percentage conversion at a constant temperature of 50°C, 250 rpm and 120 min reaction time. The higher percentage adsorption (68- 70 %) was observed when the enzyme loading was low (100-125 μg mL-1). While an increase in enzyme loading from 100 to 250 μg mL-1, decreases the percentage adsorption to 45-40%. While the total quantity of cellulases adsorbed were maximum at the higher concentration of cellulases 250 μg mL-1. However, further increase in enzyme loading, the adsorbed quantity was not changed.

Figure 5: Normal probability plot to compare the normality of the residues.
The average rate of adsorption was 0.016 μg mL-1 sec-1 for low concentration of enzymes. which increased with the increase in initial enzymes concentration but it was very slow. For example the adsorption rate at 225, 250 and 275 μg mL-1, was 0.021, 0.021 and 0.022 μg mL-1 sec-1. The decrease could be because of two reasons: i) the number of available sites were decreasing with increase in enzymes concentrations, ii) more concentration of enzymes in the solution hinder each other in the movement towards adsorption sites on the substrate. Figure 6 depicts the effect of time, initial concentration of enzymes and their mutual interaction on adsorption at MCC to 100 rpm and 10-90 min reaction time.
Figure 6 is showing a couture plot of the set of trivariate data. The contour plots are topographical plots to show a three-dimensional surface on a two-dimensional plane. It graphs two predictor variables X1 = time and X2 = concentration on the y-axis, x-axis and third variable (cellulases adsorbed) is represented by a color gradient and isolines (lines of constant value). The contour curves are linear, which implies that the interaction term is not significant; if the contour curves have considerable curvature, then that implies that the interaction term is large and important. In the Figure 6, the contour curves do not have considerable curvature, and so the conclusion is that the multiple of [time * concentration] term is not significant as given in Table 4. Similarly the terms [time * temperature] and [temperature * concentration] are also not significant (Figure 6).

Figure 6: Contour plot showing the relationship between the Enzymes adsorbed
and other factors.
| Source | Term df | Error df | F-value | p-value | |
|---|---|---|---|---|---|
| Whole-plot | 2 | 5.00 | 18.48 | 0.0049 | Significant |
| A-Conc. | 1 | 5.00 | 35.91 | 0.002 | |
| A2 | 1 | 5.00 | 1.050 | 0.352 | |
| Subplot | 7 | 5.00 | 6.010 | 0.033 | Significant |
| B-Time | 1 | 5.00 | 18.36 | 0.008 | |
| C-Temp. | 1 | 5.00 | 10.63 | 0.022 | |
| AB | 1 | 5.00 | 0.187 | 0.407 | |
| AC | 1 | 5.00 | 3.070 | 0.140 | |
| BC | 1 | 5.00 | 0.059 | 0.808 | |
| B2 | 1 | 5.00 | 0.020 | 0.893 | |
| C2 | 1 | 5.00 | 6.140 | 0.056 |
Table 4: REML analysis, Fischer’s F-values and p – values.
It was observed that the adsorption increased with the increase in enzyme concentration from 100 μg mL-1 to 250 μg mL-1 and the reaction was gradually getting slower. In a separate set of experiments under same operating conditions it was observed that at 275 μg mL-1 there was not much difference in adsorption values than that of 250 μg mL-1 due to occupation of active sites. Like all other chemical reactions it is also true that the collisions between enzyme and substrate molecules increase with an increase in temperature that gives a higher adsorption rate. The software predicted the optimum reaction temperature, enzyme loading and reaction time was 61.6°C, 226.67 μg mL-1 and 70 minutes, respectively. The predicted the adsorption of cellulases was 105.60 μg mL-1. As shown in Table 5, three parallel experiments were conducted under the optimal conditions. Compared with the value predicted by Stat-Ease, Design Expert Version 12 (trial) , the results showed that the predicted value was very close to the actual results. This indicated that the optimization is reliable in the present study.
| Temperature | Concentration | Time | Adsorbed | |
|---|---|---|---|---|
| OC | μg mL-1 | Minutes | μg mL-1 | |
| Optimum suggested | 61.6 | 226.67 | 67.07 | 105.60 |
| Modified | 50 | 220 | 70 | 111.25 |
Table 5: Optimum suggested conditions predicted and experimental values.
Time: Time of Contact; Temperature: Temperature of reaction; Concentration: Concentration of cellulases; Adsorbed: cellulases adsorbed on microcrystalline cellulose
The temperature was changed from 60 to 50°C which is close not a big difference from the industrial application point of view. The rate of adsorption was found to decrease with an increase in temperature from 50 to 70°C because of disruption of enzyme tertiary structure and denaturation at higher temperature [34, 35, 36]. In our adsorption experiments, the concentration of cellulases adsorbed was decreased at 60 and 70°C.
Data analysis
Data was articulated as standard errors of the means (SEM) of triplicate determinations. The response of every set of experimental design was exposed to multiple non-linear regressions by the Design Expert software (Table 2). The fit of the polynomial model equation was given by the coefficient as F-test and p-value.
| Run | Factor A Conc. mg mL-1 |
Factor B Time min |
Factor C Temp. OC |
Response Ads. mg mL-1 |
|---|---|---|---|---|
| 1 | 175 | 10 | 30 | 90.00 |
| 2 | 175 | 50 | 50 | 99.04 |
| 3 | 175 | 50 | 50 | 100.20 |
| 4 | 150 | 40 | 50 | 95.00 |
| 5 | 150 | 90 | 70 | 87.00 |
| 6 | 150 | 90 | 30 | 110.00 |
| 7 | 200 | 55 | 70 | 98.00 |
| 8 | 200 | 10 | 50 | 100.00 |
| 9 | 200 | 90 | 30 | 110.40 |
| 10 | 100 | 90 | 50 | 98.72 |
| 11 | 100 | 10 | 70 | 62.60 |
| 12 | 100 | 40 | 30 | 70.66 |
| 13 | 250 | 90 | 55 | 117.81 |
| 14 | 250 | 10 | 70 | 85.00 |
| 15 | 250 | 40 | 30 | 116.70 |
Table 2: Experimental design for various runs of CCD for adsorption of cellulases.
Conclusions
In this paper, the conditions for adsorption of cellulases onto microcrystalline cellulose were optimized by using RSM and REML techniques. The results demonstrated that the change of reaction temperature, enzyme concentration and reaction time could significantly affect the yields of adsorption. The estimated models were able to indicate adsorption conditions. This technique provides a way to examine the non-linear nature between independent variables under consideration and responses in a short-term experiment
The validation of the model confirmed the reliability of the second order polynomial equation (Eq. (D) in predicting the best enzymatic adsorption. The R2 obtained after the model fitting was 0.94 with a mean of 96.57 and REML implied that the model had satisfactorily indicated and explained the actual relationship of the adsorption parameters.
As compared to a one factor at a time method, the statistical optimization method predicted values, which were confirmed by experimental results.
The model was statistically significant as given by low P and high F values. Therefore, it can be concluded that the model can potentially be applied for the adsorption of cellulases. Based on the encouraging outcomes of this shake-flask investigation, production in a bioreactor and the utilization of cheap substrates derived from the lignocellulosic waste materials need to be addressed in future investigations. The objective would be studying extend feasibility to reduce production costs and economic practicability of the process.
References
- Dahmen N, Lewandowski I, Zibek S, Weidtmann A (2019) Integrated lignocellulosic value chains in a growing bioeconomy: Status quo and perspectives. GCB Bioenergy 1: 107-117.
- Kuhad RC, Singh A (1993) Lignocellulose biotechnology: current and future prospects. Crit Rev Biotechnol 13: 151-172.
- Saini JK, Saini R, Tewari L (2015) Lignocellulosic agriculture wastes as biomass feedstocks for second-generation bioethanol production: concepts and recent developments. Biotech, 5: 337-353.
- Marriot PE, Gomes LD, Mason M (2016) Unlocking the potential of lignocellulosic biomass through plant science. New Phytol 209(4): 1366-1381.
- Baig KS (2016) Strategic adsorption/desorption of cellulases NS 50013 onto/from Avicel PH 101 and Protobind. Ph.D. Dissertation presented to School of Graduate Studies at Ryerson University, Toronto, Canada.
- Natural Resources Canada (2017) The state of Canada’s forests: Annual report 2017. Cat No. Fo1-6F-PDF (Online). ISSN: 1196-2736. Natural Resources Canada.
- Zabed H, Sahu JN, Suely A, Boyce AN, Faruq G (2017) Bioethanol production from renewable sources: Current perspectives and technological progress. Renew Sust Energ Rev 71: 475-501.
- DMd C, Sevastyanova O, Pennam LS, Silva BP, Lindström ME, Colodette JL (2015) Assessment of chemical transformations in eucalyptus, sugarcane bagasse and straw during hydrothermal, dilute acid, and alkaline pretreatments. Ind Crops Prod 73: 118-126.
- Sun Y, Cheng J (2002) Hydrolysis of lignocellulosic materials for ethanol production: a review. Bioresour Technol 83 (1):1-11.
- Mojsov KD (2016) Aspergillus Enzymes for Food Industries. New and Future Developments in Microbial Biotechnology and Bioengineering. Else : 215-222.
- Braiuca P, Eber, C, Basso A, Linda P, Gardossi L (2006) Computational methods to rationalize experimental strategies in biocatalysis. Trends Biotechnol 24(9): 419-425.
- Bas D, Boyaci IH (2007) Modeling and optimization I: usability of response surface methodology. J Food Eng 78(3): 836-845.
- Bai XL, Yue TL, Yuan YH, Zhang HW (2010) Optimization of microwave-assisted extraction of polyphenols from apple pomace using response surface methodology and HPLC analysis. J Sep Sci 33: 3751-3758.
- Zhou Y, Fung-Kei CF, He ZZ, Song JZ, Qiao CF, Liu X, Ding LS, Gesang SL, Xu HX (2010) Optimization of ultra-performance LC conditions using response surface methodology for rapid separation and quantitative determination of phenolic compounds in Artemisia minor. J Sep Sci 33: 3675-3682.
- Leong K, See, Lim J, Bashir MJ K, Ng C, Tham L (2017) Effect of process variables interaction on simultaneous adsorption of phenol and 4-chlorophenol: statistical modeling and optimization using RSM. Appl Water Sci 7:2009-2020.
- Zhang LL, Xu M , Wang YM, Wu DM, Chen JH (2010) Optimizing ultrasonic ellagic acid extraction conditions from infructescence of Platycarya strobilacea using response surface methodology. Mol 15(11): 7923-7932.
- Wang M, Li Z, Fang, X, Wang L, Qu Y (2012) cellulolytic enzyme productionand enzymatic hydrolysisfor second-generation bioethanol production. Adv Biochem Eng Biotechnol 128: 1-24.
- Dotsenko A, Gusakov A, Rozhkova A, Sinitsyna O, Shashkov I, Sinitsyn A (2018) Enzymatic hydrolysis of cellulosic materials using synthetic mixtures of purified cellulases bioengineered at N-glycosylation sites. Biotech 8(9): 396.
- Halliwell G, Griffin M (1978) Affinity Chromatography of the Cellulase System of Trichoderma koningii. Biochem J 169(3): 713-715.
- Gong C, Ladish M R, Tsao GT (1979) Biosynthesis, purification and mode of action of cellulases of Trichoderma reesei. Ameri Chem Soc 261-287.
- Beldman G, Searle-van Leeuwen M, Rombouts F, Voragen F (1985) The Cellulose of Trichoderma viride: purification, characterization and compari-son of all detectable endoglucanases, exoglucanases and beta-glucosidases. Eur J Biochem 146(2): 301-308.
- Trumbo A T, Schultz E, Borland M G, Pugh ME (2013) Applied spectrophotometry: Analysis of a biochemical mixture. Biochem Mol Biol Educ 41(4): 242-250.
- Robinson PK (2015) Enzymes: principles and biotechnological applications. Essays Biochem 15(59):1-41.
- Mavrodineanu R (1972) An accurate spectrophotometer for measuring the transmittance of solid and liquid materials. J Res Natl Bur Stand A Phys Chem 76(5):405-425.
- Krishnan K, Balasundaram S (2017) Evaluation of Total and Lipid Bound Sialic Acid in Serum in Oral Leukoplakia. J Clin Diagn Res 11(3): 25-27.
- Mavrodineanu R, Shultz JI, Menis O (1973) Accuracy in spectrophotometry and luminescence measurements. Proceedings of the Conference Held at the National Bureau of Standards, Gaithersburg, Md. March 22-24, 1972. Proceedings issued on 1973. Library of Congress catalog Card Number: 73-600068.
- Pihlajaniemi V, Sipponen MH, Kallioinen A, Nyyssölä A, Laakso S (2016) Rate-constraining changes in surface properties, porosity and hydrolysis kinetics of lignocellulose in the course of enzymatic saccharification. Biotechnol Biofuels 9:18.
- Djajadi DT, Pihlajaniemi V, Rahikainen J, Kruus K, Meyer AS (2018) Cellulases adsorb reversibly on biomass lignin. Biotechnol Bioeng 115(12):2869-2880.
- Dahiru T (2008) P - value, a true test of statistical significance? A cautionary note. Ann Ib Postgrad Med 6(1):21–26.
- Greenland S, Senn SJ, Rothman KJ, Carlin JB, Poole C, Goodman SN, Altman DG (2016) Statistical tests, P values, confidence intervals, and power: a guide to misinterpretations. Eur J Epidemiol 31(4):337-350.
- Sumithra A, Sundari MS, Venkatesan S, Rengasamy M, Lakshmi AB (2014) Statistical optimization of chromium ion removal using response surface methodology. J Chem Pharm Sci 4(4): 974-2115.
- Myers RH, DC, Montgomery (2002) Response Surface Methodology: Process and Product Optimization Using Designed Experiments. J Pharma: 824.
- Undin T (2015) Characterization of molecular adsorption using liquid chromatography and mass spectrometry. Digital Comprehensive Summaries of Uppsala Dissertations from the Faculty of Science and Technology 1. J Epidemiol: 50.
- Baig KS, Turcotte G, Doan H (2016) Adsorption and desorption of Cellulases NS 50013 onto/from Avicel PH 101: a simple functional model. Int J Waste Resour 6(43).
- Souza TV, Araujo JN, da Silva VM, Liberato MV, Pimentel AC et.al (2015) Chemical stability of a cold-active cellulase with high tolerance toward surfactants and chaotropic agent. Biotechnology reports 9: 1-8.
- Chang CJ, Lee CC, Chan YT, Trudeau DL, Wu MH et.al (2016) Exploring the Mechanism Responsible for Cellulase Thermostability by Structure-Guided Recombination. PloS one 11(3): e0147485.
Indexed at, Google Scholar, Crossref
Indexed at, Google Scholar, Crossref
Indexed at Google Scholar, Crossref
Indexed at Google Scholar, Crossref
Indexed at Google Scholar, Crossref
Indexed at, Google Scholar, Crossref
Indexed at, Google Scholar, Crossref
Indexed at, Google Scholar, Crossref
Indexed at, Google Scholar, Crossref
Indexed at, Google Scholar, Crossref
Indexed at, Google Scholar, Crossref
Indexed at, Google Scholar, Crossref
Indexed at, Google Scholar, Crossref
Indexed at, Google Scholar, Crossref
Indexed at, Google Scholar, Crossref
Indexed at, Google Scholar, Crossref
Indexed at, Google Scholar, Crossref
Indexed at, Google Scholar, Crossref
Citation: Baig KS (2022) Optimization of Operational Parameters for Adsorption of Cellulases onto Microcrystalline Cellulose using REML and RSM Methodologies. J Anal Bioanal Tech 10: 440. DOI: 10.4172/2155-9872.1000439
Copyright: © 2022 Baig KS. This is an open-access article distributed under the terms of the Creative Commons Attribution License, which permits unrestricted use, distribution, and reproduction in any medium, provided the original author and source are credited.
Select your language of interest to view the total content in your interested language
Share This Article
Open Access Journals
Article Tools
Article Usage
- Total views: 3701
- [From(publication date): 0-2022 - Dec 16, 2025]
- Breakdown by view type
- HTML page views: 3064
- PDF downloads: 637