Outpatient's Level of Satisfaction at Private and Public Health Institution in Southwest Ethiopia: Ordinal Logistic Regression Model Supported with a Qualitative Study
Received: 30-Jun-2023 / Manuscript No. snt-23-107787 / Editor assigned: 03-Jul-2023 / PreQC No. snt-23-107787(PQ) / Reviewed: 17-Jul-2023 / QC No. snt-23-107787 / Revised: 24-Jul-2023 / Manuscript No. snt-23-107787(R) / Published Date: 31-Jul-2023 DOI: 10.4172/snt.1000206
Abstract
Background: Patient satisfaction in the outpatient department is characterized by a positive personal perception of the item or service received from the health institution. Despite patient satisfaction being the pillar for individual patient recovery from disease, there is a lack of information about it.
The purpose of this study was to figure out what factors affect patients’ level of satisfaction at private and public health facilities in, Southwest Ethiopia.
Methods: An institution-based comparative cross-sectional study was conducted from April 1 to May 15, 2021. This investigation was done on 348 study participants; from those 174 clients were from private institutions an institution-based comparative cross-sectional study and 174 clients were from public health institutions. A systematic random sampling method was used to select individual study participants. Key informant interview was conducted on eight health professionals who were selected by purposive sample technique. Ordinal logistic regression and the independent sample Mann-Whitney U test were used to analyze inferential data by using SPSS version 20 software.
Result: The result of this study revealed that being male β= -1.36 [p = 0,002, 95%CI (-2.23-to -0.50)], Tangibility β= 0.62 [p = 0, 003, 95%CI (0.077- 1.15)] assurance β= 1.34 at [p < 0, 001, 95%CI (0.62- 2.07)] and responsiveness β= 1.12 [p < 0, 001, 95%CI (0.52- 1.91)] were statistically significant effect on the level of satisfaction in a public health facility. While empathy β= 2.78 [p < 0.001, 95%CI (1.73- 3.8)] and tangibility β= 0.95 [p = 0, 013, 95%CI (0.201- 1.69)] were statistically significantly associated.
Conclusion: Patients at private health facilities had better levels of satisfaction than public health facilities. This study recommends that to improve patient satisfaction; health providers, zonal health office, regional health administration, and the minister of health should work collaboratively to improve satisfaction with the “right drug for the right patient” principle. In addition, governmental health facilities should work with other stakeholders to improve patient satisfaction levels.
Keywords
Level of satisfaction; Quality of health service; Health facilities; Private facilities; Public facilities
Abbreviation /Acronym
WHO: World health organization; OPD: Outpatient department; IoT: internet of things; WTO: World trade; organization; HSDP IV: Health sector development program IV; SPSS: Statistical package for social science; AOR: Adjusted odd ratio; CI: Confidence interval; VD: Very dissatisfied; VS: Very satisfied; VIF: Variance inflation factor; ORL: Ordinal logistic regression; SERVQUAL: Service quality; SERVPREF: Service performance; TB: Tuberculosis; AIDS: Acquire immune deficiency
Introduction
Satisfaction is a function of a perceived discrepancy from an initial expectation, when the service or product received is above the expected level the clients become satisfied. On the other hand, if the clients received a product or service below the expected level they become unsatisfied [1, 2]. Customer satisfaction is defined as a customer’s perception of the degree to which the customer’s requirements have been fulfilled. This definition clearly shows that customer satisfaction is a subjective judgment of whether their requirements (not the contractual obligations) are fulfilled. It also points out that customer satisfaction is not a yes/no issue, but a range of different levels of satisfaction [3, 4].
Outpatient department patient satisfaction level is a method of measuring the happiness or satisfaction of patients due to the service or product delivered to them by health institution employees in terms of quantitative methods. Satisfaction on its own is difficult to measure because the factor that satisfied someone will not be satisfied the other as well there is no single factor that determines the level of satisfaction [5-7]. The healthcare industry is undergoing a rapid transformation to meet the ever-increasing needs and demands of its patient population. The level of patient satisfaction is an important health outcome, which is regarded as a determinant measure of the quality of care [8-12]. Despite technological advancement and sophisticated organizational management systems, developing countries are unable able to meet the basic health needs of their people, especially for poor and vulnerable populations [13, 14]. Health services in Ethiopia are primarily financed from many sources are the federal and regional governments, grants and loans from bilateral and multilateral donors, non-public organizations, and private institutions. Relative to other organizations in Ethiopia huge amount of finance is allocated to health institutions but the service delivery system is not developed and does not get the need of customers this remains a major challenge for the health care system of Ethiopia [15- 18].
Most studies done on, this title was only one paradigm (quantitative) method. However, Satisfaction is a very complex concept with multiple definitions and applications. It could also be the reflection of an individual’s psychological makeup, belief, value systems, and environmental and cultural factors. Due to this study, qualitative data were added included order to increase the credibility of the results [19- 21].
Southwest region is a large region but there is no study, which is related to this paradigm so this study aims to assess Patient satisfaction level and its determinant in outpatient departments in the case of public and private health facilities in Southwest, Ethiopia in 2021
Research question
Is there a significant difference in patient’s level satisfaction between private and public health facilities?
What is the nature of the relationship between quality of health service dimensions and patient satisfaction levels at private and public health facilities?
What is the effect of socio-demographic factors on patient satisfaction levels at private and public health facilities?
Objectives
General objective
To examine determinates of patient’s level of satisfaction at private and public health facilities in southwest Ethiopia
Specific objective
To determine the effect of a socio-demographic factor on the patient satisfaction level
To compare patient satisfaction levels between public and private health facilities
To examine the relationship between quality of health service dimensions and patient satisfaction level
Significance of the study
Ethiopia is one of the developing countries where health service is not properly addressed to individuals in the right way and at right time in both public and non-public health institutions. Due to this, the level of satisfaction is low; it needs improvement by identifying the determinant factors.
Health professionals mostly focus on how to treat the patient depending on the treatment guideline but give less attention to patient satisfaction, so this study result will be used to increase the awareness of health professionals towards their patient’s satisfaction level by delivering appropriate products and services.
Since there was variability in the level of satisfaction and its determinants in many studies, the finding of this investigation will show the real level of satisfaction and its determinants in the study area. The finding of this study was also used as a source of scientific evidence and performance evaluation for clinical managers, zonal health bureaus managers, and other NGOs who are working on health.
Methods
Study design and period
A comparative cross-sectional study design triangulated with the qualitative study was employed from April 1 to May 15, 2021
Study area
Bench Sheko zone is one of the 25 zonal administrations in the SNNP region of Ethiopia, located 562 km away from Addis Ababa (the capital city of Ethiopia). According to Bech Sheko public administration office evidence, the total population of the zone is estimated to be 639,669 from those 323, 013 are females, 316,616 are males and the number of under-five children in the zone is estimated to be 97,616. The population of Mizan Aman town is estimated to be 52,210 from 18,625 of whom are male and the rest 31,135. In Mizan Aman town, four health facilities give treatment services to patients. Its climatic condition is temperate climatic condition and gets rain most of the time in different seasons per year. In the area people’s major economic source, mostly depend on coffee growing, in some area farming, and livestock rearing. The major food crops grown are maize, rice; coffee, teff; godere (taro root), inset, sorghum, wheat, and bean. the cash crops including fruits(banana, orange, pineapple) and spices (ginger, coriander).
Sources of data & data collection techniques
This research used primary sources of data with a face-to-face interview with a pre-tested structured questionnaire adapted from the patient satisfaction index (PSQ 18) and other published literature used to collect data on socio-demographic characteristics and quality of service-related variables [22-25]. Pre-testing of the questionnaire was made to ensure the quality of the data. Pre-test performed on 10% (35 respondents) of sample size students in one of the unselected health facilities before actual data collection. After pre-tested, clarifications and corrections are done on the questionnaire accordingly. Moreover, the English version questionnaire was translated into Amharic by the language expert and then back to English to maintain its consistency. Data quality is maintained by recruiting data collectors who had worked at the health institution and giving training. The data collectors & supervisors provided training for two days before data collection on the objective of the study. Moreover, giving training was important for how to collect data for this study purpose, using face-to-face interviews. The place where the interview takes place may affect the feeling of the respondent to minimize this bias the interview took place at a private place and assuring the confidentiality of information. The supervisors throughout the data collection period were closely monitoring the data collection process. Made close communication with data collectors and supervisors when gaps identified corrections made timely.
Target population
Source population
All patients who come to the outpatient department in the selected public or private health facilities between April first to May 15 /05/2021 were the source population. For the qualitative part, the source population was health professionals from each private and public health facility.
Study population
All selected eligible patients who got service from the outpatient department in time between April first to May 15 /05/2021. Participants of the key informant interview were heads of health facilities and selected health professionals from each private and public health facility.
Study unit
Selected individuals
Eligibility criteria
All clients who came to private and public health facilities to seek health services within one year.
Inclusion criteria
All clients aged 18 or above were included in the study.
Exclusion criteria
Those seriously ill individuals who could not give a response were excluded from the study.
Sample size calculation and determination
The sample size was determined with double population proportion formula. The following assumption was considered 95% confidence interval, power of 80 %, and private-to-public health sample size ratio was 1:1. According to the study done in East Wolega On the title of outpatient client’s satisfaction among private and regular (public) health care service reported that the proportion of satisfaction among private health facility was 68.84% and satisfaction among regular (public) health facility was 58.16%. By using this proportion the final sample size was calculated as follows. For qualitative part 8 key informants (three health professionals from public and one private health facility the remaining 2 study participants were selected from the rest of the private health institutions which was included in the study).
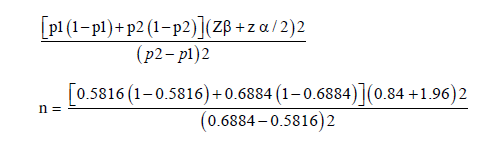
n = 316
The where:-n sample size included in the study
P1 = is the proportion of the population who served in public health service, this was 58.16%
P2 = is the proportion of the population who served at private health service, this was 68.84%
Z α/2 = is the standard score value for a 95 % confidence level for two sides of normal distribution, this is 1.96
Z β = the power on 80%, this is 0.84
By considering non-respondents 10%, the total sample size was 347.6 which approximates 348.
Therefore, 174-study participants taken from each of the private and public health facility wings
In the case of the qualitative study, three study participants were taken from the public health center and 5 study participants were taken from private health institution
The total number of study participants for both studies (qualitative and quantitative) was 356.
Sampling procedure and sampling technique
There are four health facilities, which give service in Mizan Aman town, from those three, are private health facilities and one public health facility. To take a sample the health facilities were stratified into two strata (private and public health facilities). Then from three private health facilities, (two were selected by simple random sampling methods). Since there is only one public health facilities gives service in the area it was purposely included in the study. Next, the sample size is equally stratified into two wings that are 1:1 ratio for private and public health facilities. For private health facilities, probability proportionate to sample size (PPSs) allocation is used to allocate the calculated sample size to selected health facilities in each stratum. Finally, the study participants were selected using a systematic random sampling method. From each stratum of private health, facilities the individual study participants were selected with systematic random sampling methods with a k interval of 11th position. All study participants with every 11th position were included in the sample whereas, in public health facilities, every k interval of the 10th position was included in the sample (Figure 1). For qualitative data, the 3-health professionals have selected from public health facilities the rest of the 5 study participants were selected from private health facilities. Purposive sampling methods were used to select individual study participants for qualitative study.

Figure 1: Schematic representation of sampling procedure.
Operational definition terms
✓ The patient is an individual who deviates from or restricts physical activity and psychological wellness.
✓ SERVQUAL: a service quality measurement instrument proposed by Parasuraman (1985) [26].
✓ SERVPEF: directly measure customers’ perception of service performance that assume respondent automatically compare their perception of service quality level with their expectation of that service [27].
✓ OPD is one part of the functional unit in the health department in which individuals with health problems acquire health services.Patients who have gotten health services from OPD should be ambulatory and not stay in the health center overnight.
✓ Satisfaction the term ‘satisfaction’ refers to the simple feeling/ state of the patient who has gotten treatment at OPD.
✓ Patient satisfaction level was measured through a Likert scale that strongly disagrees, dis agree neutral, agree, and strongly agree (34)
✓ Public health facilities- health facilities established primarily to give service to the public
✓ Private health facilities are health organizations, which primarily established for profit [28].
Method of data analysis & presentation
The collected data were edited, coded, and enter into Epi data version 4.4.2 and then export to SPSS version 20 for windows program for analysis. Data was exploring analysis carried out to check the levels of missing values, multi-collinearity, and parallel line test. Cross tabulation and frequency tables were used to report the descriptive data. Independent sample Mann- Whitney U test was used to test whether the observed difference in patient satisfaction between private and public health facility wings was significant or not. Bi-variable ordinal regression model done to identify candidate independent predictors from a given model, variables having a P-value ≤0.25 during bi-variable ordinal regression analysis entered into the multi-variable ordinal regression analysis model. Association was summarized by using log odd value, statistical significance was declared at 95% CI, power 80%, and P-value <0.05. For the qualitative part, audio records were transcribed and translated into English. Finally, quotes from participants’ expressions that exemplify key concepts are triangulated with quantitative results in analysis and interpretation.
Results
Socio-demographic characteristics and quality of health service-related factors
From 348 quantitative studies, participants, included in study 174, were from public health facilities and 174 from private health facility wings. About 60 percent of respondents were female in public health facilities whereas 90(51.3%) of respondents were female in private health facilities. Nearly one-third of the sample in public health facilities came from urban areas but in the case of private health facilities 107(61.5%) were comes from urban areas the rest of the respondents came from rural areas. Only 16(9.2 %) of individuals from total respondents in private health facilities attended university and above. However, in the case of public health facilities 28(16.1%) attended university, and the rest of the respondents does not attend university. More than half of the study participants 96 (52.2%) belonged to Bench in ethnicities in private health facilities but in the case of public health facilities about 73 (42%) were Bench in ethnicities. (Table 1)
| Public OPD | Private OPD | ||||
|---|---|---|---|---|---|
| Variables | Categories | Frequency | Percent (%) | Frequency | Percent (%) |
| Sex | Male | 99 | 56.9 | 90 | 51.3 |
| Female | 75 | 47.1 | 84 | 49.7 | |
| Educational status | Illiterate | 20 | 11.5 | 22 | 12.6 |
| able to read and write | 30 | 17.2 | 29 | 16.7 | |
| attend primary education | 38 | 21.8 | 37 | 21.3 | |
| attend secondary school and above | 58 | 33.3 | 70 | 40.2 | |
| university and above | 28 | 16.1 | 16 | 9.2 | |
| Ethnicity of respondent | Bech | 73 | 42 | 96 | 55.2 |
| Skeko | 20 | 11.5 | 16 | 9.2 | |
| Keffa | 42 | 24.1 | 43 | 24.7 | |
| Amhara | 18 | 10.3 | 2 | 1.1 | |
| Oromo | 16 | 9.2 | 14 | 8 | |
| Others | 5 | 2.9 | 3 | 1.7 | |
| Religion | Orthodox | 48 | 27.6 | 38 | 21.3 |
| Muslim | 33 | 19 | 29 | 16.7 | |
| Protestant | 82 | 47.1 | 99 | 56.9 | |
| Catholic | 10 | 5.7 | 3 | 1.7 | |
| Others | 1 | 0.6 | 5 | 2.9 | |
| Occupation | Farmer | 35 | 20.1 | 37 | 21.3 |
| Merchant | 39 | 22.4 | 34 | 19.5 | |
| employed | 63 | 36.2 | 71 | 40.8 | |
| Student | 23 | 13.2 | 19 | 10.9 | |
| house wife | 14 | 8 | 13 | 7.5 | |
| Marital status | Single | 62 | 35.6 | 44 | |
| Married | 107 | 61.5 | 116 | 25.3 | |
| Widow/widowed | 2 | 1.1 | 66.7 | ||
| Separated | 1 | 0.1 | 3 | 1.7 | |
| Divorced | 2 | 1.1 | 6 | 3.4 | |
| Residence | Urban | 118 | 67.8 | 107 | 61.5 |
| Rurar | 56 | 32.2 | 67 | 38.5 | |
Table 1: Socio-demographic characteristics of outpatient’s level of satisfaction in Mizan Aman town southwest Ethiopia, 2021.
Independent sample Mann-Whitney U test for perceived quality of service between private and public health facilities
As the collected data was not normally distributed, to compare the perceived quality of service between two groups that are private and public health facilities, a non-parametric test was preferable. The comparison group was two independent groups so an independent sample Mann-Whitney U test was used in the analysis. According to this test, from five dimensions (tangibility, reliability, empathy, assurance, and responsiveness), there is a significant difference in assurance and responsiveness difference between private and public health facility wings with p- values 0.035 and 0.021 respectively ( Table 2).
| Null hypothesis | Perceived quality measurement items | type of test | P value | Decision |
|---|---|---|---|---|
| The distribution of quality dimensions are the same across categories of private and public health facility wings | Tangibility | Independent sample Mann- Whitney U test | 0.391 | Fail to reject null hypothesis |
| Reliability | 0.85 | Fail to reject null hypothesis | ||
| Empathy | 0.7 | Fail to reject null hypothesis | ||
| Assurance | 0.035 | Reject to reject null hypothesis | ||
| Responsiveness | 0.021 | Reject to reject null hypothesis |
Table 2: Independent sample Mann-Whitney U test for quality dimensions difference at private and public health facilities in Mizan Aman town southwest Ethiopia, 2021.
Level of satisfaction in different components of outpatient health care service
About half of the study participants 32(18.4%) were very satisfied with the information delivered by the health care providers whereas, in the private health facilities wing, 45(25.9%) study participants were very satisfied with the information delivered by the health care provider. More than half of the study participants 89 (51.1%) from private health facilities were just satisfied by the time spent with health care providers whereas 81(46.6%) responders from public health facilities became satisfied with the time spent with health care providers. About 35(20.1%) of individual study participants from the private health facility wing were very satisfied with the communication skill of health care providers. However, in the case of the public health facility wing, 30 (17.2%) were very satisfied with the communication skill of health care providers. As shown in (Tables 3 and 4).
| Perceived client response at private OPD | |||||
|---|---|---|---|---|---|
| Items | VD | Dissatisfied | Neutral | Satisfied | VS |
| No (%) | No (%) | No (%) | No (%) | No (%) | |
| How satisfied are you by distance to health service | 13 (7.5%) | 22(12.6%) | 37(21.3%) | 55(31.6%) | 47(27%) |
| How satisfied are you on the information deliver by provider | 9(5.2%) | 34(19.5%) | 26(14.9%) | 73(42%) | 32(18.4%) |
| How satisfied are you by time spent until seen by health profession | 16(9.2%) | 51(29.3%) | 19(10.9%) | 65(37.4%) | 23(32.2%) |
| How satisfied are you by respect and coursity | 8(4%) | 32(19%) | 18(10.3%) | 86(49.4%) | 30(17.2%) |
| How satisfied are you by the time spent with care provider | 6(3.4%) | 32(18.4%) | 31(17.8%) | 81(46.6%) | 24(17.8%) |
| How satisfied are you privacy drying treatment | 9(5.2%) | 37(21.3%) | 17(9.8%) | 81(46.6%) | 30(17.2%) |
| How satisfied are you by cleanness of opd | 16(9.2%) | 39(22.4%) | 24(13.6%) | 61(35.1%) | 34(19.5%) |
| How satisfied are you by communication skill of provider | 21(12.1%) | 32(18.4%) | 32(18.4%) | 59(33.9%) | 30(17.2%) |
| How satisfied are you by availability of drug supply | 44(25.2%) | 37(21.3%) | 6(3.4%) | 41(23.6%) | 46(26.4%) |
| How satisfied are you cleanness of toilet | 32(18.4%) | 36(20.7%) | 18(10.3%) | 51(29.3%) | 37(21.3%) |
| how much are you satisfied by cost paid | 27(15.5%) | 56(32.2%) | 14(8%) | 44(25.3%) | 33(19%) |
| How satisfied are you information about treatment | 8(4.6%) | 17(9.8%) | 31(17.8%) | 84(48.3%) | 34(19.9%) |
| How satisfied are you by the wellness of provider to respect your request | 2(1.1%) | 23(13.2%) | 25(14.4%) | 94(54%) | 30(17.2%) |
VD= very dissatisfied, SV = very satisfied
Table 3: Outpatient’s level satisfaction at public health facilities with different components in Mizan Aman town south west Ethiopia, 2021.
| Perceived client response at private OPD | |||||
|---|---|---|---|---|---|
| Items | VD | Dissatisfied | Neutral No (%) | Satisfie No (%) | VS |
| No (%) | No (%) | No (%) | |||
| How satisfied are you by distance to health service | 12 (6.9%) | 42(24.1%) | 23(13.2%) | 68(39.1%) | 29(16.7%) |
| How satisfied are you on the information deliver by provider | 6(3.4%) | 33(19%) | 30(17.2%) | 85(48.9%) | 20(11.5%) |
| How satisfied are you by time spent until seen by health profession | 11(6.3%) | 45(25.9%) | 16(9.2) | 85(48.9%) | 17(9.8%) |
| How satisfied are you by respect and coursity | 5(2.9%) | 23(13.2%) | 22(12.6%) | 75(43.1%) | 49(28.2%) |
| How satisfied are you by the time spent with care provider | 4(2.3%) | 22(12.5%) | 39(22.4%) | 74(42.5%) | 35(20.1) |
| How satisfied are you privacy during treatment | 6)3.4%( | 19(10.9%) | 33(19%) | 89(51.1%) | 27(15.5%) |
| How satisfied are you by cleanness of opd | 10(5.7%) | 32(18.4%) | 31(17.8) | 76(43.7%) | 25(14.4%) |
| How satisfied are you by communication skill of provider | 13(7.5%) | 18(10.3%) | 25(14.4%) | 83(47.7%) | 35(20.1%) |
| How satisfied are you by availability of drug supply | 24(13.8%) | 20(11.5%) | 24(13.8%) | 65(37.4%) | 41(23.6%) |
| How satisfied are you cleanness of toilet | 24(13.8%) | 43(24.7%) | 22(12.6%) | 58(33.3%) | 27(15.5%) |
| how much are you satisfied by cost paid | 23(13.2%) | 37(21.3%) | 25(14.4%) | 42(24.1%) | 47(27%) |
| How satisfied are you information about treatment | 4(2.3%) | 12(6.9%) | 29(16.7%) | 84(48.3%) | 45(25.9%) |
| How satisfied are you by the wellness of provider to respect your request | 15(8.5%) | 14(8%) | 91(52.3%) | 54(31%) | - |
Table 4: Outpatient’s level satisfaction at private health facilities with different components in Mizan Aman town south west Ethiopia, 2021.
Overall satisfaction with private and public health facility wings
Of the 174 individuals who attend public health facilities 9(5.2%) 37(21.3%) 6(3.4%) 91 (52.3), and 31(17.8%) were very dissatisfied, dissatisfied, neutral, satisfied, and very satisfied respectively (Figure 2). However, in private health facilities wings 1(0.6%) 24(13.8%) 2(1.1%) 107 (61.5), and 23 (23%) were very dissatisfied, dissatisfied, neutral, satisfied, and very satisfied respectively (Figure 3). From the output of descriptive statistics, there is a clear level of satisfaction difference between private and public health facilities but to know whether the numerical difference is statistically significant or not we were going to do the Mann-Whitney U test in the next section.

Figure 2: Overall patients’ level of satisfaction at public health facilities in Mizan Aman town: 2021.

Figure 3: Overall patients’ level of satisfaction at private health facilities in Mizan Aman town: 2021.
Independent sample Mann-Whitney U test of the level of satisfaction difference among private and public health facilities
As the collected data is not normally distributed, to compare the level of satisfaction between difference two groups that are private and public health facilities non-parametric test is preferable. The comparison group is two independent groups so an independent sample Mann-Whitney U test was used in the analysis. According to this test, there is a significant level of satisfaction among private and public health facility wings with a p-value less than 0.0013. (Table 5)
| Null hypothesis | Test type | Type of Health facilities | Rank | P value | Decision |
|---|---|---|---|---|---|
| The is the same LS categories of public and private health facilities | Independent sample Mann- Whitney U test | Private | 187.96 | ||
| 0.013 | Reject the null hypothesis | ||||
| Public | 161.04 |
Table 5: Independent sample Mann-Whitney U test for level of satisfaction at private and public health facilities in Mizan Aman town southwest Ethiopia, 2021.
Factors associated with patient’s level of satisfaction in private and public health facilities
Bi-variable ordinal logistic regression (one predictor variable with the outcome variable) was running and all predictor variables that had a p-value less than 0.25 were included in multi-variable ordinal logistic regression. The following independent variables in a private health facility were candidates for the final model in the multi-variable ordinal logistic regression analysis. Those were of the respondent, marital status, tangibility, reliability, empathy, assurance, and responsiveness. In the case of public health facilities, the following independent variables in a private health facility were candidates for the final model in the multi-variable ordinal logistic regression analysis. Those were sex, educational status of respondents, marital status, reliability, assurance empathy, and responsiveness.
Multi-variable original logistic regression model showing predictor of level satisfaction in the public health facility
According to multivariable ordinal logistic regression analysis, the model outcomes the following predictor variables statistically associated with the patient’s level of satisfaction. Those were becoming male, tangibility, assurance and statistically associated with patient’s level of satisfaction
The ordered logit for “males” being in a higher dependent variable category (i.e. satisfaction level score > 4) is 1.36 less than “females” when the other variables in the model are held constant [p = 0,002, 95%CI (-2.23- -0.50)]. This quantitative result was supported by a key informant interview conducted on a 33years old health male system and health professionals keep professional ethics like wearing a white coat this makes the patient more satisfied”
A one-unit increase in the “assurance score in giving service for a client” would result in a 1.34 unit increase in the ordered log odds of being in a “satisfaction score > 4” category while the other variables in the model are held constant. Which is statistically significant at [p < 0, 001, 95%CI (0.62- 2.07)]. This quantitative result was supported by a key informant interview conducted on 28 years old female health professional from public health facility reply “the behavior of individuals who works here…have excellent behavior that increases the happiness and satisfaction our clients….employee work here have good experience and reply any ambiguity and questions that raised by patients.”
A one-unit increase in “responsiveness score in giving service for the client” would result in a 1.12-unit increase in the ordered log odds of being in a “satisfaction score > 4” category while the other variables in the model are held constant. Which is statistically significant at [p < 0, 001, 95%CI (0.52- 1.91)]. This quantitative result was supported by a key informant interview conducted on 32 years old male healthcare provider who works at public health facility said that “here we are giving very fast service for individuals. Here all health professionals are eager to assist the patient with respect and provide quick service to satisfy most patients (Table 6).
| Variables | Estimate | Standard error | 95%CI | p-value | |
|---|---|---|---|---|---|
| Threshold | [satisfaction=1] | 1.65 | 1.94 | -2.16, 5.47 | 0.39 |
| [satisfaction=2] | 6.22 | 2.07 | 2.17, 10.28 | 0.003 | |
| [satisfaction=3] | 6.67 | 2.08 | 2.59, 10.74 | 0.001 | |
| [satisfaction=4] | 11.69 | 2.26 | 7.26, 16.13 | <0.0001 | |
| -1.36 | 0.44 | -2.23, -0.50 | 0.002** | ||
| Sex | Male | ||||
| Female | 0 | ||||
| Level of education | Illiterate | -0.99 | 0.85 | -2.65, 0.68 | 0.25 |
| Able to read and write | -2.48 | 0.84 | -4.13, -0.82 | 0.703 | |
| attend primary education | -2.09 | 0.8 | -3.65, -0.53 | ||
| 0.509 | |||||
| attend secondary school and above | -2.17 | 0.74 | -3.61, -0.72 | 0.903 | |
| university and above | 0 | ||||
| Marital status | Single | -0.89 | 1.07 | -2.99, 1.21 | 0.41 |
| Married | -1.53 | 1.03 | -3.55, 0.49 | 0.14 | |
| Widow/widowed | -4.2 | 1.59 | -7.32, -1.08 | 0.408 | |
| Separated | -8.68 | 2.7 | -13.98, -3.38 | 0.201 | |
| Divorced | 0a | ||||
| Reliability | 0.12 | 0.43 | -0.72,0.97 | 0.77 | |
| Assurance | 1.34 | 0.37 | 0.62, 2.07 | <0.001** | |
| Empathy | -0.13 | 0.43 | -0.89, 0.72 | 0.75 | |
| Responsiveness | 1.12 | 0.36 | 0.52, 1.91 | <=0.0001** | |
| Tangibility | 0.62 | 0.27 | 0.077,1.15 | 0.003** | |
| 1a |
Table 6: Multi-variable ordinal logistic regression models for predicted level of satisfaction at public health facility in Mizan Aman town Southwest Ethiopia, 2021.
Multi-variable original logistic regression model showing predictor of level satisfaction in the private health facility
In private health facilities, predictor variables such as empathy and tangibility were statistically significant in association with outpatient department patients’ level of satisfaction.
A one-unit increase in the “tangibility score in giving service for the client” would result in a 0.95 unit increase in the ordered log odds of being in a “satisfaction score > 4” category while the other variables in the model are held constant. Which is statistically significant at [p = 0, 013, 95%CI (0.201- 1.69)]. This quantitative result was supported by a key informant interview conducted on 40 years old male health care provider who works at a private health facility reply that “here we have technologies like ultrasound and different laboratory regent and we use electronic reporting system. Due to the above reason, patients become happy with this technology” A one-unit increase in “empathy score in giving service for the client” would result in a 2.78 unit increase in the ordered log-odds of being in a “satisfaction score > 4” category while the other variables in the model are held constant. Which is statistically significant at [p < 0.001, 95%CI (1.73- 3.8)]. This quantitative result was supported by a key informant interview conducted on 36 years old female healthcare provider who works at a private health facility said, “We treat our patient like a king and try to understand their feeling and give compressive service due to this all patent come to me always go with a smile” (Table 7).
| Variables | Estimate | Standard error | 95%CI | p-value | |
|---|---|---|---|---|---|
| Threshold | [satisfaction=1] | 2.75 | 2.47 | -2.1, 7.59 | 0.267 |
| [satisfaction=2] | 7.31 | 2.28 | 2.84, 11.77 | 0.001 | |
| [satisfaction=3] | 7.47 | 2.28 | 3.00, 11.93 | 0.001 | |
| [satisfaction=4] | 12.6 | 2.51 | 7.69, 17.51 | <0.0001 | |
| Marital status | Single | 0.14 | 1.74 | -3.27, 3.55 | 0.94 |
| Married | 0.0001 | 1.75 | -3.42, 3.42 | 1 | |
| Widow/widowed | 1.34 | 2.69 | -3.93, 6.60 | 0.62 | |
| Separated | -3.3 | 3.19 | -9.54, 2.95 | 0.3 | |
| Divorced | 0a | . | . | ||
| Tangibility | 0.95 | 0.38 | 0.201, 1.69 | 0.013* | |
| Reliability | -0.23 | 0.39 | -1.00, 0.55 | 0.56 | |
| Assurance | 0.41 | 0.38 | -0.33, 1.141 | 0.28 | |
| Empathy | 2.78 | 0.54 | 1.73, 3.8 | <0.001** | |
| Responsiveness | -0.71 | 0.37 | -1.43, 0.013 | 0.054 | |
| 1a | |||||
| *Shows significant associated variable with dependent variable variables | |||||
| **Shows highly associated variable with dependent variable variables | |||||
Table 7: Multi variable ordinal logistic regression model for predicted level of satisfaction at private health facility in Mizan Aman town Southwest Ethiopia, 2021.
Discussion
Overview of satisfaction level
In the current study of individuals who attended public health facilities the prevalence of level of satisfaction was 9(5.2%) 37(21.3%) 6(3.4%) 91 (52.3), and 31(17.8%) very dissatisfied, dissatisfied, neutral, satisfied and very satisfied respectively. However, in private health facility wings 1 (0.6%) 24(13.8%) 2(1.1%) 107 (61.5), and 23 (23%) were very dissatisfied, dissatisfied, neutral, satisfied, and very satisfied respectively. This indicated that there is a statistically significant difference level of satisfaction between private and public health facility wings with p- a value less than 0.0013. This study aligns with the study done in Addis Ababa [24]. the possible reason for this difference might in private health facilities healthcare providers give big respect for the individual patient to keep them or not go to another health facility this gives customer/patient become more satisfaction with medical service. The expected hypothesis was that level of satisfaction was that there is a significant satisfaction difference between private and public health facilities. Following this, the null hypothesis stated that there is no significant difference in patient’s level satisfaction between private and public health facilities was rejected.
Predictors of the level of satisfaction in the public health facility
The ordered logit for “males” being in a higher dependent variable category (i.e. satisfaction level score > 4,) is 1.36 less than “females” when the other variables in the model are held constant [p = 0,002, 95%CI (-2.23- -0.50)]. This study outcome is aligned with the study done in Addis Ababa with the same title reported that being female was more satisfied than male individual respondents [23]. This quantitative result was supported by a key informant interview conducted on a 33years old health male professional who said that “there are different reason that contributes to males being less satisfied than girls the first reason are males comes in our OPD expect more respect, and service from us the other reason is that male need injectable medication than females. Due to this when we give tablet medication to them, they become unsatisfied and complained about our service delivery system”. The possible reason for this difference might be males are expected more from the treatment service than females. The expected hypothesis was that socio-demographic factors have a significant effect on patientlevel satisfaction at private and public health facilities. Following this, the null hypothesis stating that socio-demographic factors have no significant effect on patient-level satisfaction at private and public health facilities was rejected.
A one-unit increase in the “tangibility score in giving service for the client” would result in a 0.62 unit increase in the ordered log odds of being in a “satisfaction score > 4” category while the other variables in the model are held constant. Which is statistically significant at [p = 0, 003, 95%CI (0.077- 1.15)]. This quantitative result was supported by a key informant interview conducted on a 34-year-old female health provider from public health facility who said, “Currently the health facility uses modern technology such as management information system and health professionals keep professional ethics like wear a white coat this makes the patient more satisfied”
This study is aligned with the study done in Bangladesh [29]. The possible reason for this result might be when the technology, as well as all things, is up-to-date satisfaction of individual become satisfaction level. The expected hypothesis was that quality of health service dimensions significant effect on patient-level satisfaction at private or public health facilities. Following this, the null hypothesis stating that quality of health service dimensions has no significant effect on patient’s level satisfaction at private or public health facilities was rejected.
A one-unit increase in the “assurance score in giving service for a client” would result in a 1.34 unit increase in the ordered log odds of being in a “satisfaction score > 4” category while the other variables in the model are held constant. Which is statistically significant at [p < 0, 001, 95%CI (0.62- 2.07)]. This quantitative result was supported by a key informant interview conducted on 28 years old female health professional from public health facility reply “the behavior of individuals who works here…have excellent behavior that increases the happiness and satisfaction our clients….employee work here have good experience and reply any ambiguity and questions that raised by patients.”
This result is aligning with the study done at St. Mary University at the alert hospital (TADSSE, 2016). The possible reason for this result might be to give service friendly and respect and increase the satisfaction level of individual respondents. The expected hypothesis was that quality of health service dimensions significant effect on patient-level satisfaction at private or public health facilities. Following this, the null hypothesis stating that quality of health service dimensions has no significant effect on patient’s level satisfaction at private or public health facilities was rejected.
A one-unit increase in “responsiveness score in giving service for a client” would result in a 1.12 unit increase in the ordered log-odds of being in a “satisfaction score > 4” category while the other variables in the model are held constant. Which is statistically significant at [p < 0, 001, 95%CI (0.52- 1.91)]. This quantitative result was supported by a key informant interview conducted on 32 years old male healthcare provider who works at public health facility said that “here we are giving very fast service for individuals. Here all health professionals are eager to assist the patient with respect and provide quick service to satisfy most patients. This result is aligning with the study done at St. Mary University at an alert hospital (12). The possible reason for this result might quickly give service increase the patient satisfaction level of individual respondents The expected hypothesis was that the quality of health service dimensions significant effect on patients’ level of satisfaction at private or public health facilities. Following this, the null hypothesis stating that quality of health service dimensions has no significant effect on patient’s level satisfaction at private or public health facilities was rejected.
Predictors of the level of satisfaction in a private health facility
A one-unit increase in the “tangibility score in giving service for the client” would result in a 0.95 unit increase in the ordered log odds of being in a “satisfaction score > 4” category while the other variables in the model are held constant. Which is statistically significant at [p = 0, 013, 95%CI (0.201- 1.69)]. This quantitative result was supported by a key informant interview conducted on 40 years old male health care provider who works at a private health facility reply that “here we have technologies like ultrasound and different laboratory regent and we use electronic reporting system. Due to the above reason, patients become happy with this technology”
This study is aligned with the study done in Addis Ababa alert hospital on the title of perceived quality effect on satisfaction reported that tangibility and satisfaction have direct proportional the possible reason for this outcome might be technological adoption and the use of data information might increase the level of satisfaction (12). The expected hypothesis was that quality of health service dimensions significant effect on patient-level satisfaction at private or public health facilities. Following this, the null hypothesis stating that quality of health service dimensions has no significant effect on patient’s level satisfaction at private or public health facilities was rejected.
A one-unit increase in “empathy score in giving service for a client” would result in a 2.78 unit increase in the ordered log-odds of being in a “satisfaction score > 4” category while the other variables in the model are held constant. Which is statistically significant at [p <0.001, 95%CI (1.73- 3.8)]. This quantitative result was supported by a key informant interview conducted on 36 years old female healthcare provider who works at a private health facility said, “We treat our patient like a king and try to understand their feeling and give compressive service due to this all patent come to me always go with a smile”. This study is align with the study done in Addis Ababa alert hospital on the title of perceived quality effect on satisfaction reported that empathy and satisfaction have direct proportional, the possible r
References
- Conner-Spady BL, Sanmartin C, Johnston GH, McGurran JJ, Kehler M, et al. (2011) The importance of patient expectations as a determinant of satisfaction with waiting times for hip and knee replacement surgery. Health policy 101:245-252.
- Liang LJ, Choi HC, Joppe M 92018) Exploring the relationship between satisfaction, trust and switching intention, repurchase intention in the context of Airbnb. Int J Hosp Manag 69:41-48.
- Hussain K, Jing F, Parveen K (2018) How do foreigners perceive? Exploring foreign diners’ satisfaction with service quality of Chinese restaurants. Asia Pac J Tour Res 23: 613-625.
- Tomic B, Brkic VKS (2019) Customer satisfaction and ISO 9001 improvement requirements in the supply chain. The TQM Journal 2019.
- Brant JM, Fink RM, Thompson C, Li YH, Rassouli M, et al. (2019) Global Survey of the Roles, Satisfaction, and Barriers of Home Health Care Nurses on the Provision of Palliative Care. J Palliat Med 22:945-960.
- Abebe S, Yallew WW (2019) Prevalence of hypertension among adult outpatient clients in hospitals and its associated factors in Addis Ababa, Ethiopia: a hospital based cross-sectional study. BMC research notes12:1-6.
- Zhang H, Wang W, Haggerty J, Schuster T (2020) Predictors of patient satisfaction and outpatient health services in China: evidence from the WHO SAGE survey. Family practice 37:465-472.
- Thapa S, Joshi A (2019) Patients’ satisfaction with quality nursing care at teaching hospital, Chitwan. J Nurs Healthc Res (IOSR-JNHS) 8:71-75.
- Al-Abri R, Al-Balushi A (2014) Patient satisfaction survey as a tool towards quality improvement. Oman Med J 29:3.
- Al-Abri R, Al-Balushi A (2014) Patient Satisfaction Survey as a Tool Towards Quality Improvement. Oman Med J 29:3-7.
- Asamrew N, Endris AA, Tadesse M (2020) Level of Patient Satisfaction with Inpatient Services and Its Determinants: A Study of a Specialized Hospital in Ethiopia. J Environ Public Health 2020.
- Free C, Phillips G, Watson L, Galli L, Felix L, et al. (2013) The effectiveness of mobile-health technologies to improve health care service delivery processes: a systematic review and meta-analysis. PLoS Med 10:e1001363.
- Peters DH, El-Saharty S, Siadat B, Janovsky K, Vujicic M (2009) Improving health service delivery in developing countries: from evidence to action: The World Bank; 2009.
- Ahmed S, Creanga AA, Gillespie DG, Tsui AO (2010) Economic status, education and empowerment: implications for maternal health service utilization in developing countries. PloS one 5:e11190.
- Mohan P (2007) Ethiopia health sector development program.
- Zhang H, Wang W, Haggerty J, Schuster T (2020) Predictors of patient satisfaction and outpatient health services in China: evidence from the WHO SAGE survey. Family practice 37:465-472.
- Yuan H, Ma Q, Cui H, Liu G, Zhao X, et al. (2017) How can synergism of traditional medicines benefit from network pharmacology? Molecules 22:1135.
- Yuan H, Ma Q, Ye L, Piao G (2016) The traditional medicine and modern medicine from natural products. Molecules 21:559.
- Chemir F, Alemseged F, Workneh D (2014) Satisfaction with focused antenatal care service and associated factors among pregnant women attending focused antenatal care at health centers in Jimma town, Jimma zone, South West Ethiopia; a facility based cross-sectional study triangulated with qualitative study. BMC research notes 7:1-8.
- Amdemichael R, Tafa M, Fekadu H (2014) Maternal satisfaction with the delivery services in Assela Hospital, Arsi zone, Oromia region. Gynecol Obstet (Sunnyvale) 4:2161.
- Bekru ET, Cherie A, Anjulo AA (2017) Job satisfaction and determinant factors among midwives working at health facilities in Addis Ababa city, Ethiopia. PloS one 12:e0172397.
- Derebe MM, Shiferaw MB, Ayalew MA (2017) Low satisfaction of clients for the health service provision in West Amhara region, Ethiopia. PLOS one 12:e0179909.
- Tateke T, Woldie M, Ololo S (2012) Determinants of patient satisfaction with outpatient health services at public and private hospitals in Addis Ababa, Ethiopia. Afr J Prim Health Care Fam Med 4:1-11.
- Geberu DM, Biks GA, Gebremedhin T, Mekonnen TH (2019) Factors of patient satisfaction in adult outpatient departments of private wing and regular services in public hospitals of Addis Ababa, Ethiopia: a comparative cross-sectional study. BMC health services research 19:1-13.
- Habtamu A, Kifle Y, Ejigu Y (2017) Client Satisfaction and its Determinants with Anti-Retroviral Therapy (ART) Services in Public Hospitals of West Wollega Zone, Ethiopia: a Cross Sectional Study. Galore Int J Appl Sci Humanit 1:1-16.
- Bojanic DC, Drew Rosen L (1994) Measuring service quality in restaurants: an application of the SERVQUAL instrument. Hosp Res J 18:3-14.
- Han S-S, Son I-s, Gu J-C, Lee S-C (2007) The study on the effect of health care service quality upon customer loyalty: Based upon SERVPERF. J Korean Soc Qual Manag 35:61-72.
- Bapat D (2014) Marketing of Financial Services. August.
- AlShayban DM, Naqvi AA, Islam M, Almaskeen M, Almulla A, et al. (2020) Patient satisfaction and their willingness to pay for a pharmacist counseling session in hospital and community pharmacies in saudi healthcare settings. Front. Pharmacol 11:138.
- Biresaw H, Mulugeta H, Endalamaw A, Yesuf NN, Alemu Y (2021) Patient satisfaction towards health care services provided in Ethiopian health institutions: a systematic review and meta-analysis. Health serv. insights 14:11786329211040689.
Indexed at, Google Scholar, Crossref
Indexed at, Google Scholar, Crossref
Indexed at, Google Scholar, Crossref
Indexed at, Google Scholar, Crossref
Indexed at, Google Scholar, Crossref
Indexed at, Google Scholar, Crossref
Indexed at, Google Scholar, Crossref
Indexed at, Google Scholar, Crossref
Indexed at, Google Scholar, Crossref
Indexed at, Google Scholar, Crossref
Indexed at, Google Scholar, Crossref
Indexed at, Google Scholar, Crossref
Indexed at, Google Scholar, Crossref
Indexed at, Google Scholar, Crossref
Indexed at, Google Scholar, Crossref
Indexed at, Google Scholar, Crossref
Indexed at, Google Scholar, Crossref
Indexed at, Google Scholar, Crossref
Indexed at, Google Scholar, Crossref
Indexed at, Google Scholar, Crossref
Indexed at, Google Scholar, Crossref
Indexed at, Google Scholar, Crossref
Indexed at, Google Scholar, Crossref
Indexed at, Google Scholar, Crossref
Citation: Wondie SG (2023) Outpatient’s Level of Satisfaction at Private andPublic Health Institution in Southwest Ethiopia: Ordinal Logistic Regression ModelSupported with a Qualitative Study. J Nutr Sci Res 8: 206. DOI: 10.4172/snt.1000206
Copyright: © 2023 Wondie SG. This is an open-access article distributed underthe terms of the Creative Commons Attribution License, which permits unrestricteduse, distribution, and reproduction in any medium, provided the original author andsource are credited.
Select your language of interest to view the total content in your interested language
Share This Article
Open Access Journals
Article Tools
Article Usage
- Total views: 3183
- [From(publication date): 0-2023 - Dec 13, 2025]
- Breakdown by view type
- HTML page views: 2752
- PDF downloads: 431