Performance Analysis of Concentrated Photovoltaic with Hybrid Solar Tracking System
Received: 30-Mar-2017 / Accepted Date: 15-May-2017 / Published Date: 22-May-2017 DOI: 10.4172/2576-1463.1000155
Abstract
Solar PV cells convert solar energy directly into the electricity, more over the energy generation rate can improve by incorporating with tracking and concentrating system. By the use of 2-axis tracking system higher improved in efficiency results. Present work shows significant effect of sun tracking system and concentrating system on energy generation capacity of photovoltaic panel. The Peak energy generation from PV collector (with and without 2-axis tracking and concentrating) have been determined in this study, for location 11.2588° N and 75.7804° E Latitude and Longitude (Calicut city Kerala) in the month of March April and May. Design of concentrator was done by considering size of PV cell and concentrating ratio (40), cooling system is incorporate to improve the performance of PV cells. Monthly average daily irradiation on horizontal surface and ambient temperature were measured. The system performance ratio was determined. The system power output was measured with tracking and concentrating system and compared with performance of normal PV cell. Power generated by PV cell with concentrating and tracking system is 112.56% more than power produce by PV cell without concentrating and tracking system.
Keywords: Photovoltaic; Solar; Electricity; Sun
22691Introduction
Solar energy is a very large, inexhaustible source of energy. The power from the sun intercepted by the earth is approximately 1.8 × 10¹¹ MW, which are many thousands of times larger than the present consumption rate on the earth of all commercial energy sources. Thus, in principle, solar energy could supply all the present and future energy needs of the world on a continuous basis. This makes it one of the most promising of the unconventional energy sources. Photovoltaic (PV) is a method of generating electrical power by converting solar radiation into electricity directly using semiconductors that exhibit the photovoltaic effect. Photovoltaic power generation employs solar panels composed of a number of solar cells containing a photovoltaic material. Mainstream materials presently used for photovoltaic include mono-crystalline silicon, polycrystalline silicon, amorphous silicon, cadmium telluride, and copper indium gallium serenade/sulphide. Mono crystalline and polycrystalline solar cell having leading market share with 15%-17% efficiency. PV system is clean and safe for environment with comparison to coal and fossil fuel [1]. Conventional mono crystalline can operate efficiently at lower concentrations (1- 100 sun) without needing active cooling system. Gallium arsenide and multi-junction cells are better used in medium-high concentration systems (100-300 sun, 300 sun and above) [2-4]. Concentrated Photovoltaic (CPV) technology uses optics such as lenses or curved mirrors to concentrate a large amount of sunlight onto a small area of solar photovoltaic (PV) cells to generate electricity. Compared to non-concentrated photovoltaics, CPV systems can save money on the cost of the solar cells, since a smaller area of photovoltaic material is required. Because a smaller PV area is required, CPVs can use the more expensive high-efficiency tandem solar cells. Zhang et al. [5], develops the equations to calculate the monthly extra-terrestrial irradiation, monthly average clearness index, the daily total irradiation, and the direct irradiation. Koussa et al. [6], investigate the effect of different sun tracking mechanisms on the flat plate photovoltaic system. 2 axis tracking system shows higher result compared to 1 axis tracking system on flat plate photovoltaic system. Figure 1 shows the one axis and two axis tracking system [7,8].
Figure 1: Schematic representation of the one- and two-axis sun tracking system.
Maatallah et al. [9], speaks on sun-earth geometric relationships and incidence angle, equation of time, latitude and longitude, solar time and hour angle, zenith, solar altitude, azimuth, surface azimuth and slops angle, information about extra-terrestrial solar radiation and radiation on horizontal surfaces like, global radiation and diffuse radiation. The yearly gain made by a module mounted on a single-axis tracking system relative to a fixed panel installed with the yearly optimal tilt angle. In order to more optimize the solar system exploitation, a dual-axis tracking installation can be used [10-20].
India’s theoretical solar potential is about 5000 T kWh per year (i.e., ~600 TW), far more than its current total consumption [21,22]. Currently solar power is prohibitive due to high initial costs of deployment. However India’s long-term solar potential could be unparalleled in the world because it has the ideal combination of both high solar insolation and a big potential consumer base density [23,24]. With a major section of its citizen still surviving off-grid, many other areas need to connect to the grid system in India. Availability of cheap solar can bring electricity to people, and bypass the need of installation of expensive grid lines. In addition, a major factor influencing a region’s energy intensity is the cost of energy consumed for temperature control. Since cooling load requirements are roughly in phase with the sun’s intensity, cooling from intense solar radiation could make perfect energy-economic sense in the subcontinent, whenever the required technology becomes competitively cheaper.
Design And Fabrication
Design of concentrator
The design of whole system is done by considering the size of PV cell (15 × 15 cm) having power output 2W. Concentrated solar systems use mirrors or lenses to concentrate a large area of sunlight onto a small size PV cell, generates the power which equals to the power produce by large size PV cell. In CPV (concentrated photovoltaic), the concentrated sunlight energy is converted directly to electricity via the photovoltaic effect.
Geometrical method has been employed for designing concentrator. Design of concentrator is based on the dimension of PV panel and concentrating ratio. By using PV cell size and concentration ratio, model of concentrator has been prepared in CATIA [25-34] software and dimension for fabrication is taken from design of concentrator. The focal point distance and depth of concentrator is designed because of the size of PV cell available.
The Figure 2 shows two-dimensional view of concentrating system. Here, solar radiation firstly falls on concentrator, shown in Figure 3 and then it concentrated on PV cell which is placed at the top position, where the solar radiations get collected. PV cell is placed in higher position than the focal length to get uniform solar radiation on all surface of cell. Model of concentrator which is shown in Figure 3, prepared in CATIA software, fabrication is done based on model. The concentration ratio of the concentrator is selected as 40. The concentrator is dish type concentrator. The depth of concentrator has selected on the basis of concentrating ratio.

Figure 2: Side view of concentrating system.

Figure 3: Designed model of concentrator.
Design of tracking system
Sun tracking systems monitor the sun during the day as the sun is continuously moving. It is well known that the electricity generation capacity of a PV panel depends on exposure to solar radiation in which the sun tracking systems plays the major role. Sensor based tracking system and time based tracking system is used for tracking the sun.
Duel axis tracking system is more efficiency as compare to singleaxis tracking system [6]. There is a major drawback of sensor based tracking system considering diffused radiation, where sensor sense the light from all the direction causing motion of system continuously, consuming more input power. To overcome this problem time based tracking system is incorporated, which work track sun more efficiently even in diffused radiation. The tracking is done on the basis of the position of sun. The sun is changing its position every time and we called it as a sun altitude and azimuth angles, tracking is based on the angles of sun.
Solar hour angle is used for tracking of sun throughout the day. The sunrise equation as follows can be used to derive the time of sunrise and sunset for any solar declination and latitude in terms of local solar time when sunrise and sunset actually occur [9]. Figure 3 shows the schematic of angles ω, Φ and δ.
cos ω = − tanφ Χ tan δ (1)
Where,
ω is the hour angle at either sunrise (when negative value is taken) or sunset (when positive value is taken);
Φ is the latitude of the observer on the Earth.
δ is the sun declination.
Solar declination angle is used for tracking the sun throughout the year.
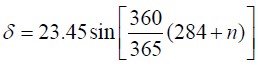 (2)
(2)
Where n is day
Analysis
Estimating solar PV energy generation
The output of PV module is depends on operating ambient temperature, intensity of irradiance and the incident angle of incoming solar radiation. King et al. [24] developed the correlation of this factor with the performance of PV module. The relative efficiency of PV module is a function of module temperature and solar irradiance [25,27-29].
 (3)
(3)
The PV module relative efficiency ηrel , is define as the ratio of average PV module conversion efficiency under actual operating conditions to the conversion efficiency at Standard Operating Condition (STC) [27,29].
 (4)
(4)
Where, αi , βv , C1and C2 are empirical constant depends on PV module technology. For crystalline silicon material αi =1.20 Χ 10-3 ,βv = −4.6 Χ 10-3 C1 = 0.033 and C2 = −0.0092 . T'm is normalized module temperature, Tm is temperature under operating condition, G' is the normalized in plane irradiance, G is irradiance under actual operating condition, GSTC is irradiance at STC.
 (5)
(5)
 (6)
(6)
The temperature value needed for Eqn. 5 is the module temperature, which is not normally known. An approximate relation between module temperature and ambient temperature is given as [30]:
 (7)
(7)
Where, TNOCT is a nominal operating call temperature of PV module? For freestanding modules, this value is normally given as 48°C [30].
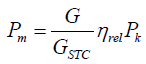
The instantaneous power output of a PV module under actual operating conditions is expressed as:
 (8)
(8)
Where, Pk(kWp) is the PV module’s rated peak power.
4.2 Solar radiation on dual-axis tracking surface
For an hour characterized by an hour angle, ω, the monthly average hourly irradiation on a horizontal surface, ?I (kWh/m2) for the characteristics day of each month was obtained with:
 (9)
(9)
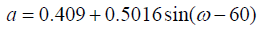
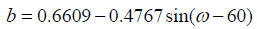
Where, ?H is monthly average daily irradiation on horizontal surface and rt is the ratio of hourly to daily irradiation. rt was gotten with the collares-Pereira and Rabl equations as follow [31,32].
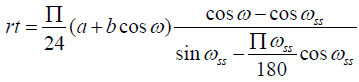 (10)
(10)
Where a and b are given by:
 (11)
(11)
 (12)
(12)
 (13)
(13)
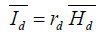
Where, ?Id is the diffuse component of the hourly irradiation on a horizontal surface and ?Hd is the diffuse portion of ?H .
 (14)
(14)
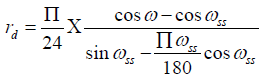
Where, the ratio rd is given by Liu and Jordan [33].
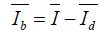
The spectral (beam) component of the hourly irradiation on a horizontal surface ?Ib is related to ?I and ?Id by:
 (15)
(15)
Results And Discussion
Experiment was conducted to measure the voltage, current and temperature of PV cell shown in Figures 4-6. Solar intensity was measured with the help of Pyranometer as, output of PV cell is depends on solar intensity. With the help of concentrating system large amount of solar radiation is concentrating on small size PV cell (concentrating ration is 40), causes rapid increases in temperature of PV cell, reduces the output of cell. Moreover, if the temperature of PV cell is higher than the desire limit cause the reduction in efficiency and life of PV cell. To overcome this problem, cooling system is required. For rapid increase in temperature, continuous water-cooling is used shown in Figure 5. Non-contacting thermometer is used to measured temperature of the PV cell.

Figure 4: Schematic diagram showing earth angles.

Figure 5: Cooling system.

Figure 6: PV cell.
The performance is measured by comparing the output between PV cell in stationary condition and PV cell incorporate with tracking and concentrating systems. Experiments are conducted on 29th, 30th April, and 1st May on PV cell incorporate with tracking and concentrating system and 2nd, 3rd, 4th May 2014 on PV cell when placed stationary, continuously 6 days in the month of April and May, where mostly direct sunlight is available for getting better performance result (Tables 1-6).
| Time (h:min) | Voltage (V) | Current (I) | Tcell (°C) | Tcu plate (°C) | Twater (°C) | Solar flux (W/m2) | Flow Rate (kg/s) | Power (W) |
|---|---|---|---|---|---|---|---|---|
| 9:00 | 0.52 | 2.1 | 35 | 28 | 28 | 471 | 0.14 | 1.1 |
| 9:30 | 0.50 | 2.5 | 64 | 31.6 | 32 | 514 | 0.14 | 1.2 |
| 10:00 | 0.49 | 3.0 | 95 | 33 | 35 | 883 | 0.14 | 1.5 |
| 10:30 | 0.51 | 2.3 | 98.7 | 36.1 | 36 | 761 | 0.14 | 1.2 |
| 11:00 | 0.49 | 2.9 | 101 | 39 | 37 | 944 | 0.14 | 1.4 |
| 11:30 | 0.52 | 2.3 | 45 | 38.5 | 40 | 423 | 0.14 | 1.2 |
| 12:00 | 0.50 | 2.2 | 75 | 39 | 42 | 607 | 0.14 | 1.1 |
| 12:30 | 0.49 | 2.3 | 77 | 38 | 41 | 1019 | 0.14 | 1.1 |
| 13:00 | 0.52 | 2.4 | 83 | 39 | 43 | 893 | 0.14 | 1.2 |
| 13:30 | 0.50 | 1.5 | 45 | 39.2 | 40 | 457 | 0.14 | 0.8 |
| 14:00 | 0.45 | 1.9 | 89 | 40 | 41 | 1026 | 0.14 | 0.9 |
| 14:30 | 0.52 | 2.3 | 73 | 38 | 42 | 953 | 0.14 | 1.2 |
| 15:00 | 0.50 | 1.1 | 53 | 40 | 42 | 398 | 0.14 | 0.6 |
| 15:30 | 0.50 | 1.8 | 49 | 37 | 38 | 413 | 0.14 | 0.9 |
| 16:00 | 0.58 | 0.6 | 40 | 35 | 40 | 340 | 0.14 | 0.3 |
| 16:30 | 0.51 | 2.2 | 75 | 36.5 | 42 | 891 | 0.14 | 1.1 |
| 17:00 | 0.49 | 2.2 | 68 | 39 | 43 | 876 | 0.14 | 1.1 |
Table 1: Experiment conducted on 29th April 2014.
| Time (h:min) | Voltage (V) | Current (I) | Tcell (°C) | Tcu plate (°C) | Twater (°C) | Solar Flux (W/m2) | Flow Rate (kg/s) | Power (W) |
|---|---|---|---|---|---|---|---|---|
| 9:00 | 0.51 | 2.3 | 62 | 35 | 35 | 740 | 0.14 | 1.2 |
| 9:30 | 0.54 | 2.5 | 74 | 36 | 36 | 874 | 0.14 | 1.3 |
| 10:00 | 0.47 | 2.2 | 80 | 36 | 36 | 819 | 0.14 | 1.1 |
| 10:30 | 0.45 | 2.5 | 83 | 38 | 39 | 852 | 0.14 | 1.1 |
| 11:00 | 0.50 | 2.2 | 39 | 37 | 39 | 807 | 0.14 | 1.1 |
| 11:30 | 0.48 | 2.4 | 102 | 39 | 41 | 1075 | 0.14 | 1.1 |
| 12:00 | 0.47 | 2.2 | 103 | 40 | 41 | 980 | 0.14 | 1.1 |
| 12:30 | 0.44 | 1.5 | 83 | 41 | 42 | 457 | 0.14 | 0.6 |
| 13:00 | 0.50 | 0.6 | 40 | 40 | 42 | 328 | 0.14 | 0.3 |
| 13:30 | 0.54 | 2.8 | 41 | 38 | 42 | 930 | 0.14 | 1.5 |
| 14:00 | 0.48 | 2.4 | 80 | 41 | 37 | 1035 | 0.14 | 1.2 |
| 14:30 | 0.47 | 2.2 | 108 | 40 | 41 | 826 | 0.14 | 1.0 |
| 15:00 | 0.45 | 2.1 | 100 | 38 | 42 | 670 | 0.14 | 0.9 |
| 15:30 | 0.50 | 2.4 | 75 | 38 | 41 | 547 | 0.14 | 1.2 |
| 16:00 | 0.49 | 2.2 | 88 | 34 | 39 | 687 | 0.14 | 1.1 |
| 16:30 | 0.47 | 0.4 | 39 | 33 | 38 | 277 | 0.14 | 0.2 |
| 17:00 | 0.45 | 0.2 | 36 | 36 | 37 | 116 | 0.14 | 0.1 |
Table 2: Experiment conducted on 30th April 2014.
| Time (h:min) | Voltage (V) | Current (I) | Tcell (°C) | Tcu plate (°C) | Twater (°C) | Solar Flux (W/m2) | Flow Rate (kg/s) | Power (W) |
|---|---|---|---|---|---|---|---|---|
| 9:00 | 0.6 | 2.0 | 40 | 34 | 34 | 253 | 0.14 | 1.11 |
| 9:30 | 0.5 | 2.1 | 54 | 35 | 35 | 579 | 0.14 | 1.08 |
| 10:00 | 0.4 | 1.6 | 67 | 35 | 36 | 825 | 0.14 | 0.71 |
| 10:30 | 0.4 | 2.1 | 71 | 35 | 36 | 960 | 0.14 | 0.96 |
| 11:00 | 0.4 | 2.4 | 77 | 37 | 38 | 952 | 0.14 | 1.01 |
| 11:30 | 0.5 | 2.0 | 99 | 39 | 39 | 1044 | 0.14 | 0.91 |
| 12:00 | 0.5 | 2.1 | 114 | 43 | 42 | 1172 | 0.14 | 0.97 |
| 12:30 | 0.4 | 1.3 | 95 | 40 | 40 | 385 | 0.14 | 0.56 |
| 13:00 | 0.5 | 2.2 | 102 | 40 | 41 | 1118 | 0.14 | 1.07 |
| 13:30 | 0.5 | 0.8 | 40 | 40 | 42 | 412 | 0.14 | 0.42 |
| 14:00 | 0.5 | 2.4 | 62 | 36 | 41 | 1136 | 0.14 | 1.06 |
| 14:30 | 0.5 | 2.4 | 73 | 37 | 41 | 953 | 0.14 | 1.12 |
| 15:00 | 0.5 | 2.3 | 75 | 38 | 40 | 574 | 0.14 | 1.24 |
| 15:30 | 0.5 | 2.0 | 72 | 38 | 42 | 827 | 0.14 | 1.01 |
| 16:00 | 0.5 | 2.1 | 98 | 38 | 39 | 800 | 0.14 | 0.99 |
| 16:30 | 0.5 | 2.4 | 75 | 38 | 40 | 855 | 0.14 | 1.24 |
| 17:00 | 0.5 | 0.4 | 38 | 38 | 39 | 183 | 0.14 | 0.19 |
Table 3: Experiment conducted on 1st May 2014.
| Time (h:min) | Voltage (V) | Current (I) | Tcell (°C) | Solar flux (W/m2) | Power (W) |
|---|---|---|---|---|---|
| 9:00 | 0.42 | 0.72 | 41 | 919 | 0.3024 |
| 9:30 | 0.417 | 0.93 | 45.5 | 922 | 0.3878 |
| 10:00 | 0.479 | 0.88 | 46 | 952 | 0.4215 |
| 10:30 | 0.481 | 0.99 | 50.2 | 1049 | 0.4761 |
| 11:00 | 0.493 | 1.09 | 50.4 | 1078 | 0.5373 |
| 11:30 | 0.521 | 1.37 | 50.2 | 1106 | 0.7137 |
| 12:00 | 0.484 | 1.11 | 52.8 | 1167 | 0.5372 |
| 12:30 | 0.444 | 1.12 | 54 | 1170 | 0.4972 |
| 13:00 | 0.49 | 1.18 | 49.6 | 1132 | 0.5782 |
| 13:30 | 0.415 | 0.8 | 47.6 | 945 | 0.332 |
| 14:00 | 0.493 | 0.58 | 46.2 | 750 | 0.2859 |
| 14:30 | 0.41 | 0.81 | 49.4 | 948 | 0.3321 |
| 15:00 | 0.49 | 0.68 | 49.1 | 841 | 0.3332 |
| 15:30 | 0.479 | 0.59 | 48.5 | 769 | 0.2826 |
| 16:00 | 0.424 | 1.1 | 47 | 900 | 0.4664 |
| 16:30 | 0.51 | 0.41 | 40.7 | 790 | 0.2091 |
| 17:00 | 0.45 | 0.41 | 36.2 | 810 | 0.1845 |
Table 4: Experiment conducted on 2nd May 2014.
| Time (h:min) | Voltage (V) | Current (I) | Tcell (°C) | Solar flux (W/m2) | Power (W) |
|---|---|---|---|---|---|
| 9:00 | 0.50 | 0.51 | 36.1 | 740 | 0.255 |
| 9:30 | 0.426 | 0.73 | 39 | 921 | 0.31098 |
| 10:00 | 0.441 | 0.81 | 40.2 | 946 | 0.35721 |
| 10:30 | 0.447 | 1.1 | 47 | 1001 | 0.4917 |
| 11:00 | 0.411 | 1.21 | 48.3 | 1097 | 0.49731 |
| 11:30 | 0.512 | 1.24 | 49.1 | 1141 | 0.63488 |
| 12:00 | 0.482 | 1.08 | 50.6 | 1115 | 0.52056 |
| 12:30 | 0.437 | 0.99 | 51.3 | 1178 | 0.43263 |
| 13:00 | 0.484 | 1.02 | 53.6 | 1054 | 0.49368 |
| 13:30 | 0.489 | 0.71 | 50.9 | 740 | 0.34719 |
| 14:00 | 0.481 | 0.73 | 50.2 | 831 | 0.35113 |
| 14:30 | 0.412 | 0.31 | 49.8 | 640 | 0.12772 |
| 15:00 | 0.465 | 0.76 | 47.7 | 935 | 0.3534 |
| 15:30 | 0.390 | 0.64 | 43.8 | 734 | 0.2496 |
| 16:00 | 0.379 | 0.70 | 42.1 | 749 | 0.2653 |
| 16:30 | 0.417 | 0.8 | 42.5 | 810 | 0.3336 |
| 17:00 | 0.372 | 0.49 | 39.9 | 614 | 0.18228 |
Table 5: Experiment conducted on 3rd May 2014.
| Time (h:min) | Voltage (V) | Current (I) | Tcell (°C) | Solar flux (W/m2) | Power (W) |
|---|---|---|---|---|---|
| 9:00 | 0.418 | 0.34 | 32.4 | 534 | 0.14212 |
| 9:30 | 0.48 | 0.64 | 34 | 671 | 0.3072 |
| 10:00 | 0.432 | 0.81 | 36.1 | 920 | 0.34992 |
| 10:30 | 0.461 | 0.94 | 39.6 | 983 | 0.43334 |
| 11:00 | 0.51 | 0.93 | 44.8 | 1009 | 0.4743 |
| 11:30 | 0.498 | 0.83 | 48.1 | 1094 | 0.41334 |
| 12:00 | 0.459 | 1.05 | 50.1 | 961 | 0.48195 |
| 12:30 | 0.483 | 0.79 | 50 | 834 | 0.38157 |
| 13:00 | 0.431 | 0.75 | 49.3 | 764 | 0.32325 |
| 13:30 | 0.501 | 0.64 | 50.9 | 1010 | 0.32064 |
| 14:00 | 0.43 | 0.57 | 50.2 | 934 | 0.2451 |
| 14:30 | 0.476 | 0.24 | 48 | 849 | 0.11424 |
| 15:00 | 0.37 | 0.21 | 46.5 | 764 | 0.0777 |
| 15:30 | 0.314 | 0.22 | 40.3 | 450 | 0.06908 |
| 16:00 | 0.19 | 0.19 | 38.9 | 321 | 0.0361 |
| 16:30 | 0.175 | 0.17 | 36.7 | 347 | 0.02975 |
| 17:00 | 0.187 | 0.13 | 36.3 | 329 | 0.02431 |
Table 6: Experiment conducted on 4th May 2014.
Results, solar PV cell with dual-axis tracking and concentrating condition
On cloudy day, means there is only diffused radiation, sensor based tracking system automatically shifts to time based tracking system which works on hour angle and declination angle (Eqn. 1). The amount of solar irradiation falling on PV cell is constant on time based tracking system considering cloudy day as compare to sensor based tracking system (moving continually due to same intensity of diffuse radiation from all direction). So, output is increased with the help of time based tracking system in when there is only availability of diffuse radiation. As Figure 6 shows that, at 16:00 h, solar irradiation falling on surface is less than 400 W/m2, means there is only diffused radiation, so sensor tracking system automatically shifts to time base tracking system based on hour angle and declination angle, where output Voltage = 0.61 V, Current = 0.64 A and Power = 0.3904 W. Same as in Figure 7, at time 13:00, 16:30, 17:00 h, solar radiation falling on surface is less than 400 W/m2 so sensor tracking system automatically shifts to time base tracking system getting output Voltage = 0.527 V, 0.483 V, 0.458 V, Current = 1.45 A, 0.76 A, 0.27 A and Power = 0.76415 W, 0.36708 W, 0.12366 W respectively.

Figure 7: Power output for solar PV cell with dual-axis tracking and concentrating condition with solar flux on 29th April 2014.
The output of three days as power, depends on incoming solar flux is shown in Figure 7, whenever the solar flux increases, the power output is also increase. However, sometimes it sees that there is decrease in power even with high solar flux due to increases in the temperature of PV cell. For Monocrystaline PV cell, the maximum operating temperature is 60°C. If temperature of PV cell is going higher than 60°C, directly affects the efficiency of PV cell, starts to decrease. On 29th at 14:00 h and on 30th at 11:30 h there is decrease in power due to the higher temperature of PV cell. Output of PV cell is higher when there is a solar flux in the range of 400 W/m2 to 600 W/m2. By the use of concentrator (having concentrating ratio 40), increases the amount of solar irradiation falling of PV cell even if there is low solar irradiation is available on horizontal surface, shows in Figure 6 at 11:30, Figure 7 at 5:30 and in Figure 8 at 15:00 due to the cooling system.
Figure 8: Power output for solar PV cell with dual-axis tracking and concentrating condition with solar flux on 30th April 2014.
Results, solar PV cell without dual-axis tracking and concentrating condition
Figures 9 and 10 shows the power output of PV cell from morning 9:00 h to evening 17:00 h at the interval of every 30 min. The solar flux varies from 200 W/m2 to 1300 W/m2 and power varies from 0.2 W to 0.8 W and from 0.1 W to 0.7 W. respectively

Figure 9: Power output for solar PV cell with dual-axis tracking and concentrating condition with solar flux on 1st May 2014.

Figure 10: Power output of solar PV cell when placed stationary on 2nd May 2014.
Figure 11 shows the power output of PV cell from morning 9:00 h to evening 17:00 h at the interval of every 30 min. The solar flux varies from 200 W/m2 to 1200 W/m2 and power varies from 0 to 0.6 W.

Figure 11: Power output of solar PV cell when placed stationary on 3rd May 2014.
The power output of solar PV cell without concentrating and without tracking system is changing from 0 W to 0.8 W. Solar flux is varying from 200 W/m2 to 1200 W/m2. Maximum power is 0.71 W at 11:30 h on 2nd May 2014 and maximum solar radiation at that time was 1106 W/m2.
Figure 12 shows variation in average power with respect to variation in average solar flux for three days. The value of average solar flux throughout the day is varying from 400 W/m2 to 1100 W/ m2 and the value of average power with respect to average solar flux throughout the day is varying from 0.4 W to 1.2 W.

Figure 12: Power output of solar PV cell when 4th May 2014.
Figure 13 shows variation in average power with respect to variation in average solar flux for three days. The value of average solar flux throughout the day is varying from 500 W/m2 to 1200 W/ m2 and the value of average power with respect to average solar flux throughout the day is varying from 0.1 W to 0.6 W.

Figure 13: Average power output for solar PV cell with dual-axis tracking and concentrating condition with average solar flux for three days.
Comparison of results
From Figure 13 it can be observed that the power generated by PV cell with concentrating and dual axes tracking system is always more than that of without concentrating and without dual axes tracking system. Since the line which showing power of PV cell is not like an ideal line, it is due to the large variation in solar flux throughout the day and the temperature of PV cell. The results show that it is possible to get more power from efficient PV cell with concentrating and tracking system.
As seen above, even with tracking and concentrating system the maximum power output is only 1.2 W, which is very less as compare to its rated power due to:
• Unequal cooling of PV cell.
• High temperature of PV cell, and other losses.
• Heat is not conducting from PV cell to cooling system due to the silicone paste.
Temperature of PV cell is increasing very rapidly but cooling system is not working effectively which directly affects the efficiency of PV cell (Figures 14 and 15).

Figure 14: Average power output of solar PV cell without concentrating and without tracking system from average solar flux for three days.

Figure 15: Comparison of average values of output power with and without concentrator and tracking system.
Conclusion
It is to be noted that all the readings taken during the experiment are instantaneous after and interval of each half hour.
• Tracking is more effective in those hours in which the intensity of solar flux is approximately more than 400 W/m2.
• The current generated by the solar panel is very much dependent on the solar insolation.
• When the temperature of PV cell is increasing immediately, the values of voltage and current are reducing.
• The maximum power by PV cell with concentrating and tracking system is 1.51716 W.
• The maximum power by PV cell without concentrating and tracking system is 0.71377 W.
• The maximum increase in power by PV cell with concentrating and tracking system compared to PV cell without concentrating and tracking system is 112.56%.
References
- Tyagi VV, Rahim NA, Rahim NA, Jeyraj A, Selvaraj L (2013) Progress in solar PV technology: research and achievement. Renew Sustain Energ Rev 20: 443-461.
- Barlev D, Vidu R, Stroeve P (2011) Innovation in concentrated solar power. Solar Energy Materials and Solar Cells 95: 2703-2725.
- Baig H, Heasman KC, Mallick TK (2012) Non-uniform illumination in concentrating solar cells. Renew Sustain Energ Rev 16: 5890-5909.
- Xie WT, Dai YJ, Wang RZ, Sumathy K (2011) Concentrated solar energy applications using Fresnel lenses: A review. Renew Sustain Energ Rev 15: 2588-2606.
- Zhang HL, Baeyens J, Degrève J, Cacères G (2013) Concentrated solar power plants: Review and design methodology. Renew Sustain Energ Rev 22: 466-481.
- Koussa M, Cheknane A, Hadji S, Haddadi M, Noureddine S (2011) Measured and modelled improvement in solar energy yield from flat plate photovoltaic systems utilizing different tracking systems and under a range of environmental conditions. Appl Energ 88: 1756-1771.
- Raman P, Murali J, Sakthivadivel D, Vigneswaran VS (2012) Opportunities and challenges in setting up solar photo voltaic based micro grids for electrification in rural areas of India. Renew Sustain Energ Rev 16: 3320-3325.
- Yeh PY, Yen PC, Yen JY, Wu TT, Liu PL, et al. (2011) Focal point tracking system for concentration solar power collection. Renew Sustain Energ Rev 15: 3029-3033.
- Maatallah T, El Alimi S, Nassrallah SB (2011) Performance modeling and investigation of fixed, single and dual-axis tracking photovoltaic panel in Monastir city, Tunisia. Renew Sustain Energ Rev 15: 4053-4066.
- Coventry JS (2005) Performance of a concentrating photovoltaic/thermal solar collector. Solar Energ 78: 211-222.
- Kribus A, Kaftori D, Mittelman G, Hirshfeld A, Flitsanov Y, et al. (2006) A miniature concentrating photovoltaic and thermal system. Energ Convers Manag 47: 3582-3590.
- Ries H, Gordon JM, Lasken M (1997) High-flux photovoltaic solar concentrators with kaleidoscope-based optical designs. Solar Energ 60: 11-16.
- Kong C, Xu Z, Yao Q (2013) Outdoor performance of a low-concentrated photovoltaic–thermal hybrid system with crystalline silicon solar cells. Appl Energ 112: 618-625.
- https://blogs.wsj.com/indiarealtime/2011/03/09/indias-widening-energy-deficit/
- https://www.wsj.com/articles/SB10001424052748703983704576276253056119700
- https://www.bloomberg.com/news/articles/2011-04-21/indian-power-plants-boost-coal-imports-18-market-watch-says
- http://www.businessgreen.com/bg/news/2124487/onshore-wind-reach-grid-parity-2016
- Robert, Gasch, Jochen, Twele (2005) Windkraftanlagen. In: Grundlagen, Entwurf, Planung und Betrieb. Springer, Wiesbaden, Germany.
- Gipe P (1993) The wind industry's experience with aesthetic criticism. Leonardo 26: 243-248.
- Muneer T, Asif M, Munawwar S (2005) Sustainable production of solar electricity with particular reference to the Indian economy. Renew Sustain Energ Rev 9: 444-473.
- India's theoretical solar potential, Renewing India-Under Heading: Solar Photovoltaic, "Physical Progress (Achievements)". Ministry of New and Renewable Energy, Govt. of India.
- https://www.treehugger.com/renewable-energy/solar-leds-brighten-rural-indias-future.html
- King DL, Kratochvil JA, Boyson WE, Bower WI (1998) Field experience with a new performance characterization procedure for photovoltaic arrays. In: Proceedings of the 2nd World Conference and Exhibition on Photovoltaic Solar Energy Conversion, Vienna, Austria.
- Huld T, Cebecauer T, Šúri M, Dunlop ED (2010) Analysis of one-axis tracking strategies for PV systems in Europe. Progress in Photovoltaics: Research and Applications 18: 183-194.
- Huld T, Súri M, Dunlop ED (2006) A GIS-based system for performance assessment of solar energy systems over large geographical regions. In: Proceeding of Solar 2006 Conference. Am Solar Energ Soc.
- Huld T, Gottschalg R, Beyer HG, Topi? M (2010) Mapping the performance of PV modules, effects of module type and data averaging. Solar Energ 84: 324-338.
- Huld T, Friesen G, Skoczek A, Kenny RP, Sample T, et al. (2011) A power-rating model for crystalline silicon PV modules. Solar Energ Mat Solar Cell 95: 3359-3369.
- Kenny RP, Friesen G, Chianese D, Bernasconi A, Dunlop ED (2015) Energy rating of PV modules: comparison of methods and approach. In: Proceedings of the 3rd World Conference on Photovoltaic Energy Conversion, Osaka, Japan.
- Duffie JA, Beckman WA (1991) Solar engineering of thermal processes (2nd edn.). John Wiley & Sons Inc., NY, USA.
- Collares-Pereira M, Rabl A (1979) The average distribution of solar radiation-correlations between diffuse and hemispherical and between daily and hourly insolation values. Solar Energ 22: 155-164.
- Liu BY, Jordan RC (1960) The interrelationship and characteristic distribution of direct, diffuse and total solar radiation. Solar Energ 4: 1-19.
Citation: Jagtap S, Kumar GK (2017) Performance Analysis of Concentrated Photovoltaic with Hybrid Solar Tracking System. Innov Ener Res 6: 155. DOI: 10.4172/2576-1463.1000155
Copyright: © 2017 Jagtap S, et al. This is an open-access article distributed under the terms of the Creative Commons Attribution License, which permits unrestricted use, distribution, and reproduction in any medium, provided the original author and source are credited.
Select your language of interest to view the total content in your interested language
Share This Article
Recommended Journals
Open Access Journals
Article Tools
Article Usage
- Total views: 4988
- [From(publication date): 0-2017 - Jul 17, 2025]
- Breakdown by view type
- HTML page views: 4040
- PDF downloads: 948