Research Article Open Access
PMMA Platform Based Micro Fluidic Mixer for the Detection of MicroRNA- 18a from Retinoblastoma Serum
Bindu Salim1*, Swapna Merlin David1, Madhu Beta2, Janakiraman Narayanan2, Subramanian Krishnakumar2 and Thalakkotur Lazar Mathew1
1PSG Institute of Advanced Studies, Coimbatore, Tamil Nadu, India
2Vision Research Foundation, Sankara Nethralaya, Chennai, Tamil Nadu, India
- *Corresponding Author:
- Bindu Salim
PSG Institute of Advanced Studies
Coimbatore, Tamil Nadu, India
Tel: +91-9790039955
Fax: +91-422-2573833
E-mail: bbs@psgias.ac.in
Received date: June 12, 2015; Accepted date: July 20, 2015; Published date: July 27, 2015
Citation: Salim B, Merlin David S, Beta M, Narayanan J, Krishnakumar S, et al. (2015) PMMA Platform Based Micro Fluidic Mixer for the Detection of MicroRNA-18a from Retinoblastoma Serum. J Anal Bioanal Tech 6:258. doi: 10.4172/2155-9872.1000258
Copyright: © 2015 Salim B, et al. This is an open-access article distributed under the terms of the Creative Commons Attribution License, which permits unrestricted use, distribution, and reproduction in any medium, provided the original author and source are credited.
Visit for more related articles at Journal of Analytical & Bioanalytical Techniques
Abstract
Retinoblastoma (RB) is an eye cancer found in children. Early diagnosis of RB is very crucial for the treatment to be effective. miRNA 18a is highly expressed in the serum of RB patients which can be used as a diagnostic marker to detect RB. A pillar based micro mixer is designed and fabricated on PMMA platform to hybridize the target miRNA 18a with its complementary quenched probe throughout the flow. The fluorescence can be measured in the monitoring well by the fluorescent reader at a particular wavelength and compared with the controls. The RB serums showed high fluorescence than the controls. The results were validated with the contemporary technique, Real-Time PCR and the results were concurring. Another advantage of the device is that the effort required for the immobilization of the probe on a platform is not needed, at the same time cost and time required for diagnosis is reduced.
Keywords
Biomarker; Fluorescence reader; Hybridization probe; Micro fluidic mixer; MicroRNA; Retinoblastoma
Introduction
Retinoblastoma (RB) is a rapidly developing cancer that originates from the immature cells of a retina, the light-detecting tissue of the eye and is the most common malignant tumor of the eye in children typically before the age of five [1]. Normally, during the early stages of embryonic development, the eyes have cells called retinoblasts that divide into new cells and fill the retina. In some cases, instead of maturing into special cells that detect light, some retinoblasts continue to divide and grow out of control, forming a cancer known as RB. RB1 is a tumor suppressor gene involved in RB which normally regulates cell growth and keeps cells from dividing too rapidly or in an uncontrolled way. Mutations in the RB1 gene are responsible for most cases of RB. In about 1 out of 3 RBs, the abnormality in the RB1 gene is congenital and is in all the cells of the body, including all of the cells of both retinas. In most of these children, there is no family history of this cancer. Only about 25% of the children born with this gene change inherit it from a parent. In about 75% of children the gene change first occurs during early development in the womb. But in 2 out of 3 cases of RB, the abnormality in the RB1 gene develops on its own way and only in one cell of the eye which develops tumor only in one eye.
MicroRNAs (miRNA) are small, noncoding RNA molecules that have a major role in cellular functions. miRNA plays an extensive and important role in gene regulation. Currently, multiple miRNAs have been found abnormally expressed in cancer cells and closely associated with malignant cancer phenotypes [2]. miRNA expression can be associated with a variety of cancer, either functioning as oncogene or tumor suppressor. miR-15a, 16-1,17-5p,143,145, and let-7 were identified as a tumor suppressor while miR-18a,19a-b, 20a,21,92,155, and 372 were known as oncomiRs [3,4]. Indeed, miRNA has showed potential value in cancer diagnosis and therapy. Identification of the specific miRNA biomarkers associated with RB will help to establish new therapeutic approaches to save affected eyes in patients. The miR- 18a, a member of oncogenic miR-17-92 cluster, has been found to over express in the serum of RB patients [5].
Various techniques, such as quantitative real-time PCR (qPCR), sequencing and microarrays [6], allow profiling miRNAs and several successful studies to detect miRNA with high sensitivity have been reported [7-10]. qPCR has an advantage of ultra-sensitive quantification besides microarray allows high-throughput screening. However, detection time, required sample volume, simplicity and portability of these techniques have not yet reached enough maturity for the diagnosis. To meet the desirable requirements, the use of micro fluidic devices, which conveys miRNA molecules to bind with locked nucleic acid (LNA) probe in micro channels, can be an attractive choice because it can reduce the assay time.
Based on this background knowledge, the study was aimed towards the development of highly sensitive and low cost diagnostic tool for detection of oncogenic RB from the serum of RB patients. In this context, we fabricated poly methyl methacrylate (PMMA) micro fluidic device for hybridizing miRNA 18a in the serum with a fluorescent labeled LNA probe specific to miRNA 18a.
Materials and Methods
Design and fabrication of micro mixer on PMMA platform
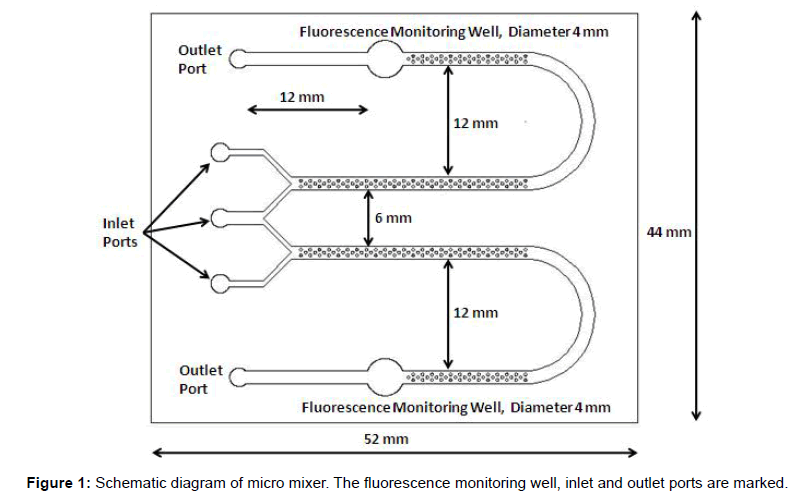
In microfluidic channel, the flow is laminar which does not support mixing. The Reynolds number in these flows is normally 10 and in some cases even 0.1. In a straight channel micromixer, mixing takes place only by diffusion. So a large length is required for mixing so that hybridization efficiency is good. If some features are made in microchannel, it creates the lamelle which enhances mixing and reduces channel length required. A pillar based micromixer is designed as shown in Figure 1 to hybridize the probe with target which is fluorescently labeled. In this design pillars are enhancing the mixing process. The micro mixer was fabricated on poly methyl methacrylate (PMMA) material. The overall dimension of biochip is 52 × 44 mm and holding volume of micro channel, from starting to the outlet port is 25 μl on each side. The micro channels are designed with the pillars of 300 μm diameter. The channel depth was 235 μm with a channel width of 1400 μm and holding volume of 25 μl on control and test inlet wells. The outlet wells of this micro mixer can hold the volume of 25 μl of hybridized sample. The fluorescence monitoring well is designed 12 mm before outlet port. The diameter of it is kept as 4 mm. It is covered from top to keep the fluid level constant to avoid error due to varying depth of fluid level. The distance between two arms of micro channel in each side is kept 12 mm to avoid stray measurement of fluorescence. Further a fluorescent detection system in which the micro device can be incorporated and the fluorescence can be read in the monitoring well at 665 nm was developed. The measured fluorescence is converted into voltage.
Evaluation of PMMA platform for the detection of miRNA- 18a in control/patient serum
The blood samples (5 ml) were collected in the BD® Vacutainer SST tubes from 10 RB patients and 10 age matched controls. All the samples were in the age group of 6 months to 5 years. International Intraocular Retinoblastoma Classification (IIRC) staging and international retinoblastoma classification of these 10 RB samples revealed 8 tumors are in group E and 2 tumors are group E in one eye and group A in other eye; 8 tumors were unilateral and 2 tumors are bilateral. Control blood samples were diagnosed as non-cancerous patients. The blood samples were kept at room temperature for 15 minutes and the serum was separated from the blood by centrifuging at 3000 rpm for 15 minutes. Institutional Human ethical committee clearance (IHEC No. 14/173) was obtained from PSG Institute for Medical Science and Research, Coimbatore for collecting the blood samples and conducting the experiments. Informed consent was obtained from the parents of all the study subjects. The LNATM oligonucleotide 5'/TYE665- CTATCTGCACTAGATGCACCTTA-3'/Dab (Exiqon, Denmark) was used as the complimentary probe for detecting miRNA 18a in the serum.
The concentration of the probe and the time required for the optimum hybridization was standardized. Different concentrations of the probe starting from 0.1 μM to 1 μM were hybridized with control and RB patient serum samples. The minimum concentration at which the distinct fluorescence difference between the control and RB sample observed was selected for further microfluidic experiments. The experiments were carried out at different time intervals from 10 minutes to 30 minutes by changing the flow rates to find out the optimum time for the hybridization.
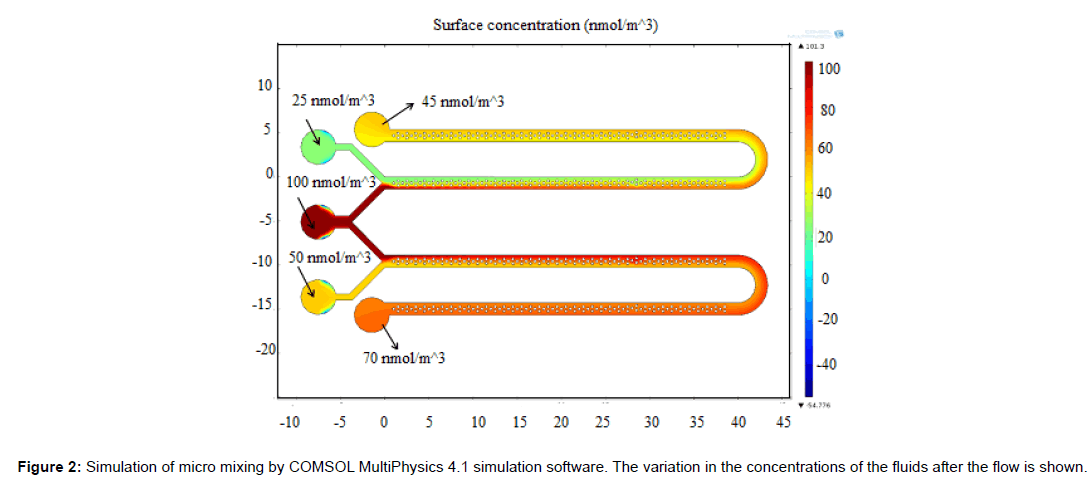
A syringe pump is connected to the middle inlet well (Figure 2) with a 1 ml syringe and a dual syringe pump is connected to the other two inlet wells with 1 ml syringes. 250 μl of LNA probe specific for miRNA 18a with a final concentration of 0.5 μM was pumped simultaneously with 125 μl of the control and patient serum sample. The flow rate for the run was set as 2 μl/min for the probe and 1 μl/min for the serum samples.
Validation of micro fluidics based detection of oncogenic miRNAs in the serum by Real time PCR system
The total miRNA was isolated from the serum samples by miRNeasy® plasma/serum kit (Qiagen, USA) according to manufacturer’s protocol. Initial volume of 200 μl was taken for the isolation. The isolated miRNA was quantified by nano spectrophotometer at 260 nm.
In the reverse transcription (RT) step, cDNA is reverse transcribed from total miRNA samples using a small RNA-specific, stem-loop RT primer from the TaqMan small RNA Assays and reagents from the TaqMan MicroRNA Reverse Transcription Kit (Applied Biosystems, USA). 10 ng of the miRNA was used for the synthesis of cDNA. The reaction parameters were 16°C for 30 min, 42°C for 30 min, and 85°C for 5 min and final hold at 4°C.
After the synthesis of cDNA, real time PCR (RT-PCR) was carried out for analyzing the gene expression of the control and RB samples by using Taqman probes labeled with FAM dye. The TaqMan® MGB probes (Applied Biosystems, USA) contain a reporter dye (FAM dye) linked to the 5'end of the probe, a non-fluorescent quencher (NFQ) at the 3'end of the probe and a minor groove binder (MGB) at the 3'end of the probe. The reaction parameters for the RT-PCR was a hold at 95°C for 10 min and 40 cycles of 95°C for 15 sec and 60ºC for 60 sec. snRNA U6 was used as the internal control.
Statistical analysis
Statistical analysis was done using SPSS 17.0 (SPSS Inc. Released 2008. SPSS Statistics for Windows, Version 17.0. Chicago: SPSS Inc). All data are expressed as the mean ± SD. All values (p<0.05) were considered to be statistically significant.
Results
Design and analysis of micro mixer
In microfluidic channel, the flow is laminar with Reynold’s number less than 10. This flow cannot cause any mixing or surface interaction. In our system, the channel is provided with pillars two in a row followed by one which is repeated as seen in Figure 1. These structures will enhance surface interaction and supports hybridization of miRNA18a with its conjugate quenched probe. Measurements using fluorescence microscope needs more skilled hands and the analysis of the results needs scientific knowledge. Hence we have developed the fluorescence reader for the particular wavelength of 660 nm using a lens assembly to focus the light source from a light emitting diode and photo detector to detect the output fluorescence.
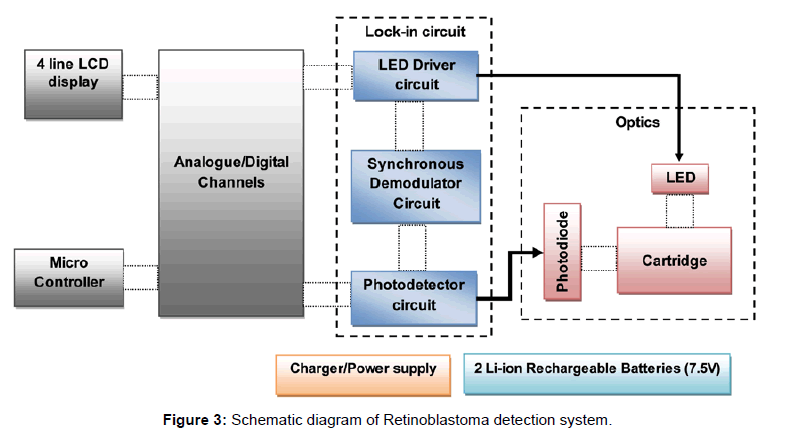
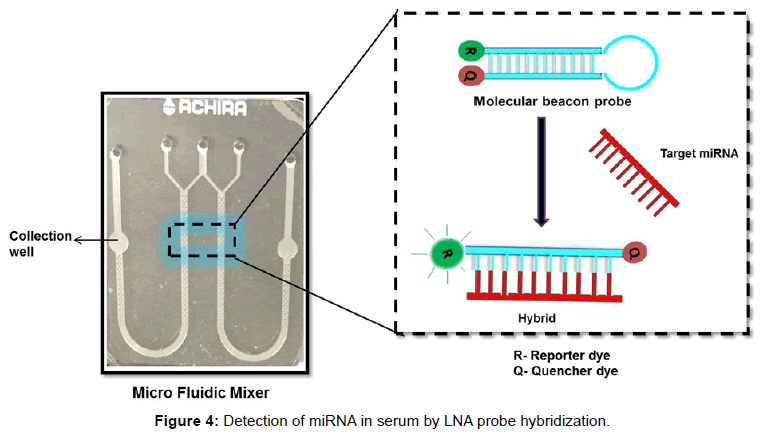
The mixing behavior of micro mixer was studied using COMSOL MultiPhysics 4.1 simulation software. The simulation result is shown in Figure 2. The concentration of fluid in inlet wells were chosen as 25,100 and 50 nmol/m3 which corresponds to green, red and yellow legend colours respectively. Yellow (45 nmol/m3) and orange (70 nmol/m3) colours in outlet port represent complete mixing. The mixing process was gradual and starts when two fluids meets and completes flow till the outlet wells. The schematic diagram of the system developed is as shown in Figure 3 which consists of a microcontroller, analog to digital converter, lens assembly with LED and detector system. This is attached with a LCD to display the voltages from control well and sample well. The biological reaction occurring in the micro fluidic slide is illustrated in Figure 4. The target miRNA in the serum will hybridize with its complementary probe while flowing in the mixer channel which is tagged with a fluorophore, and the final fluorescence can be read by a reader in the collection well.
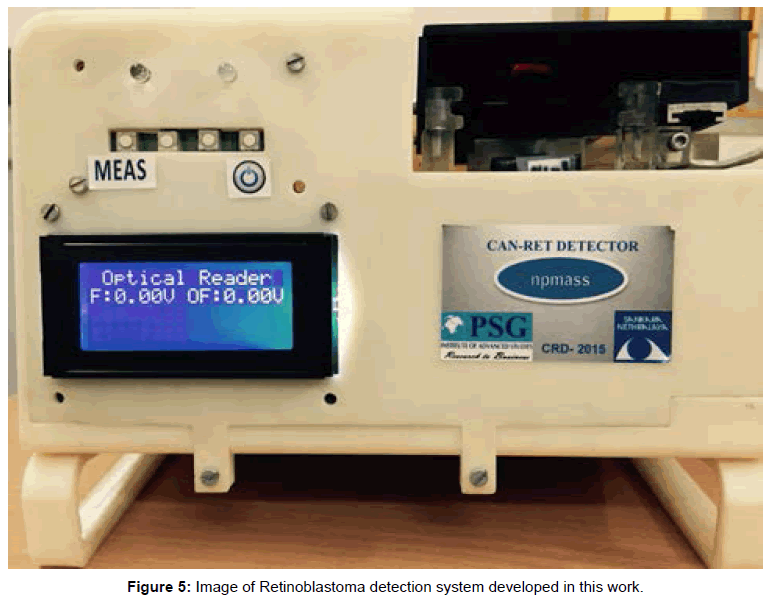
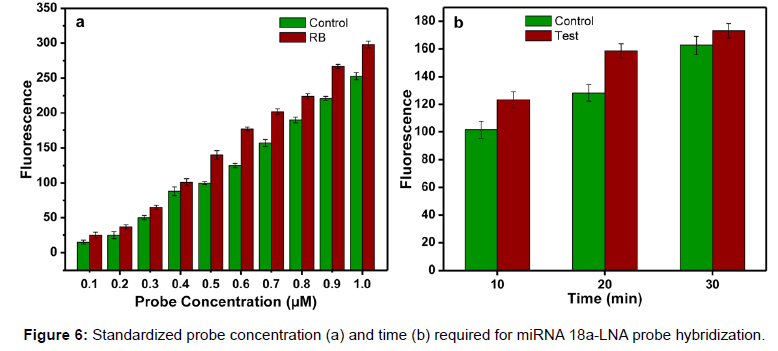
Photograph of the retinoblastoma detector is shown in Figure 5. This system is provided with rechargeable Li Ion battery and a charging circuitry. In this system, slide with sample is fed manually and fluorescence is measured in control well. Further with the help of a lever, the position of the slide is moved to focus the lens assembly on to the well with patient’s sample and the fluorescence is measured. The fluorescence is converted to electrical quantity using photo detector diode. The detector output is converted to digital data and is processed using a microcontroller. Here the back ground fluorescence is calibrated to zero volts by program control. The voltage range assigned is 0 to 5 volts mapping the molar fluorescence varying from 20 a.u to 300 a.u, where the molar concentration chosen is 0.5 μM for the probe which corresponds to a fluorescence of 150 a.u as seen in Figure 6a. The readings were displayed as voltages on the LCD screen for control and sample. This can also be displayed as difference of the control and sample, in the form of screening result positive or negative based on the threshold fixed. The body of the system was developed using 3D printing.
Standardization of probe concentration and time for hybridization
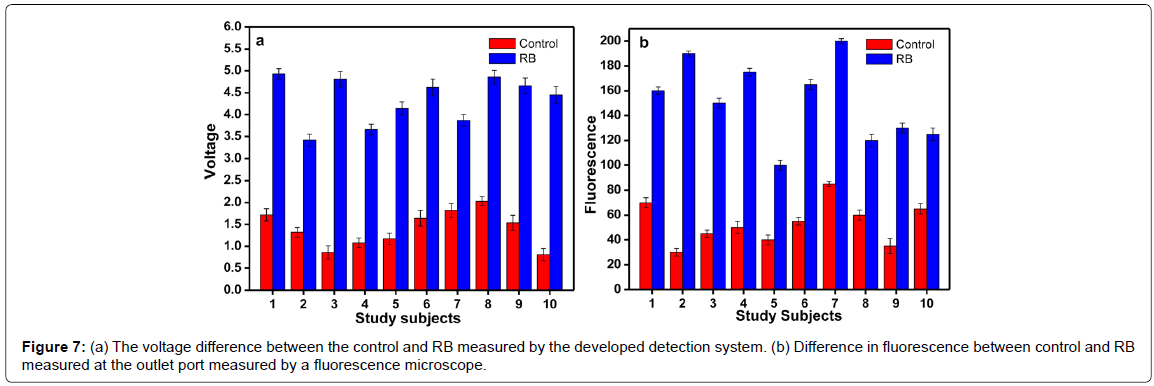
Different concentrations of the probes were hybridized with a constant volume (5 μl) of serum sample. The concentration ranges from 0.1 to 1 μM. The serum samples and probe were allowed to hybridize for 10 minutes. Remarkable difference in fluorescence was observed when the molar concentration is between 0.5 to 0.7 μM. Since 0.5 μM was the minimum concentration for the detection, it was selected for further experiments. Figure 6a shows the fluorescence difference between the control and the RB samples at different probe concentrations. After standardizing the probe concentration, experiments were carried out to find out the optimum time required for the hybridization. The time is very important in the assay because based on the optimum time; the flow rate is fixed in the micro fluidic chamber. Experiments were conducted at different time intervals. At 10 min and 20 min, difference in fluorescence was observed between the control and sample (Figure 6b). Also, the fluorescence difference between the control and the RB samples was measured using the developed detection system and an increased voltage was observed in case of all RB samples. The samples with voltage above 2.5V were considered as RB affected sample (Figure 7a). This system provides better accuracy in fluorescence reading since the measuring chamber is aligned for focused reading whereas while using fluorescence microscope possibility of error due to alignment of slide is high.
Hybridization of miRNA 18a and probe in micro fluidic mixer
Hybridization experiments were carried out with the fabricated device allowing flow of the control serum and the sample serum through the inlet wells at a flow rate at 1 μl/min. The probe was pumped to the probe inlet well at a flow rate of 2 μl/min. The final fluorescence was measured in the fluorescence monitoring well. The fluorescence was also measured at different points of the device to demarcate the fluorescence difference between control and RB. In all the points, an increased fluorescence was observed in the RB samples. The difference in fluorescence between the control and the RB samples are shown in Figure 7b.
Validation of hybridization experiments by real time PCR
The total miRNAs were isolated from the serum samples of the controls and RB patients. cDNA was synthesized from the isolated miRNA for each test and the control using specific primers for miRNA 18a. miRNA that shows constant expression between normal and diseased conditions is used as a reference gene. The cDNA of the reference gene U6 was also synthesized.
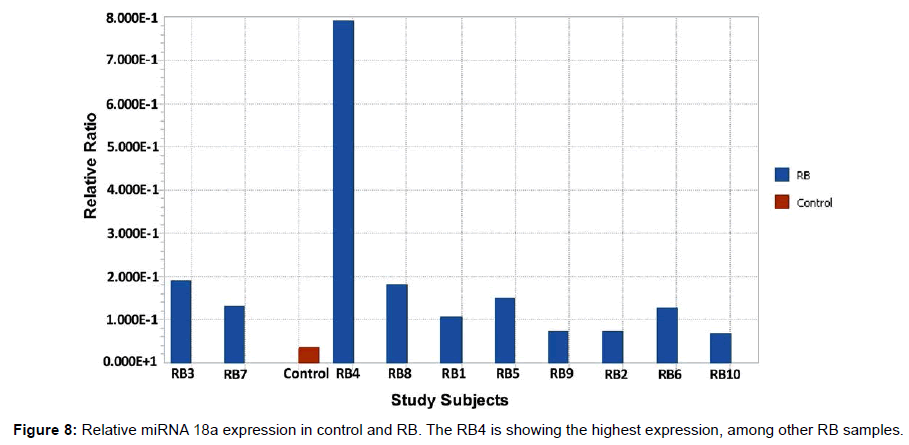
After the synthesis of cDNA, the RT-PCR was carried out with miRNA 18a specific Taqman probe for the control and RB samples. The reaction for U6 miRNA was also run in parallel for control and RB. The purpose of normalization with a reference gene is to remove as much variation as possible between groups except for that difference that is a consequence of the disease state itself. The relative ratio of the miRNA 18a expression in RB samples were compared with the control sample (Figure 8). The RB4 showed the highest expression, among other RB samples. The relative ratio is the normalized expression data of the control and RB with the reference gene. The expression of all the RB samples was higher than the controls and these results agreed with the hybridization results with the mixer (Figure 7a and 7b).
Discussion
Biomarkers have been hailed as the future of medicine, which is progressing towards a greater focus on the diagnosis and prognosis of several diseases and assessing therapeutic response [11]. Micro fluidic devices have been widely applied for the analytical systems due to their fast response, low cost and small amounts of necessary, very expensive chemical bio receptors such as antibodies, aptamers or enzymes [12]. PMMA is a transparent thermoplastic often used as a lightweight or shatter-resistant alternative to glass. The PMMA is an elastomer with little deformation and this property can be used for the construction of micro channels when the rigidity is required. Also, PMMA has a good degree of compatibility with human tissue and its optical transparency is better when compared to other materials. Considering these advantages of PMMA, we used this material for fabricating the micro mixer device.
Reports suggest that mortality rate among the children due to RB is high and the delay in diagnosis increases this rate. miRNAs could be an ideal class of blood-based biomarkers for cancer detection because miRNA expression is frequently dysregulated in cancer and also the expression patterns of miRNAs in human cancer appear to be tissuespecific [13]. The miRNAs regulate the expression of genes by binding and modulating the translation of specific mRNAs. Several published reports have shown that the expression levels of some miRNAs are reduced in chronic lymphocytic leukemia, colonic adenocarcinoma, and Burkitt’s lymphoma samples providing possible links between miRNAs and cancer [14]. Each tumor type can be readily distinguished from the accompanying normal samples based on the expression levels of miRNAs. While each tumor type is characterized by its own unique miRNA profile, it is interesting to note that several miRNAs appear to be up- or down-regulated in almost all tumor samples relative to normal adjacent tissue. Beta et al. [15] studied the miRNA profile of RB sample using in silico methods and found that 21 miRNAs are upregulated and 24 are down regulated in RB.
Presently available diagnostic tools are based on the immobilization of the probe. Although this can be regarded as the most successful micro fluidic platform for lab-on-a-chip applications in terms of the number of commercialized products, the drawbacks of the platform certainly overrides its simplicity. The exact timing of the assay steps depend on variations in viscosity and surface tension of the sample. Other crucial unit operations are metering and incubation, the accuracy of which is limited, and mixing, which cannot be accelerated on the test strip platform. Therefore the precision of the assay result, for example is of the order of 10%, which is not always sufficient for future challenges in the implementation of more complex diagnostic assays [16,17].
The micro fluidic device developed in this study certainly has the potential to become one of the foremost micro fluidic platforms for highly integrated applications. It is a flexible and configurable technology which stands out owing to its suitability for large scale integration. The experiments are conducted using age matching healthy children’s sample as control. As seen in Figure 7a and 7b, the miRNA copy number varies from individual to individual in the control sample. This issue of control being a variable dependent on age and subject, has to be sorted out arriving at a model for the copy number of miRNA and a matching spiked serum can be used as control. However, the ten control samples considered for the experiment resulted in fluorescence less than 80 a.u and corresponding voltages less than 2 Volts whereas the RB patients’ samples resulted in lowest fluorescence level of 100 and voltage of 3.5 Volts. Errors due to alignment problems arising with microscope and the time taken by individual to focus and align are less in case of the reader. The microfluidic channel performs with better efficiency of mixing compared to simple channels where the flow is confined to laminar [18,19].
Conclusion
The micro mixer developed can be used for the detection of different miRNAs by hybridizing with the respective complementary probes. Since it is based on the flow of the serum and probe, the cost, time and effort required for the immobilization is much reduced compared to other diagnostic tools available presently in the market. Screening for retinoblastoma from patients’ serum is also appreciated since the RB victims are infants and sophisticated procedures can be avoided. Hence we strongly suggest that the micro fluidic device designed provides a proficient diagnostic tool in the diagnosis of human pathophysiology.
Acknowledgements
The authors acknowledge NPMASS-ADA, Govt. of India for the financial support to carry out this project. The project was partially supported by Programme support on retinoblastoma BT/01/CEIB/11/V/16. We also thank sincerely Dr. P. Radhakrishnan, Director, PSG Institute of Advanced studies (PSGIAS) for all the support extended to complete this work. Authors sincerely thank Dr. V. Narendran, Chief Medical Officer and Dr. Parag K Shah, Assistant Professor, Aravind Eye Hospital, Coimbatore, India for identifying the RB cases and providing the blood samples. We acknowledge Dr. Sudha Ramalingam, and Dr. Thiagarajan Sairam for their support at PSG Centre for Molecular Medicine and Therapeutics. We also thank PSG Institute of Medical Science and Research for providing ethical clearance for performing the experiments on the samples and providing age matching samples of healthy infants. We also acknowledge the support of Ms. Mamatha M Pillai and Ms. Elakkiya of Nano biotechnology lab, PSGIAS for their support for making fluorescence microscopy measurements.
References
- Dimaras H, Kimani K, Dimba EA, Gronsdahl P, White A, et al. (2012) Retinoblastoma. Lancet 379: 1436-1446.
- Jansson MD, Lund AH (2012) MicroRNA and cancer. Mol Oncol 6: 590-610.
- Lu J, Getz G, Miska EA, Alvarez-Saavedra E, Lamb J, et al. (2005) MicroRNA expression profiles classify human cancers. Nature 435: 834-838.
- Hsu TI, Hsu CH, Lee KH, Lin JT, Chen CS, et al. (2014) MicroRNA-18a is elevated in prostate cancer and promotes tumorigenesis through suppressing STK4 in vitro and in vivo. Oncogenesis 3: e99.
- Tsang WP, Kwok TT (2009) The miR-18a microRNA functions as a potential tumor suppressor by targeting on K-Ras. Carcinogenesis 30: 953-959.
- Baker M (2010) MicroRNA profiling: separating signal from noise. Nat Methods 7: 687-692.
- Nelson PT, Baldwin DA, Scearce LM, Oberholtzer JC, Tobias JW, et al. (2004) Microarray-based, high-throughput gene expression profiling of microRNAs. Nat Methods 1: 155-161.
- Miska EA, Alvarez-Saavedra E, Townsend M, Yoshii A, Sestan N, et al. (2004) Microarray analysis of microRNA expression in the developing mammalian brain. Genome Biol 5: R68.
- Castoldi M, Schmidt S, Benes V, Hentze MW, Muckenthaler MU (2008) miChip: an array-based method for microRNA expression profiling using locked nucleic acid capture probes. Nat Protoc 3: 321-329.
- Zhou WJ, Chen Y, Corn RM (2011) Ultrasensitive microarray detection of short RNA sequences with enzymatically modified nanoparticles and surface plasmon resonance imaging measurements. Anal Chem 83: 3897-3902.
- Rinaldi A (2011) Teaming up for biomarker future. Many problems still hinder the use of biomarkers in clinical practice, but new public-private partnerships could improve the situation. EMBO Rep 12: 500-504.
- Chang HC, Yeo LY (2010) Electro kinetically Driven Microfluidics and Nano fluidics. Cambridge University Press.
- Esquela-Kerscher A, Slack FJ (2006) Oncomirs - microRNAs with a role in cancer. Nat Rev Cancer 6: 259-269.
- Calin GA, Croce CM (2006) MicroRNA signatures in human cancers. Nat Rev Cancer 6: 857-866.
- Beta M, Venkatesan N, Vasudevan M, Vetrivel U, Khetan V, et al. (2013) Identification and Insilico Analysis of Retinoblastoma Serum microRNA Profile and Gene Targets Towards Prediction of Novel Serum Biomarkers. Bioinform Biol Insights 7: 21-34.
- Clark TJ, McPherson PH, Buechler KF (2002) The triage cardiac panel: cardiac markers for the triage system. Point of Care: The Journal of Near-Patient Testing & Technology 1: 42-46.
- Yager P, Edwards T, Fu E, Helton K, Nelson K, et al. (2006) Microfluidic diagnostic technologies for global public health. Nature 442: 412-418.
- Arata H, Komatsu H, Hosokawa K, Maeda M (2012) Rapid and Sensitive MicroRNA Detection with Laminar Flow-Assisted Dendritic Amplification on Power-Free Microfluidic Chip. PLoS ONE 7: e48329.
- Arata H, Komatsu H, Han A, Hosokawa K, Maeda M (2012) Rapid microRNA detection using power-free microfluidic chip: coaxial stacking effect enhances the sandwich hybridization. Analyst 137: 3234-3237.
Relevant Topics
Recommended Journals
Article Tools
Article Usage
- Total views: 16610
- [From(publication date):
August-2015 - Jul 12, 2025] - Breakdown by view type
- HTML page views : 12037
- PDF downloads : 4573

