Polybrominated Diphenyl Ethers (PBDEs) in Goby (Gobius spp.) and Sole (Solea solea) from Thermaikos Gulf, Greece
Received: 27-Feb-2018 / Accepted Date: 15-Mar-2018 / Published Date: 19-Mar-2018
Abstract
Polybrominated diphenyl ether (PBDE) mass fractions were estimated in samples from two benthic species of fish, goby and sole, originating from Thermaikos Gulf in north Greece. The samples were analyzed using a well-established cold extraction method. The average total (Σ PBDE) ranged from 8.98 to 35.00 ng g-1 lipid weight (lw) and 12.36 to 163.26 ng g-1 lw for goby and sole, respectively. Significant differences were observed between samplings but not between the two species. Thermaikos Gulf was classified as low polluted or comparable with regard to similar areas worldwide; however, the notable mass fraction increase in some cases as well as the increasing temporal trend of PBDE levels established for both species signify the need for further monitoring. Congener profiles showed dominance of penta-/octa-BDEs (50-70% from Σ PBDEs) and the presence of deca-BDE as well (18-19%). Congener correlation analysis suggested different pollution sources between higher and lower brominated congeners, as well as different metabolic/degradation processes. Calculations of bioaccumulation factors (BSAF) highlighted the influence of congener bromination degree on the bioaccumulation potential
Keywords: Brominated flame retardants (BFRs); Aquatic ecosystem; Bioaccumulation; Benthic species; Environmental pollution monitoring; Congener profile
Introduction
Polybrominated diphenyl ethers (PBDEs) are compounds widely incorporated in various commercial and household products, such as plastics, construction material, foams, electronic equipment, etc. as brominated flame retardants (BFRs) to minimize the ignition risk of these products or decelerate the burning process [1-3]. PBDEs form a group that consists of 209 congeners and have similar molecular structure to persistent organic pollutants [Polychlorinated biphenyls (PCBs), polychlorinated dibenzodioxins (PCDDs, etc.)] which also suggests an ubiquitous environmental presence in every level of the trophic chain due to their properties such as environmental persistence, lipophilicity (log KOW: 5.9-10), bioaccumulation and resistance to degradation [4]. More recent studies in marine food chain have shown that transfer of PBDEs through the trophic levels is possible [5,6]. Environmental pollution with PBDEs can occur either through direct use and disposal of PBDE commercial products and leaching/volatilization or via other indirect pathways (i.e. air, soil or water transport) [7]. The presence of PBDEs was evident in a variety of aquatic organisms and other environmental markers as well as human bodies [8,9]. Adverse toxicological effects through bioaccumulation/ biomagnification, linked to the immune and reproductive systems have been reported both for humans and wildlife [4,10,11]. Fish and shellfish consumption constitute one of human’s major exposure route [12].
The main PBDE commercial products are penta-, octa- and deca- BDE mixtures (Table 1), produced mainly in North America and Asia. They were widely used during the 90s and consumption has been exceptionally high in the US (>50% of the worldwide PBDE production), especially for penta-BDE mixtures (>95%) [13]. Pentaand octa- BDE were initially banned in Europe [14] and later were classified as Persistent Organic Pollutants (POPs) and banned globally [15]. Commercial attention has shifted to deca-BDE (>80% of global production) [16]. In Europe, the European Court of Justice annulled the Commission Decision on the exemption of deca-BDE from the directive concerning BDE-mixtures. The use of BDE-209 formulation is prohibited in Europe since July 2008 and it was phased out of all electronic applications in the USA at the end of 2013 [17,18].
| Commercial mixture | Commercial mixture synthesisa | Global market in 2001 (metric tons)b | ||||
|---|---|---|---|---|---|---|
| America | Europe | Asia | Rest of the world | Total | ||
| Penta-BDE (Bromkal 70-DE, DE-71) |
38-42% tetra-BDE 45-49% penta-BDE 8-10% hexa-BDE 0-1% tri-BDE |
7100 | 150 | 150 | 100 | 7500 |
| Octa-BDE (Octabrom, DE-79) |
0.5% penta-BDE 12% hexa-BDE 45% hepta-BDE 33% octa-BDE 10% nona-BDE 0.7% deca-BDE |
1500 | 610 | 1.500 | 180 | 3790 |
| Deca-BDE (Saytex 102E, DE-83R) |
0.3-3% nona-BDE 97-99% deca-BDE |
24500 | 7600 | 23000 | 1050 | 56100 |
a: Source: WHO, 1994; ECB, 2001; 2002; 2003; b: Source: BSEF, 2003
Table 1: Global market of PBDEs and their commercial mixture synthesis.
Benthic species of fish exhibit high concentrations of PBDEs in the marine environment, which suggests a significant influence of the abiotic environment to their bioaccumulation mechanisms [19]. Fish usually have high pollution levels amongst aquatic organisms and European levels were found to be considerably lower than those in North America [20]. In the present study PBDE mass fraction levels, congener profile and temporal trends were estimated for two benthic species of fish (Gobius spp. & Solea solea) from Thermaikos gulf. Possible differences in mass fractions between the two species were investigated and pollution levels were compared to worldwide reported data. Bioaccumulation factors estimation was performed to evaluate possible risk to public health from consumption of these two edible species of fish according to the Provisional Tolerable Weekly Intake (PTWI), as established by the European Food Safety Authority (EFSA) for PBDEs [21]. To the authors’ knowledge this is the first set of data reported for PBDEs in fish from the region of Thermaikos gulf.
Materials and methods
Sampling area
Thermaikos Gulf is located at the north-west corner of the Aegean Sea (Figure 1). The sampling area characteristics have been described in detail elsewhere [22]. It is a semi-closed gulf with the only open side to the Aegean Sea at the southern part. Four rivers discharge into the gulf, as well as effluents from two second degree wastewater treatment plants of the city of Thessaloniki (1-1.5 million inhabitants). An industrial zone is located on the northern part of the gulf. On the eastern part, a stream runs not far from the city’s landfill (recently shut down) and discharges into the sea by the airport. Along the western coastline of the gulf there are extensive mussel cultures (Mytilus galloprovincialis).
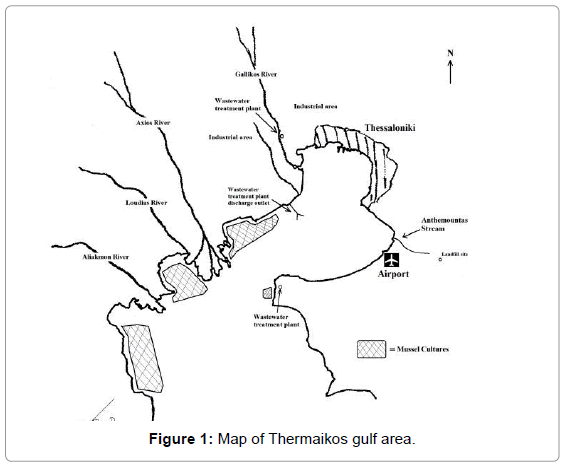
Figure 1: Map of Thermaikos gulf area.
Sample collection
Two species of fish were selected for this study, goby (Class: Actinopterygii, Order: Perdciformes, Family: Gobiidae, Genus: Gobius, Species: Gobius spp.) and sole (Class: Actinopterygii, Order: Pleuronectiformes, Family: Soleidae, Genus: Solea, Species: Solea solea or Common sole). It should be noted that goby includes more than one species that are endemic in the sampling area mostly Gobius bucchichi, Gobius cobitis and Gobius paganellus. Both goby and sole are endemic edible benthic species of fish found in Thermaikos gulf, mainly in sandy or muddy areas. Their diet consists of benthic organisms such as worms, molluscs and crustaceans. Thermaikos bay is a natural spawning area for these two species, maintaining populations in adequate levels. The selection criteria comprised mainly from the benthic characteristics of both species that brings them into direct contact with sediment, possibly polluted with PBDEs, as well as the fact that they are edible, they are found on the market and are consumed by the area population, raising concern for human health implications.
Seasonal sampling took place from Spring 2005 to Spring 2007; thus, nine sampling surveys were conducted in total. The age of the fish analyzed from both species was calculated at 1.5 ± 0.3 years. Their size was corresponding to the commercially available edible size of these species (Sole size range: 20-25 cm, Goby size range: 15-25). Samples - the term “sample” corresponds to a satisfying number of individuals with the proper characteristics - were collected at random by net across the length and width of Thermaikos gulf in collaboration with a local fisherman. For each fish species quadruple seasonal samples were collected for optimal representation of every sampling and more accurate conclusion. In total, 72 fish samples were collected (36 samples of goby and 36 samples of sole) from Thermaikos gulf.
The samples were transported as quickly as practical to the laboratory. For each sample a sufficient number of individuals (5- 10, according to size) were chosen randomly. From each sample only muscle tissue was collected. All muscle tissues were pooled together and homogenized. Samples were placed in amber glass jars and kept in deep freeze (-20°C) prior to analysis. A total of eight fish pool samples were available for analysis for each conducted survey (four for each species).
Chemicals and reagents
Organic solvents and water used in this study were of LC-grade or pesticide-grade, purchased from Merck (Darmstadt, Germany) and Riedel de Haën (Seelze, Germany). All other chemicals were of analytical grade. N2 gas (99.99%) was obtained from Linde Hellas. Silica gel 60 (0.063-0.200 mm) was purchased from Merck and used for chromatography columns. Silica gel was activated by heating overnight, at 250°C, and allowed to cool to room temperature prior to use. Analytical standards were synthesized in house (Department of Environmental Science and Analytical Chemistry, Stockholm University) [23]. The PBDE mix consisted of BDE 17, 28, 47, 66, 71, 85, 99, 100, 138, 153, 154, 183, 190 and 209 (solvent: n-hexane) . Concentration levels ranged from 3.35 to 13.5 ng ml-1. In order to choose the appropriate internal standards, pilot studies were performed to identify congeners not present in the samples. The internal standards used were BDE-77 as surrogate standard and BDE- 138 as injection standard, which were also synthesized in house.
Extraction and analyses
Volatiles content was assessed by drying 3-5 g of fish tissue at 103- 105°C to constant weight and weighing the sample anew.
A cold extraction method was applied according to the Jensen method [24]. In detail, 10 g of homogenized fish tissue were weighed and transferred into a separatory funnel with a sintered glass filter. A solvent mixture (isopropanol 25 ml and diethylether 10 ml) was added and spiked with 50 μl of BDE-77 with a concentration of 2.86 ng ml-1. Homogenization followed (Ultra Turrax, IKA Labortechnik, T25 basic) for 2-3 minutes. The organic phase was transferred with nitrogen pressure through a Wattman filter into a separatory funnel (500 ml), which contained 50 ml of 0.1 M H3PO4 in an aqueous 0.9% NaCl. The fish were re-extracted twice, first with a mixture of 25 ml n-hexane: diethylether (9:1) and 10 ml isopropanol and then with 25 ml n-hexane : diethylether (9:1). The last extraction was performed by sealing the funnel and turning it upside down 30 times, before collecting all organic phases into the separatory funnel (the funnel was not shaken to avoid emulsion formation).
After phase separation, the lower aqueous phase was transferred to a 100 ml beaker. To avoid water presence in the organic extract, the funnel was rotated and any additional water was transferred into the beaker. The organic phase was decanted into another pre-weighed 100 ml beaker. The aqueous phase was returned into the funnel and reextracted with 10-15 ml of n-hexane: diethylether (9:1) as described above. The combined organic phases in the beaker were evaporated in a cupboard overnight at room temperature and reweighed until constant weight to calculate the Extractable Organic Matter (EOM).
Sulphuric acid treatment: The organic extract was dissolved in 6 ml n-hexane (doses of 1-2 ml at a time) and transferred into a centrifugal tube, where it was partitioned with 4 ml of conc. H2SO4, turning the tube upside down 30 times and centrifuged for 5 min at 3000 rpm. The overhead organic phase was transferred into a test tube using a Pasteur pipette. 3 ml of n-hexane were added into the centrifugal tube for re-partitioning as described above. The new overhead organic phase was added to the test tube and volume was decreased with gentle N2 flow to approximately 0.5-1 ml.
Silica gel / Sulphuric acid column: Conc. H2SO4 was mixed with activated silica gel (1:2, w/w) by rotating until no lumps were left. 1 g of this mixture was transferred into a Pasteur pipette, containing silylated glass wool in the bottom. The column was then washed with 5-10 ml of n-hexane. The extract from the sulphuric acid treatment was transferred onto the column, using a Pasteur pipette. 1-2 ml of n-hexane was added into the test tube and after vortex mixing, it was added into the column as well. The compounds were eluted with 10- 15 ml n-hexane and collected into a test tube. Volume was once more decreased with gentle N2 flow to approximately 0.5-1 ml. A second Pasteur pipette column, containing only activated silica gel, was prepared and washed as described above. The extract was transferred to the column as above and eluted with 3-4 ml n-hexane collected as first fraction and 6-7 ml dichloromethane (DCM) as second fraction. The solvent of the second fraction was changed to n-hexane; volume was reduced to 50 μl, spiked with BDE-138 (100 μl, 2.21 ng ml-1, and volumetric standard), sealed in vials and analyzed in GC-MS.
Instrumental analysis
Analysis was performed with gas chromatography/mass spectrometry (GC/MS) utilizing a Finnigan MAT SSQ710 instrument (Thermo Fischer Scientific, San Jose, CA, USA) connected to a Varian 3400 gas chromatograph equipped with a CTC A200S autosampler. The transfer line temperature was set to 290°C, and the ion source temperature was maintained at 200°C. Automated injections of 1 μl were made on a septum-equipped temperature-programmable injector (SPI) fitted with a high-performance insert directly connected to a DB-5 HT capillary column (15 m × 0.25 mm i.d., 0.1 μm film thickness, J&W scientific, Folsom, CA, USA) with helium as the carrier gas, at a head pressure of 5 psi. The GC oven was programmed as follows: 85°C (1 min), 15°C/min to 300°C and then 2°C/min to 320°C (5 min). The injector was temperature-programmed from 85 (0.5 min) to 300°C at 150°C/min (20 min).
The PBDE congeners were analyzed by the negative ions formed by electron capture reaction at chemical ionization (ECNI) in the selected ion monitoring (SIM) mode by scanning for the bromine ion isotopes m/z 79 and m/z 81 and for the perbrominated PBDE-209 only, the fragment ions m/z 484.6 and m/z 486.6 corresponding to [C6Br5O]-.
Methane (5.0, AGA, Stockholm, Sweden) was used as the electron thermalization buffer gas at 5.6 Torr and primary electron energy of 70 eV.
All chromatographic data were collected, analyzed, and quantified using the proprietary ICIS2 software from Thermofinnigan.
Quality assurance/quality control (QA/QC)
An analytical blank was processed for every ten samples under the same conditions and procedure for evaluation of possible contamination in the samples. Blank samples were extracted and analyzed simultaneously to the environmental samples. The correction of sample mass fractions was deemed unnecessary according to blank samples, which presented no significant problems. Sample peaks are reported only if the signal exceeded three times the baseline noise. Limits of detection for individual PBDE congeners (tri- to deca-BDE) ranged from 0.0001 to 0.01 ng g-1 and were calculated as LOD=3x(S/N). All mass fractions are reported on a lipid weight basis (lw). A calibration curve was produced by analysis of PBDE standards solutions at 3 concentration levels ranging from 3.35 to 13.5 ng ml-1, in order to calculate relative response factors of the different congeners. Average recovery for surrogates spiked in samples was at 96% (± 22 SD) for BDE-77.
Statistical analysis
For the statistical analysis and evaluation of the experimental data, both parametric and nonparametric methods were applied. As all forms of parametric tests are based on the assumptions that the within-groups data are samples drawn from normally distributed populations with equal variances, both formal tests and graphical displays were performed for assessing departures from normality, while variances were tested for homogeneity using the Levene’s test. For accessing the assumptions of normality and stability of variances, data were also transformed to loge, log10 or sqrt [25]. One-way analysis of variance was used to evaluate possible significant effects of sampling station on the Σ PBDE, while differences between mean values of specific stations were evaluated using Duncan’s new multiple range tests. Spearman rank correlation was also applied to test associations of various congeners.
All analyses were conducted using the statistical software program SPSS for Windows (v. 15.0). Significance was declared at p ≤ 0.05, unless otherwise noted. Back-transformed mean values are reported in the results.
Results and Discussion
PBDE levels in Thermaikos gulf fish
The analysis of all fish samples collected showed that all PBDE congeners with few exceptions (congeners BDE-17, -66, -71, -85 and -190) were present in every fish sample. Mass fractions were under the limit of detection in some sampling periods.
All PBDE congeners that were detected in goby during each sampling season are presented in Table 2, where mean mass fractions (lw) are recorded in this two year sampling period as well as the contribution of each congener over the sum of all congeners, Σ PBDE (sum of 9 BDE congeners, namely BDE-28, -47, -99, -100, -153, -154, -183, -190 and -209). Mean mass fractions for Σ PBDE in goby ranged from 8.98 to 35.00 ng g-1 lw. The lowest values were recorded in autumn 2005 and the highest during winter 2006 and autumn 2007 (34.66 and 35.00 ng g-1 lw, respectively). The lipid content for goby ranged between 0.7-1.2% with a mean percentage at 0.9%.
Table 3 presents the corresponding data for sole. Σ PBDE mean mass fractions in sole ranged from 12.36 to 163.26 ng g-1 lw. The lowest mass fraction was recorded in summer 2006; the rest of the values were fluctuating around the same levels, except spring 2007 which was slightly elevated (39.53 ng g-1 lw) and winter 2006 that exhibited a striking increase with the highest mass fraction (163.26 ng g-1 lw). The lipid content for sole ranged between 0.6-1.2% with a mean percentage at 0.8%. Figure 2 is an example of a goby and a sole sample GC-MS chromatogram.
| Sampling period | BDE -17 | BDE -28 | BDE -71 | BDE -47 | BDE-66 | BDE -100 | BDE -99 | BDE -85 | BDE-154 | BDE -153 | BDE -183 | BDE-190 | BDE -209 | ΣPBDE |
|---|---|---|---|---|---|---|---|---|---|---|---|---|---|---|
| Spring 2005 | n.d. (0%) |
0.25 (2%) |
0.17 (1%) |
8.98 (56%) |
n.d. (0%) |
1.65 (10%) |
2.24 (14%) |
n.d. (0%) |
0.38 (2%) |
0.21 (1%) |
0.21 (1%) |
n.d. (0%) |
1.90 (12%) |
15.97c ± 0.03 |
| Summer 2005 | 0.51 (2%) |
0.74 (3%) |
0.22 (1%) |
7.08 (24%) |
0.82 (3%) |
0.96 (3%) |
3.67 (13%) |
6.05 (21%) |
0.87 (3%) |
0.23 (1%) |
0.16 (1%) |
0.11 (0%) |
7.67 (26%) |
29.09d,e ± 5.69 |
| Fall 2005 |
0.12 (1%) |
0.55 (6%) |
n.d. (0%) |
3.01 (34%) |
0.38 (4%) |
0.66 (7%) |
1.35 (15%) |
0.13 (1%) |
0.35 (4%) |
0.12 (1%) |
0.16 (2%) |
n.d. (0%) |
2.17 (24%) |
8.98a ± 1.38 |
| Winter 2006 | 0.56 (2%) |
2.06 (6%) |
0.29 (1%) |
10.51 (30%) |
1.34 (4%) |
2.52 (7%) |
10.78 (31%) |
0.37 (1%) |
1.83 (5%) |
0.49 (1%) |
0.40 (1%) |
0.21 (1%) |
3.31 (10%) |
34.66d,e ± 12.23 |
| Spring 2006 | 0.66 (3%) |
1.54 (7%) |
0.29 (1%) |
7.77 (34%) |
0.79 (4%) |
1.99 (9%) |
4.40 (20%) |
0.40 (2%) |
1.14 (5%) |
0.54 (2%) |
0.26 (1%) |
0.16 (1%) |
2.59 (12%) |
22.54d,e ± 2.51 |
| Summer 2006 | n.d. (0%) |
0.24 (2%) |
n.d. (0%) |
3.10 (26%) |
n.d. (0%) |
0.46 (4%) |
0.92 (8%) |
n.d. (0%) |
0.41 (3%) |
0.11 (1%) |
1.39 (11%) |
0.19 (2%) |
5.30 (44%) |
12.12b ± 0.34 |
| Fall 2006 |
0.52 (3%) |
1.16 (6%) |
0.21 (1%) |
5.44 (30%) |
0.76 (4%) |
0.86 (5%) |
3.53 (20%) |
0.23 (1%) |
0.74 (4%) |
0.19 (1%) |
3.11 (17%) |
0.58 (3%) |
0.77 (4%) |
18.08c,d ± 1.75 |
| Winter 2007 | 0.36 (2%) |
1.58 (7%) |
0.15 (1%) |
8.42 (37%) |
1.03 (4%) |
1.50 (7%) |
3.53 (15%) |
0.31 (1%) |
1.02 (4%) |
0.24 (1%) |
0.16 (1%) |
0.12 (1%) |
4.48 (20%) |
22.88d,e ± 3.94 |
| Spring 2007 | 0.80 (2%) |
3.13 (9%) |
0.30 (1%) |
10.24 (29%) |
1.48 (4%) |
1.95 (6%) |
9.18 (26%) |
0.82 (2%) |
2.11 (6%) |
0.58 (2%) |
0.56 (2%) |
0.63 (2%) |
3.24 (9%) |
35.00e ± 4.91 |
Parentheses figures represent mean value percent contribution of each congener to the ΣPBDE. ΣPBDEs data is presented as mean values ± standard error. n.d.: not detected a, b, c, d, e : Mean values with the same index present no statistically significant difference (p>0.05).
Table 2: Mean PBDE congener mass fractions (ng/g lipid weight) in goby according to sampling period and congener contribution to total PBDE.
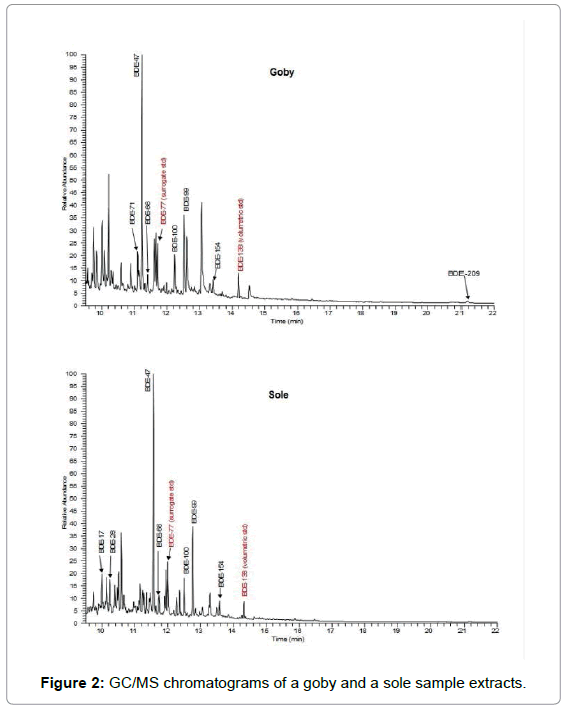
Figure 2: GC/MS chromatograms of a goby and a sole sample extracts.
It is evident that the mean mass fractions of Σ PBDE in both species had significant differences between the sampling period spring 2005 – spring 2007. Figure 3 presents mean mass fractions with standard error for Σ PBDE of both species and each sampling period during 2005-2007. In all sampling points small differences were observed in PBDE levels between the two species; also, Σ PBDE levels fluctuated in a similar pattern over time. The particularly high mass fractions detected in sole samples during winter 2006 are an exception to these observations.
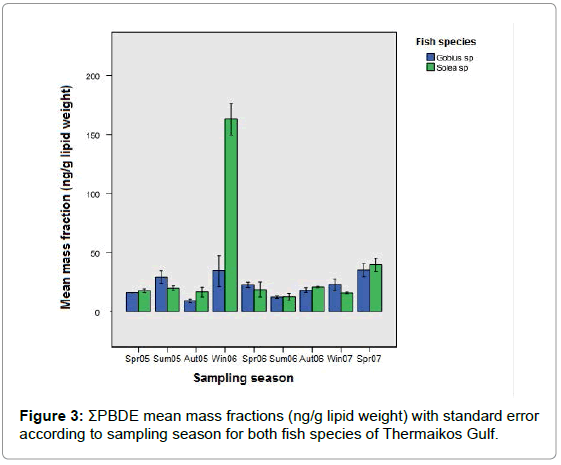
Figure 3: ΣPBDE mean mass fractions (ng/g lipid weight) with standard error according to sampling season for both fish species of Thermaikos Gulf.
Statistical analysis of the results for both goby and sole confirmed the presence of statistically significant differences in PBDEs levels between sampling periods during spring 2005-spring 2007 (Kruskal- Wallis and Mann-Whitney tests). While it is difficult to explain these differences between sampling periods over time, it is possible that increased levels of PBDEs could result from individual fish samples that were caught from areas directly affected by PBDE pollution, resulting in direct exposure to these compounds. Winter 2006 mean mass fraction for sole was particularly high in comparison to all other samples. This sharp increase in sole is also very difficult to explain. One significant factor for the high accumulation of pollutants could be poor seawater circulation [26-28]. Studies have also shown rainfall precipitation and stormwater runoff to enhance the deposition of particle and gas phase PBDEs with significant correlations existing between PBDE congener profile in biota and precipitation [29]. Further statistical analysis of the results (Jonckheere – Terpstra tests) confirmed the existence of an increasing trend in Σ PBDE levels over time (from spring 2005 to spring 2007) for both species. These findings could perhaps mark a growing presence of PBDEs in Thermaikos bay and subsequent pollution of the aquatic ecosystem.
PBDE congener profile and ratios
An analysis of the congener profiles (Tables 2 and 3) showed that the highest contributions come from tetra- and penta-BDEs (BDE- 47, -99 and -100), reaching up to 50-70% of Σ PBDE in most cases and were present to all goby and sole samples. Similar percentages of these congeners have been reported in several studies [20,30]. Penta-BDE commercial mixtures are considered a direct pollution source for the aquatic food chain [31]. Congener profile analysis for organisms in the higher levels of the food chain (i.e. fish) is complex. PBDEs commercial mixtures may follow different courses after their environmental release and moreover each organism possesses unique metabolic capabilities that may lead to variations in assimilation and accumulation, biotransformation or elimination of PBDEs [32].
| Sampling period | BDE -17 | BDE -28 | BDE -71 | BDE -47 | BDE -66 | BDE -100 | BDE -99 | BDE -85 | BDE -154 | BDE -153 | BDE -183 | BDE-190 | BDE -209 | ΣPBDE |
|---|---|---|---|---|---|---|---|---|---|---|---|---|---|---|
| Spring 2005 | n.d. (0%) |
0.50 (3%) |
0.31 (2%) |
6.43 (36%) |
n.d. (0%) |
1.39 (8%) |
2.48 (14%) |
n.d. (0%) |
0.87 (5%) |
0.37 (2%) |
2.68 (15%) |
n.d. (0%) |
2.65 (15%) |
17.68c ± 0.49 |
| Summer 2005 | 0.24 (1%) |
0.71 (4%) |
0.20 (1%) |
4.74 (24%) |
2.03 (10%) |
1.10 (6%) |
1.83 (9%) |
0.18 (1%) |
0.90 (5%) |
0.32 (2%) |
0.78 (4%) |
0.11 (1%) |
6.62 (33%) |
19.76d ± 0.58 |
| Fall 2005 |
n.d. (0%) |
0.30 (2%) |
0.04 (0%) |
2.70 (16%) |
1.04 (6%) |
0.92 (6%) |
1.10 (7%) |
n.d. (0%) |
0.86 (5%) |
0.13 (1%) |
0.18 (1%) |
n.d. (0%) |
9.37 (56%) |
16.64c ± 2.99 |
| Winter 2006 | 0.73 (0%) |
3.82 (2%) |
0.67 (0%) |
50.68 (31%) |
3.27 (2%) |
15.27 (9%) |
67.76 (42%) |
1.21 (1%) |
10.25 (6%) |
2.57 (2%) |
1.72 (1%) |
0.37 (0%) |
4.95 (3%) |
163.26f ± 13.09 |
| Spring 2006 | 0.24 (1%) |
0.34 (2%) |
4.36 (23%) |
4.67 (25%) |
0.19 (1%) |
1.50 (8%) |
2.20 (12%) |
0.21 (1%) |
0.45 (2%) |
0.21 (1%) |
0.28 (1%) |
n.d. (0%) |
3.91 (21%) |
18.56c,d ± 5.14 |
| Summer 2006 | n.d. (0%) |
0.48 (4%) |
0.05 (0%) |
3.35 (27%) |
n.d. (0%) |
1.15 (9%) |
2.080 (17%) |
0.05 (0%) |
2.02 (16%) |
0.17 (1%) |
0.15 (1%) |
n.d. (0%) |
2.87 (23%) |
12.36a ± 1.14 |
| Fall 2006 |
0.53 (3%) |
1.96 (9%) |
0.15 (1%) |
5.65 (27%) |
1.31 (6%) |
1.49 (7%) |
3.91 (19%) |
0.25 (1%) |
2.89 (14%) |
0.18 (1%) |
0.19 (1%) |
0.16 (1%) |
1.96 (10%) |
20.61d ± 0.17 |
| Winter 2007 | 0.34 (2%) |
1.30 (8%) |
0.26 (2%) |
3.70 (23%) |
1.38 (9%) |
1.09 (7%) |
2.85 (18%) |
0.32 (2%) |
3.29 (21%) |
0.22 (1%) |
0.15 (1%) |
0.06 (0%) |
0.79 (5%) |
15.75b ± 0.19 |
| Spring 2007 | 0.63 (2%) |
2.42 (8%) |
0.35 (1%) |
8.68 (22%) |
3.03 (8%) |
1.80 (5%) |
6.45 (16%) |
8.83 (22%) |
4.91 (12%) |
0.36 (1%) |
0.27 (1%) |
0.24 (1%) |
1.56 (4%) |
39.53e ± 5.60 |
Parentheses figures represent mean value percent contribution of each congener to the ΣPBDE. ΣPBDE data is presented as mean values ± standard error. n.d. : not detected a, b, c, d, e, f : Mean values with the same index present no statistically significant difference (p>0.05).
Table 3: Mean PBDE congener mass fractions (ng/g lipid weight) in sole according to sampling period and congener contribution to total PBDE.
BDE-47 presented the highest mean mass fractions (goby: 33%, 3.01-10.51 ng g-1 lw, sole: 26%, 2.70-8.68 ng g-1 lw). The contribution of this congener was comparable or lower to those of other studies [33,34]. On occasion, BDE-47 contributions exceeded 80% of the Σ PBDE [35]. The high percentages of BDE-47 in Σ PBDE are expected because it is one of the main congeners included in commercial mixtures which are widely used in the industry (i.e. Bromkal 70- 5DE). In addition, it has been proven that BDE-47 is one of the main transformation products of higher brominated congeners such as BDE-99, -100, -153, etc. [36].
BDE-99 was detected in lower mean mass fractions than BDE-47 for both fish species (goby: 18%, 0.92-10.78 ng g-1 lw, sole: 17%, 1.10- 6.45 ng g-1 lw). The high contributions of BDE-99 are in agreement with other studies in fish [8,37]. However, the PBDE congener profile in organisms like fish, which are at high positions in the aquatic food chain, can be affected by numerous factors, including the fish species and the food chain structure. There are other studies with different fish species, such as carp, where BDE-99 was not detected [38], which is attributed to the fact that carp effectively metabolize this congener and biotransform it to BDE-47 [36].
BDE-209 was found to have similar contribution to Σ PBDE as BDE-99 for both fish species (goby: 18%, 0.77-7.67 ng g-1 lw, sole: 19%, 0.79-9.37 ng g-1 lw). The presence of BDE-209 in goby has been reported at comparable or lower levels [39]. Several parameters can influence the presence of BDE-209 in fish species, such as recent exposure, fish diet, position in the food chain or metabolic capacity [35,40-42]. Detection of BDE-209 in goby and sole in the current study may additionally be attributed to the benthic characteristics of the species and the effects of direct and continuous exposure to sediment. However, in the majority of studies that involve fish, especially for fish in the higher positions of the food chain, BDE-209 appears at less than 2% or even under the limit of detection [40,43].
Hexa-BDEs (BDE-154, -153) as well as all other congeners were found to have little contribution to Σ PBDE; the results are in agreement with other studies [44].
BDE-47 and -99 are the two main congeners present in penta- BDE commercial mixtures. In the present study the ratios of the mean mass fractions of these congeners (BDE-47/BDE-99) for every sampling period ranged between 0.98 and 4.02 for goby, and between 0.75 and 2.60 for sole. These values are comparable or higher than the ratio in the commercial penta-BDE product Bromkal 70-5DE, which is approximately 1.0 [45]. This fact shows an enhanced presence of BDE-47 in most cases for this study. It has been confirmed that BDE- 47 biotransformation is more difficult than BDE-99 [31]. Moreover, BDE-47 and -100 comprise of smaller molecules than BDE-99 [35]. It is possible that this enables these congeners to bioaccumulate more easily than BDE-99 [46]. The elevated ratios of BDE-47/BDE- 99 recorded in the two fish species from Thermaikos gulf could be attributed either to biotransformation of BDE-99 or to its limited bioaccumulation capacity in relation to BDE-47. In addition, BDE- 47 has been demonstrated to have higher dietary uptake rates in fish gastrointestinal tract (90%) in comparison to BDE-99 (62%) and BDE-153 (40%) [47].
With regard to the ratio BDE-100/BDE-99, values were calculated between 0.21 and 0.74 for goby; for sole, they ranged between 0.23 and 0.84. These results are comparable or higher than the ratio of these congeners for the commercial mixture Bromkal 70-5DE (0.19) and show a reinforced presence of BDE-99. Opposite results are presented in another study [35], where higher trophic level organisms such as goby, sole or carp exhibit dominance of BDE-100 (BDE- 100:BDE99 70:30, 80:20 and 95:5, respectively), while in lower trophic level organisms such as mussels and shrimps the ratios are inverted (BDE-100:BDE-99 20:80). Following the conclusions of the same study, that the BDE-100/BDE-99 ratio is clearly species and location dependent, it can only be deducted that location plays an important role for aquatic organisms. Other studies in fish, including sole as a species, also show higher levels of BDE-99 in comparison with BDE- 100 [48,49]
Comparison according to fish species
Data analysis of PBDE levels according to fish species (goby and sole) exhibited slightly elevated mean mass fractions for sole in relation to goby (Σ PBDE: 31.02 and 22.15 ng g-1, respectively). Nevertheless, further statistical analysis (Mann-Whitney test) proved that Σ PBDE levels were unaffected by fish species as the differences recorded were not statistically significant. This could probably be attributed to the benthic life characteristics and dietary habits which are common for both species and place them at the same position in the trophic chain. In addition, the common age range for all samples of both species in the current study corresponds to a similar exposure period to bioavailable pollutants, such as PBDEs. Statistical analysis of the main congeners (BDE-47, -100, -99, -154, -153, -209) likewise showed no statistically significant differences between the two species.
Spearman correlation analysis
Spearman correlation analysis was applied to the data from the current study in order to ascertain the possible origin of PBDE congeners in goby and sole from Thermaikos gulf, although there are additional factors that could affect PBDE congener levels in aquatic organisms, such as uptake rates, bioaccumulation, biotransformation and/or elimination mechanisms. The Spearman correlation factors calculated are presented at Tables 4 and 5 for goby and sole, respectively.
| BDE-17 | BDE-28 | BDE-71 | BDE-47 | BDE-66 | BDE-100 | BDE-99 | BDE-85 | BDE-154 | BDE-153 | BDE-183 | BDE-190 | BDE-209 | |
|---|---|---|---|---|---|---|---|---|---|---|---|---|---|
| BDE-17 | 1.000 | ||||||||||||
| BDE-28 | 0.793*** | 1.000 | |||||||||||
| BDE-71 | 0.569*** | 0.675*** | 1.000 | ||||||||||
| BDE-47 | 0.424** | 0.566*** | 0.742*** | 1.000 | |||||||||
| BDE-66 | 0.680*** | 0.708*** | 0.679*** | 0.537*** | 1.000 | ||||||||
| BDE-100 | 0.452** | 0.724*** | 0.768*** | 0.876*** | 0.460** | 1.000 | |||||||
| BDE-99 | 0.850*** | 0.926*** | 0.818*** | 0.666*** | 0.683*** | 0.761*** | 1.000 | ||||||
| BDE-85 | 0.816*** | 0.674*** | 0.615*** | 0.468** | 0.766*** | 0.382* | 0.775*** | 1.000 | |||||
| BDE-154 | 0.824*** | 0.950*** | 0.713*** | 0.594*** | 0.696*** | 0.730*** | 0.952*** | 0.762*** | 1.000 | ||||
| BDE-153 | 0.734*** | 0.769*** | 0.667*** | 0.643*** | 0.533*** | 0.789*** | 0.847*** | 0.620*** | 0.823*** | 1.000 | |||
| BDE-183 | 0.022 | 0.153 | 0.190 | 0.011 | 0.036 | 0.034 | 0.146 | -0.186 | 0.087 | 0.005 | 1.000 | ||
| BDE-190 | 0.384* | 0.426** | 0.256 | -0.153 | 0.182 | 0.009 | 0.393* | -0.153 | 0.375* | 0.243 | 0.500** | 1.000 | |
| BDE-209 | 0.212 | 0.136 | 0.072 | 0.158 | 0.187 | 0.084 | 0.220 | 0.434** | 0.303 | 0.197 | -0.013 | -0.122 | 1.000 |
*** Significant correlation level 00.001 (p<00.001),** Significant correlation level 00.01 (00.001<p<00.01),* Significant correlation level 00.05 (00.01<p<00.05)
Table 4: Spearman correlations between PBDEs congeners in goby (Gobius spp0.)0.
| BDE-17 | BDE-28 | BDE-71 | BDE-47 | BDE-66 | BDE-100 | BDE-99 | BDE-85 | BDE-154 | BDE-153 | BDE-183 | BDE-190 | BDE-209 | |
|---|---|---|---|---|---|---|---|---|---|---|---|---|---|
| BDE-17 | 1.000 | ||||||||||||
| BDE-28 | 0.851*** | 1.000 | |||||||||||
| BDE-71 | 0.617*** | 0.511*** | 1.000 | ||||||||||
| BDE-47 | 0.653*** | 0.715*** | 0.738*** | 1.000 | |||||||||
| BDE-66 | 0.773*** | 0.777*** | 0.473** | 0.520*** | 1.000 | ||||||||
| BDE-100 | 0.674*** | 0.751*** | 0.697*** | 0.922*** | 0.437** | 1.000 | |||||||
| BDE-99 | 0.836*** | 0.864*** | 0.660*** | 0.806*** | 0.568*** | 0.897*** | 1.000 | ||||||
| BDE-85 | 0.905*** | 0.856*** | 0.626*** | 0.650*** | 0.793*** | 0.711*** | 0.842*** | 1.000 | |||||
| BDE-154 | 0.694*** | 0.886*** | 0.295 | 0.548*** | 0.685*** | 0.620*** | 0.796*** | 0.704*** | 1.000 | ||||
| BDE-153 | 0.494** | 0.488** | 0.665*** | 0.775*** | 0.472** | 0.644*** | 0.548*** | 0.562*** | 0.379* | 1.000 | |||
| BDE-183 | 0.192 | 0.148 | 0.542*** | 0.645*** | 0.214 | 0.457** | 0.238 | 0.214 | -0.005 | 0.853*** | 1.000 | ||
| BDE-190 | 0.834*** | 0.890*** | 0.404* | 0.674*** | 0.877*** | 0.648*** | 0.755*** | 0.848*** | 0.813*** | 0.590*** | 0.312 | 1.000 | |
| BDE-209 | -0.358* | -0.430** | -0.177 | -0.232 | -0.243 | -0.355* | -0.525*** | 0.397* | -0.552*** | -0.187 | 0.158 | -0.341* | 1.000 |
*** Significant correlation level 00.001 (p<00.001)
** Significant correlation level 00.01 (00.001<p<00.01)
* Significant correlation level 00.05 (00.01<p<00.05)
Table 5: Spearman correlations between PBDEs congeners in sole (Solea solea)0.
Strong correlations were recorded between tri-, tetra-, penta- and hexa-BDE (BDE-17, -28, -71, -47, -66, -100, -99, -85, -154, -153) for goby (r=0.533-0.952, p<0.001) with few exceptions. BDE-100 had a weak correlation with BDE-85 (r=0.382, 0.01<p<0.05). On the contrary, higher brominated congeners such as BDE-183, -190 and -209 exhibited, with few exceptions, no correlation between them or with the rest of the congeners. The only weak or moderate correlations involved BDE-190 with BDE-17, -28, -99, -154 and -183 (r=0.375- 0.500, 0.001<p<0.05) as well as BDE-209 with BDE-85 (r=0.434, 0.001<p<0.01).
Similar results were found for congener correlation factors for sole. Tri-, tetra-, penta- and hexa-BDE (BDE-17, -28, -71, -47, -66, -100, -99, -85, -154) showed strong correlations (r=0.520-0.922, p<0.001) with few exceptions. Unlike goby, BDE-153 showed moderate to weak correlations for congeners such as BDE-17, -28, -66 (r=0.472-0.494, 0.001<p<0.01). The weak correlation of BDE- 153 with BDE-154 is noteworthy (r=0.379, 0.01<p<0.05) as these congeners are usually strongly related. Another difference with the goby results is the strong correlations between BDE-190 and lower brominated congeners (r=0.590-0.890, p<0.001) in sole, except BDE- 71 and -183 (weak and no correlation). On the contrary, the other higher brominated congeners of the study (BDE-183 and -209) had no strong correlation with the rest of the congeners, with few exceptions. The negative correlations of BDE-209 with several congeners (BDE- 17, -28, -100, -99, -154, etc.) should be noted; negative values point to opposite patterns for each congener mass fraction, meaning that an increase of BDE-209 levels should correspond to a decrease of the other congeners’ levels and vice versa.
The variability observed in both fish species for higher brominated congeners, especially for BDE-209, and the lack of correlation with the rest of the congeners, reinforces the estimation that these congeners originate from different sources. Moreover, each fish species has different metabolic capabilities. In comparison with PBDE correlation results from another study in sediments [22] similarities were observed, especially the strong correlations between the lower and moderate brominated congeners (tri- to hepta-BDE). These correlations were expected given their physicochemical properties and biotransformation processes and further supports the assumption that a considerable percentage of these congeners originate from the same sources, unlike the higher brominated congeners.
Comparison of PBDE levels with international studies
In order to ascertain the level of pollution with PBDEs for the fish species of Thermaikos gulf, the PBDE mass fractions were compared to those of similar studies in fish worldwide (Table 6). The results from the current study are presented both in ng/g lipid weight and wet weight in order to facilitate comparison with the majority of published data that follow either basis for result reporting. Organic pollutant levels in muscle tissues of fish species such as goby and sole can provide useful information as these species are edible. Reporting of results on wet weight basis can lead to conclusions regarding uptake and accumulation of pollutants such as PBDEs, according to the fresh amount of food (fish) consumed.
| Location | Fish species | Year | C | BDE-47 | BDE-100 | BDE-99 | BDE-154 | BDE-153 | BDE-209 | ΣPBDEs | Reference |
|---|---|---|---|---|---|---|---|---|---|---|---|
| Greece | Goby | 2005-2007 | 13 | 30.10-100.51 00.025-00.093a |
00.46-20.52 00.004-00.023a |
00.92-100.78 00.008-00.096a |
00.35-20.11 00.003-00.016a |
00.11-00.58 00.001-00.005a |
00.77-70.67 00.006-00.087a |
80.98-350.00 00.073-00.331a |
Current study |
| Greece | Sole | 2005-2007 | 13 | 20.70-500.68 00.021-00.378a |
00.92-150.27 00.007-00.114a |
10.10-670.76 00.009-00.505a |
00.45-100.25 00.004-00.076a |
00.13-20.57 00.001-00.019a |
00.79-90.37 00.007-00.077a |
120.36-1630.26 00.106-10.215a |
Current study |
| Belgium | Goby | 2001 | 6 | 00.16-90.7a | [35] | ||||||
| Belgium | Sole | 2001 | 6 | 00.08-60.9a | [35] | ||||||
| Italy | Goby | 2003 | 7 | 30-95 | 60-70 | 50-65 | 10-20 | 5-20 | 225-240 | [44] | |
| France | Sole | 6 | 00.09-00.39a | 00.01-00.39a | 00.01-00.13a | 00.01-00.13a | 00.01-00.09a | 00.2-10.1a | [32] | ||
| Japan | Goby | 2005 | 20 | 630.8 | 100.9 | nd | 30.02 | nd | 80.00 | 192 | [39] |
| China | Goby | 2007 | 12 | 10.20-590.86 | 10.18-140.07 | nd-70.55 | 10.40-130.17 | 10.22-160.88 | 90.35-1650.06 | [50] | |
| China | Sole | 2007 | 12 | 70.94-180.66 | 10.35-60.72 | nd-10.65 | 20.62-70.27 | 10.22-40.88 | 180.36-540.47 | [50] | |
| Canada | Sole | 1992 | 13 | 140.7 | 40.45 | 70.36 | 10.51 | 60.16 | 340.2 | [48] | |
| Canada | Sole | 2000 | 13 | 480.5 | 150.4 | 160.8 | 40.93 | 60.21 | 910.8 | [48] | |
| Spain | Barbel | 2002 | 17 | 00.8-220.1 | nd-20.1 | nd | 00.8-060.9 | 00.3-1250.5 | nd | 10.3-2970.9 | [43] |
| Baltic | Salmon | 1995 | 3 | 132 | 35 | 37 | 60.0 | 30.2 | 213 | [58] | |
| USA | Salmonids | 1992-2000 | 32 | 160.8-325 | 50.20-148 | 220.8-479 | 20.0-440.0 | 30.0-630.7 | 490.8-1060 | [49] | |
| Switzerland | Salmon | 2002 | 7 | 440.3 | 40.63 | 240.0 | 10.52 | 10.21 | 750.6 | [52] | |
| Switzerland | Trout | 2002 | 7 | 110.5 | 10.70 | 20.27 | 00.36 | 00.27 | 160.1 | [52] | |
| Germany | Bream | 2001 | 11 | 127 | 310.8 | 00.49 | 180.2 | 40.80 | 00.97 | 198 | [51] |
| Japan | Sea bass | 2005 | 20 | 690.2 | 70.78 | 180.0 | 20.38 | 10.91 | nd | 960.7 | [39] |
| Netherlands | Mackerel | 1997 | 5 | 50.40 | 10.80 | 10.90 | 90.10 | [56] | |||
| Romania | Perch | 2001 | 7 | 00.03a | [54] | ||||||
| Scotland | Trout | 2000-2001 | 6 | 00.3a | 00.07a | 00.6a | 00.08a | 00.1a | 10.1a | [57] | |
| Sweden | Pike | 20.5a | 00.5a | <00.3a | 390.2a | [58] | |||||
| China | Carp | 2007 | 9 | 00.025-00.054a | 00.003-00.005a | 00.003-00.010a | 00.007-00.013a | 00.004-00.015a | 00.054-00.117a | [34] | |
| China | Grouper | 2007-2008 | 8 | 00.11-00.16 | 00.03-00.07 | 0-00.05 | 0-00.03 | 00.01-00.05 | nd | 00.24-00.43 | [53] |
| China | Mullet | 2007-2008 | 8 | 00.21-00.33 | 00.03-00.09 | 00.02-00.08 | 0-00.05 | 0-00.03 | nd | 00.50-00.71 | [53] |
| Czech Rep0. | Bream | 2001-2003 | 10 | 60.3-130.1a | 10.2-20.8a | nd-00.5a | 00.5-00.8a | 10.4-70.4a | [37] | ||
| Switzerland | Trout | 2004 | 13 | 48-189 | 50.2-31 | 24-127 | 10.1-80.9 | 00.7-80.9 | 20.2-24 | 90-387 | [33] |
| USA | Catfish | 2004 | 13 | 260.4 | 70.4 | 170.6 | 90.3 | 100.5 | 40.5 | 10.8-306 | [55] |
C : Number of PBDE congeners analysed, nd : Not detected ; a : ng/g wet weight
Table 6: Comparison of PBDE mean mass fractions (ng/g lipid weight) in Thermaikos gulf fish with international literature0.
Mean mass fractions for Σ PBDE in Thermaikos gulf fish were comparable or lower than the ones reported for similar benthic species (mainly goby and sole) in several areas worldwide [32,35,39,44,48,50]. The differences observed between the levels reported in these studies could be attributed to several factors such as geomorphological characteristics, population density, industrialization degree and other specific environmental conditions.
Main congener results (BDE-47, -100, -99, -154, -153, -209) were chosen to be presented in Table 6 because several studies on fish analysis base the comparison of results on these congeners, rather than the Σ PBDE. Comparison through Σ PBDE is considered to have drawbacks since the number as well as the choice of congeners reported in most studies fluctuates. Therefore, the use of individual congeners such as BDE-47 which exists in abundance in aquatic environments can constitute one solution for proper comparison [8]. BDE-47 is the dominant congener presented at Table 6 in the majority of studies including the current one. In agreement with Σ PBDE, BDE-47 levels are comparable or lower than other studies of benthic species of fish.
There were occasions where mass fractions in goby were 6 to 10 times higher than the ones reported for goby of Thermaikos gulf [39,44,50]. For sole, mass fractions reported in other studies were comparable [32,50] and a temporal study reported rapid increase from low to high levels for BDE-47 between 1992 and 2000 (14.7 48.5 ng g-1 lw) [48].
Comparisons with studies on other fish species with similar benthic characteristics as goby and sole [43], as well as other species located at higher position in the trophic chain [49,51-54] led to contradictory results. Studies on barbell [43], carp [34] and catfish [55] recorded similar mass fractions to go by and sole from Thermaikos gulf which could be attributed to the common benthic characteristics of these species; however, one other study [53] reported 30-50 times lower levels in grouper and mullet.
Other studies with similar fish species in higher positions in the trophic chain than goby and sole report comparable or higher mass fractions than those in the present study [51,52,56-58]. These differences could be attributed to different habits, diet and food chain structure. Predator species in higher trophic levels show increased biomagnification and bioaccumulation with PBDEs in comparison with benthic species that feed on molluscs (crustaceans) or invertebrates [59]. Moreover, differences in fat content and metabolic capabilities between these species can lead to different uptake and elimination rates of lipophilic compounds such as PBDEs. It should also be noted that muscle tissues have low fat content compared to other fish tissues.
Taking into account average mass fractions reported in fish [20], goby and sole from Thermaikos gulf are less polluted with PBDEs than the European average (BDE-47: 81.8 ng g-1 lw). In Asia-Pacific PBDE environmental contamination is reported to be comparable or slightly higher than Europe [60]. Compared to the high pollution levels recorded for fish in North America (BDE-47: 622 ng g-1 lw) [20], mass fractions for the current study fish species were at least 10 times lower.
PBDEs in Thermaikos gulf aquatic ecosystem and public health
With regard to public health issues, a direct link between the presence of PBDEs in edible fish species such as goby and sole from Thermaikos gulf and bioaccumulation has already been established [8,16], leading to direct (toxicosis) or indirect (bioaccumulation) effects on humans. The most extensive bioaccumulation within the trophic chain is recorded from the trophic level of fish to marine mammals [8].
Bioaccumulation factors between biota and abiotic environment, like sediments (Biota-Sediment Accumulation Factor, BSAF) can be calculated according to the equation [61]:
BSAF = CX/CY
Where CX and CY are mean concentrations of the organism (fish) and the abiotic environment (sediments), respectively. Combining the data of the present study, modified at dry weight basis, with those of a study on sediments [22] the BSAFGob and BSAFSol values that are presented on Table 7 were obtained. An increase to bioaccumulation of chemicals such as PBDEs in various levels of the food chain becomes significant when logKOW values exceed 5.0- 6.5 [62]. In cases between sediments as the abiotic environment and mussels as the organism, a decrease in BSAF values is observerd when the PBDE bromination degree increases. This connection between BSAF and logKOW values could be explained by molecular steric hindrance, which restricts large and particularly hydrophobic organic compounds from penetrating cellular membranes or by strong binding of such compounds to carbonaceous soil adsorbents, such as carbon black, coal and oil products in sediments [61].
| PBDE congener | log KOW coefficienta | BSAFGob (Goby/Sediments) | BSAFSol (Sole/Sediments) |
|---|---|---|---|
| BDE-17 | 50.52−50.88 | 50.01 | 30.51 |
| BDE-28 | 50.94/50.98 | 80.12 | 80.18 |
| BDE-71 | - | 20.2 | 90.44 |
| BDE-47 | 60.01-60.77/60.81 | 40.54 | 50.96 |
| BDE-66 | 60.73 | 30.48 | 50.79 |
| BDE-100 | 60.86/70.24 | 50.29 | 100.11 |
| BDE-99 | 60.53-70.66 | 50.8 | 110.92 |
| BDE-85 | 60.57-70.66 | 70.02 | 70.3 |
| BDE-154 | 70.39/70.82 | 120.43 | 340.73 |
| BDE-153 | 70.62/70.83/70.90 | 30.61 | 50.53 |
| BDE-183 | 80.27 | 20.55 | 20.64 |
| BDE-190 | 80.36/90.44 | 40.73 | 20.11 |
| BDE-209 | 60.27 | 00.2 | 00.2 |
a : Source: U0.S0. Environmental Protection Agency (EPA)0. (2010) An exposure assessment of polybrominated diphenyl ethers0.
Table 7: Bioaccumulation factors (BSAF) between fish and sediments of Thermaikos gulf0.
For goby and sole, BDE-154 appears to be an exception by showing the highest BSAF. This deviant behavior with regard to the logKOW connection could be attributed to high biotransformation percentages of BDE-183, a fact further supported by the low BSAF of BDE-183 for both species. The debromination of BDE-183 to BDE-154 in fish has already been reported in the literature [36]. BDE-99, -100, -85 showed also slightly elevated BSAF in comparison with lighter, lower brominated congeners that could result from reduced metabolic capabilities of these two fish species for these congeners, leading to a higher degree of bioaccumulation. BDE-209 had the lowest BSAF in all cases, a result in agreement with its physicochemical properties and behavior in biota.
The extensive use of PBDEs as flame retardants, the rapid increase of their levels in human milk [63] and their abilities as endocrine disruptors are important reasons to implement monitoring of human exposure to these compounds. One of the most important exposure pathways, after house dust inhalation and environmental release from products containing PBDEs, is seafood consumption. A strong correlation between PBDE concentrations in human breast milk and intake from fish and shellfish has been reported [64]. Unlike PCBs and PCDD/Fs, PBDEs are not restricted by law in food. Possible risks of consuming food with PBDEs may be assessed by calculating the Provisional Tolerable Weekly Intake (PTWI), which was instituted by the World Health Organization (WHO) and the Food and Agriculture Organization (FAO) for specific chemical compounds. The PTWI limit suggested by the European Food Safety Authority for PBDEs is 0.7 μg kg-1 body weights [21], which correspond to a maximum weekly intake of 49 μg for a 70 kg adult. Based on data for PBDEs, the Lowest Observed Adverse Effect Level (LOAEL) is 1 mg kg-1 /day, a value which was determined after performing studies on rats [65].
According to the present study, mean concentrations of Σ PBDE (net weight) are approximately 0.19 μg kg-1 (0.05 – 0.49 μg kg-1) for goby and 0.29 μg kg-1 (0.08-1.42 μg kg-1) for sole. A meal of 200 g of fish from Thermaikos gulf would provide approximately 39 ng for goby and 58 ng for sole of PBDEs in a human. This amount corresponds roughly to 0.1% of the PTWI for a 70 kg adult in both cases, which is particularly low. Although there are few reports on average per capita fish and shellfish consumption in Greece [66], detailed and confirmed data on weekly or annual average per capita consumption are not available. PBDE mass fractions in Thermaikos gulf edible fish species are particularly low and consumption of these products poses no threat to public health, to the extent that PBDEs intake and assimilation is concerned.
Conclusion
The results presented in this study led to the conclusion that PBDE pollution for the two benthic fish species, goby and sole, of Thermaikos gulf is low or comparable with that of similar areas with industrial, rural and/or urban activities. This assessment was supported by congener ratio calculations. In particular the ratio BDE-100/BDE-99 presented some controversial findings with other studies that reinforced the conclusion that PBDE levels in fish are heavily location-depended. Congener correlation analysis led to the conclusion that pollution sources for higher and lower brominated congeners are different, and that fish follow different metabolic/elimination procedures between higher and lower brominated congeners. In addition, the distribution of congener levels to the Σ PBDEs showed that biotransformation from higher to lower brominated congeners play an important role to PBDE pollution besides the presence of commercial penta-mixtures. Also, the presence of BDE-209, unlike most fish studies where it is not detected, could imply existence of commercial deca-BDE mixtures or related products in the area.
Goby and sole presented no differences between them; since several factors (i.e. dietary habits, age range, trophic level) are shared by both species, it signifies their similar exposure to PBDEs. An increasing temporal trend in PBDE levels was established. Taking into account the temporal fluctuations observed in mass fractions, PBDE levels in Thermaikos gulf fish require further monitoring. Calculation of bioaccumulation factors (BSAF) proved that increasing the degree of bromination in congeners leads to reduction of their bioaccumulation capacity with some exceptions, probably due to reduced metabolic capabilities of these fish species for these congeners or high biotransformation rates from higher brominated congeners. Another reason is that higher brominated congeners are relatively immobile in sediment and soils showing elevated levels but do not mobilize well or get taken up efficiently. Consumption of these fish, according to EFSA limits for consumers, poses no threat for public health.
Acknowledgement
This work is dedicated to the memory of Dr. M. Athanasiadou. The project was financially supported by the Greek State Scholarships Foundation (grant number: 1160611615.012.040). The authors would like to thank the Sailing and Rowing Team from the Department of Physical Training & Athletics, Hellenic Police Academy for their invaluable help during sampling procedures. No issue of conflict of interest exists for any of the authors.
References
- Athanasiadou M (2003) Screening of Polybrominated Compounds in Species from Different Trophic Levels in the Baltic Sea. Stockholm.
- Darnerud PO, Eriksen GS, Jóhannesson T, Larsen PB, Viluksela M (2000) Polybrominated diphenyl ethers: occurrence, dietary exposure, and toxicology. Environ Health Perspect 109: 49-68.
- Alaee M, Arias P, Sjödin A, Bergman Å (2003) An overview of commercially used brominated flame retardants, their applications, their use patterns in different countries/regions and possible modes of release. Environ Int. 29: 683-689.
- Rahman F, Langford KH, Scrimshaw MD, Lester JN (2001) Polybrominated diphenyl ether (PBDE) flame retardants. Sci Total Environ 275: 1-17.
- Stephansen DA, Svendsen TC, Vorkamp K, Frier JO (2012) Changes in patterns of persistent halogenated compounds through a pelagic food web in the Baltic Sea. Mar Environ Res 73: 17-24.
- Harmelin Vivien M, Bodiguel X, Charmasson S, Loizeau V, Mellon-Duval C, et al. (2012) Differential biomagnification of PCB, PBDE, Hg and Radiocesium in the food web of the European hake from the NW Mediterranean. Mar Pollut Bull 64: 974-983.
- Watanabe I, Sakai S (2003) Environmental release and behavior of brominated flame retardants. Environ Int 29: 665-682.
- Boon JP, Lewis WE, Tjoen-A-Choy MR, Allchin CR, Law RJ, et al. (2002) Levels of polybrominated diphenyl ether (PBDE) flame retardants in animals representing different trophic levels of the North Sea food Web. Environ Sci Technol 36: 4025-4032.
- Tanabe S (2008) Temporal trends of brominated flame retardants in coastal waters of Japan and South China: retrospective monitoring study using archived samples from es-Bank, Ehime University, Japan. Mar Pollut Bull 57: 267-274.
- Law RJ, Covaci A, Harrad S, Herzke D, Abdallah MAE, et al. (2014) Levels and trends of PBDEs and HBCDs in the global environment: Status at the end of 2012. Environ Int. 65: 147-158.
- Chevrier J, Harley KG, Bradman A, Gharbi M, Sjödin A, et al. (2010) Polybrominated diphenyl ether (PBDE) flame retardants and thyroid hormone during pregnancy. Environ Health Perspect 118: 1444-1449.
- Darnerud PO, Atuma S, Aune M, Bjerselius R, Glynn A, et al. (2006) Dietary intake estimations of organohalogen contaminants (dioxins, PCB, PBDE and chlorinated pesticides, e.g. DDT) based on Swedish market basket data. Food Chem Toxicol 44:1597-1606.
- Morf L, Buser AM, Taverna R (2007) Dynamic Substance Flow Analysis Model for Selected Brominated Flame Retardants as a Base for Decision Making on Risk Reduction Measures (FABRO).
- European Commission. Directive 2003/11/EC of the European parliament and of the council of February 6 2003 amending for the 24th time Council Directive 76/669/EEC relating to restrictions on the marketing and use of certain dangerous substances and preparations .
- Stockholm Convention (2009) Stockholm convention on Persistent Organic Pollutants (POPs).
- De Wit CA (2002) An overview of brominated flame retardants in the environment. Chemosphere 46: 583-624.
- ECJ Â Judgment of the Court (Grand Chamber) of 1 April 2008- European Parliament (C-14/06), Kingdom of Denmark (C-295/06) v Commission of the European Communities.
- Peng JH, Huang CW, Weng YM, Yak HK (2007) Determination of polybrominated diphenyl ethers (PBDEs) in fish samples from rivers and estuaries in Taiwan. Chemosphere 66: 1990-1997.
- Hites RA (2004). Polybrominated diphenyl ethers in the environment and in people: a meta-analysis of concentrations. Environ Sci Technol 38: 945-956.
- Question N° EFSA-Q-2004-22 (2005) Opinion of the scientific panel on contaminants in the food chain on a request from the European Parliament related to the safety assessment of wild and farmed fish. The EFSA Journal 236: 1-118.
- Dosis I, Kamarianos A, Athanasiadou M, Athanassiadis I, Karamanlis X (2011) Polybrominated diphenyl ethers (PBDEs) in marine sediment of Thermaikos Gulf, Greece. Int J Env Analytic Chem 91: 1151-1165.
- Marsh G, Hu J, Jakobsson E, Rahm S, Bergman A (1999) Synthesis and characterization of 32 polybrominated diphenyl ethers. Env Sci Technol 33: 3033-3037.
- Jensen S, Häggberg L, Jörundsdóttir H, Odham G (2003) A quantitative lipid extraction method for residue analysis of fish involving nonhalogenated solvents. J Agri Food Chem 51: 5607-5611.
- Zolman JF (1993) Biostatistics: Experimental Design and Statistical Inference. (eds 1st) Oxford University Press.
- Ma X, Zhang H, Yao Z, Zhao X, Wang L, et al (2013) Bioaccumulation and trophic transfer of polybrominated diphenyl ethers (PBDEs) in a marine food web from Liaodong Bay, North China. Mar Pollut Bull 74: 110-115.
- Dosis I, Athanassiadis I, Karamanlis X (2013) Polybrominated diphenyl ethers (PBDEs) in mussels from cultures and natural population. Mar Pollut Bull 107: 92-101.
- UNEP-MAP (United Nations Environment Programme-Mediterranean Action Plan) MP (1996) Final reports of research projects on transport and dispersion (Research Area II), Modelling of eutrophication and algal blooms in the Thermaikos Gulf (Greece) and along the Emilia Romagna Coast (Italy).
- Arellano L, Fernández P, López JF, Rose NL, Nickus U, et al (2014) Atmospheric deposition of polybromodiphenyl ethers in remote mountain regions of Europe. Atmospheric Chem Physics 14: 4441-4457.
- Labandeira A, Eljarrat E, Barcelo D (2007) Congener distribution of polybrominated diphenyl ethers in feral carp (Cyprinus carpio) from the Llobregat River, Spain. Environ Pollut 146: 188-195.
- Stapleton HM, Letcher RJ, Li J, Baker JE (2004) Dietary accumulation and metabolism of polybrominated diphenyl ethers by juvenile carp (Cyprinus carpio). Environ Toxicol Chem 23:1939-1946.
- Bragigand V, Amiard-Triquet C, Parlier E, Boury P, Marchand P, et al. (2006) Influence of biological and ecological factors on the bioaccumulation of polybrominated diphenyl ethers in aquatic food webs from French estuaries. Sci Tot Environ 368: 615-626.
- Cheaib Z, Grandjean D, Kupper T, de Alencastro LF (2009) Brominated flame retardants in fish of Lake Geneva (Switzerland). Bull Environ Cont Toxicol 82: 522-527.
- Hu GC, Dai JY, Xu ZC, Luo XJ, Cao H, et al (2010) Bioaccumulation behavior of polybrominated diphenyl ethers (PBDEs) in the freshwater food chain of Baiyangdian Lake, North China. Environ Int 36: 309-315.
- Voorspoels S, Covaci A, Schepens P (2003) Polybrominated diphenyl ethers in marine species from the Belgian North Sea and the Western Scheldt Estuary: levels, profiles, and distribution. Environ Sci Technol 37: 4348-4357.
- Stapleton HM, Letcher RJ, Baker JE (2004) Debromination of polybrominated diphenyl ether congeners BDE 99 and BDE 183 in the intestinal tract of the common carp (Cyprinus carpio). Environ Sci Technol 38: 1054-1061.
- Pulkrabová J, Hajšlová J, Poustka J, Kazda R (2007) Fish as biomonitors of polybrominated diphenyl ethers and hexabromocyclododecane in Czech aquatic ecosystems: Pollution of the Elbe river basin. Environ Health Perspect 115: 28-34.
- Hale RC, La Guardia MJ, Harvey EP, Mainor TM, Duff WH, et al. (2001) Polybrominated diphenyl ether flame retardants in virginia freshwater fishes (USA). Environ Sci Technol 35: 4585-4591.
- Mizukawa K, Takada H, Takeuchi I, Ikemoto T, Omori K, et al.(2009) Bioconcentration and biomagnification of polybrominated diphenyl ethers (PBDEs) through lower-trophic-level coastal marine food web. Mar Pollut Bull 58: 1217-1224.
- Tomy GT, Pleskach K, Marvin CH, Oswald T, Helm P, et al. (2008) Enantioselective Bioaccumulation of Hexabromocyclododecane and Congener- Specific Accumulation of Brominated Diphenyl Ethers in an Eastern Canadian Arctic Marine Food Web. Environ Sci Technol 42: 3634-3639.
- Eljarrat E, De La Cal A, Raldua D, Duran C, Barcelo D (2005) Brominated flame retardants in Alburnus alburnus from Cinca River Basin (Spain). Environ Pollut 133: 501-508.
- Booij K, Zegers BN, Boon JP (2002) Levels of some polybrominated diphenyl ether (PBDE) flame retardants along the Dutch coast as derived from their accumulation in SPMDs and blue mussels (Mytilus edulis). Chemosphere 46: 683-688.
- Eljarrat E, De La Cal A, Raldua D, Duran C, Barcelo D (2004) Occurrence and Bioavailability of Polybrominated Diphenyl Ethers and Hexabromocyclododecane in Sediment and Fish from the Cinca River, a Tributary of the Ebro River (Spain). Environ Sci Technol 38: 2603-2608.
- Viganò L, Roscioli C, Erratico C, Guzzella L (2008) Polybrominated diphenyl ethers (PBDEs) and polychlorinated biphenyls (PCBs) in 0+ juvenile cyprinids and sediments of the Po River. Arch Environ Contam Toxicol 55: 282-294.
- Sjödin A, Jakobsson E, Kierkegaard A, Marsh G, Sellström U (1998) Gas chromatographic identification and quantification of polybrominated diphenyl ethers in a commercial product, Bromkal 70-5DE. J Chromatogr A 822: 83-89.
- Luross JM, Alaee M, Sergeant DB, Cannon CM, Whittle DM, et al.(2002) Spatial distribution of polybrominated diphenyl ethers and polybrominated biphenyls in lake trout from the Laurentian Great Lakes. Chemosphere 46: 665-672.
- Burreau S, Broman D (1998) Uptake of PBDEs in pike (Esox lucius) from food. Organohalogen Compd 39: 39-42.
- Ikonomou MG, Rayne S, Fischer M, Fernandez MP, Cretney W (2002) Occurrence and congener profiles of polybrominated diphenyl ethers (PBDEs) in environmental samples from coastal British Columbia, Canada. Chemosphere. 46: 649-663.
- Rayne S, Ikonomou MG, Antcliffe B (2003) Rapidly Increasing Polybrominated Diphenyl Ether Concentrations in the Columbia River System from 1992 to 2000. Environ Sci Technol 37: 2847-2854.
- Gao Z, Xu J, Xian Q, Feng J, Chen X, et al. (2009) Polybrominated diphenyl ethers (PBDEs) in aquatic biota from the lower reach of the Yangtze River, East China. Chemosphere 75:1273-1279.
- Lepom P, Karasyova T, Sawal G (2002) Occurence of Polybrominated Diphenyl Ethers in Freshwater Fish from Germany. Organohalogen Compd 58: 209-212.
- Zennegg M, Kohler M, Gerecke AC, Schmid P (2003) Polybrominated diphenyl ethers in whitefish from Swiss lakes and farmed rainbow trout. Chemosphere 51: 545-553.
- Li Q, Yan C, Luo Z, Zhang X (2010) Occurrence and levels of polybrominated diphenyl ethers (PBDEs) in recent sediments and marine organisms from Xiamen offshore areas, China. Mar Pollut Bull 60: 464-469.
- Covaci A, Gheorghe A, Hulea O, Schepens P (2006) Levels and distribution of organochlorine pesticides, polychlorinated biphenyls and polybrominated diphenyl ethers in sediments and biota from the Danube Delta, Romania. Environ Pollut 140: 136-149.
- Johnson-Restrepo B, Kannan K, Addink R, Adams DH (2005) Polybrominated diphenyl ethers and polychlorinated biphenyls in a marine foodweb of coastal Florida. Environ Sci Technol. 39: 8243-8250.
- De Boer J, Wester PG, Klamer HJC, Lewis WE, Boon JP, et al.(1998) Do flame retardants threaten ocean life? Nature 394:28-29.
- Vives I, Grimalt JO, Lacorte S, Guillamón M, Barceló D, et al.(2004) Polybromodiphenyl Ether Flame Retardants in Fish from Lakes in European High Mountains and Greenland. Environ Sci Technol 38:2338-2344.
- Asplund L, Athanasiadou M, Sjödin A, Bergman Å, Börjeson H (1999) Organohalogen substances in muscle, egg, and blood from healthy baltic salmon (Salmo salar) and baltic salmon that produced offspring with the M74 syndrome. Ambio 28: 67-76.
- Yu YX, Zhang SH, Huang NB, Li JL, Pang YP, et al. (2012) Polybrominated diphenyl ethers and polychlorinated biphenyls in freshwater fish from Taihu Lake, China: Their levels and the factors that influence biomagnification. Environ Toxicol Chem 31: 542-549.
- Tanabe S, Ramu K, Isobe T, Takahashi S (2008) Brominated flame retardants in the environment of Asia-Pacific: an overview of spatial and temporal trends. J Environ Monit 10: 188-197.
- Wang Z, Ma X, Lin Z, Na G, Yao Z (2009) Congener specific distributions of polybrominated diphenyl ethers (PBDEs) in sediment and mussel (Mytilus edulis) of the Bo Sea, China. Chemosphere 74: 896-901.
- Geyer HJ, Rimkus GG, Scheunert I, Kaune A, Schramm, et al. (2000) Bioaccumulation and Occurrence of Endocrine-Disrupting Chemicals (EDCs), Persistent Organic Pollutants (POPs), and Other Organic Compounds in Fish and Other Organisms Including Humans. In: The Handbook of Environmental Chemistry 1-166.
- Kalantzi OI, Martin FL, Thomas GO, Alcock RE, Tang HR, et al. (2004) Different Levels of Polybrominated Diphenyl Ethers (PBDEs) and Chlorinated Compounds in Breast Milk from Two U.K. Regions. Environ Health Perspect 112: 1085-1091.
- Ohta S, Ishizuka D, Nishimura H, Nakao T, Aozasa O, et al. (2002) Comparison of polybrominated diphenyl ethers in fish, vegetables, and meats and levels in human milk of nursing women in Japan. Chemosphere. 46: 689-696.
- Darnerud PO(2003) Toxic effects of brominated flame retardants in man and in wildlife. Environ Int. 29: 841-853.
Citation: Dosis I, Karamanlis X, Athanassiadis I (2018) Polybrominated Diphenyl Ethers (PBDEs) in Goby (Gobius spp.) and Sole (Solea solea) from Thermaikos Gulf, Greece. J Marine Sci Res Dev S12: 006.
Copyright: © 2018 Dosis I, et al. This is an open-access article distributed under the terms of the Creative Commons Attribution License, which permits unrestricted use, distribution, and reproduction in any medium, provided the original author and source are credited.
Select your language of interest to view the total content in your interested language
Share This Article
Recommended Journals
Open Access Journals
Article Usage
- Total views: 4131
- [From(publication date): 0-2018 - Nov 25, 2025]
- Breakdown by view type
- HTML page views: 3213
- PDF downloads: 918