Preliminary Urban Area Wind Resource Assessment and Wind Speed Data Analysis
Received: 08-Jun-2019 / Accepted Date: 01-Aug-2019 / Published Date: 08-Aug-2019
Abstract
Recently society of world is more interested in using pollution free sources of energy. Wind energy is among the renewable energy which is the most valuable and promising choice because it is abundant, renewable, environmentally friendly. Accessing characterizing and knowing the probability of the wind resource are the main aim of this work. The paper was started by selecting appropriate site; thus, the target area was Mekelle University. A secondary data collection method was used to carry out the study. Direct and indirect methods was used to analyses the collected data then extrapolated to the proposed hub height using power law. Weibull probability density function used to forecast the wind resource. From the analysis presented Winter was the windy season in both years and the annual mean wind speeds for the years 2010 and 2012 were 3.67 m/s and 3.57 m/s at height of 10 m and 4.69 m/s and 4.59 m/s at 26 m respectively. The dominant prevailing wind direction was east.
Keywords: Wind energy; Direct method; Indirect method; Weibull probability density function
Introduction
Energy plays an important role in all aspect of human beings’ dayto- day activities like household, transportation, industry, agriculture, education etc. And it is key elements for the economic and social developments of one nation. Besides its advantage, energy has negative impact on our ecosystem and our economy if we use fossil fuels or traditional source like oil, natural gas as source of energy.
Ethiopian electric power generation is largely dependent on hydropower resources. That is why the country exposes to power blackout repeatedly especially in urban areas. Therefore, this problem could be reduced by using different energy resource mix. So to explore the opportunity for wider energy mix, wind energy will be one of the best possible options. From the many reasons for the attractiveness of wind energy as described in Adaramola et al. [1] is its huge resource potential, steadily falling costs of system equipment and accessories as the technology advances and fastest growing renewable source of energy in both developed and developing countries.
In Urban area electricity black out can be reduced by installing either standalone small wind turbine around buildings or building wind mounted wind turbine on the roof or on side of building. As stated in Cai et al. [2] Building installed wind turbine to generate electricity can make full use of the wind around the buildings. As described in Aquino, et al. [3] the major benefit of developing wind energy harvesting in buildings is bringing the power plant closer to the power user.
So, in order to integrate the renewable energy technologies like wind turbines to our environment it is important to know the amount wind resource available in the selected site in which the wind turbine is being installed. As explained in Poulos [4] viability of wind turbines in urban areas is crucially dependent on an accurate understanding of the wind-flow and turbulence patterns. This applies to both selecting the right turbine design and a suitable site, and to predicting potential yield in an economic analysis.
Therefore, knowing the nature, distribution, direction, estimating the amount wind available and create familiarity with its moods is vital issue for given wind site because the main driving force for a wind turbine is the wind velocity itself. This is done using the process called wind resource assessment.
Literatures such as Albany et al. [5] defined as wind resource assessment is the process of estimating how much fuel will available for a wind power plant over the course of its useful life. This process is the single most important step for determining how much energy the plant will produce, and ultimately how much money it will earn for its owners.
The purposes of WRA as indicated in Poulos [4] is to investigate the characteristics of the wind, to identify and plan appropriate wind turbine installations, to evaluate the wind energy potential of given site, and to determine the feasibility of the proposed project.
Assessing the available wind resource and calculating the probability this available wind resource using statistical models at the proposed site and to characterize the wind resource (i.e. average wind speed, prevailing wind direction, probability of blowing, power density, wind shear, Weibull scale and shape parameters on hourly, daily monthly and seasonal bases and extrapolated to desired height was the main aim of the study.
Methodology
To achieve the above-mentioned research objectives methods and procedures have great contribution for reaching the result of the paper. The general framework used to conduct the thesis is shown in Figure 1.

Figure 1: General framework of the paper.
Description of the study area
The selected urban area is Mekelle University main campus which among the higher education and training public institution in Ethiopia located in the northern Tigray regional state in the city of mekelle. The University is located at latitude of 13.48° N and Longitude of 39.49° E at an average altitude of 2208 m.
Calculation methodology
The wind distribution is changing from day to day; hour to hours and minute to minute. Thus the Variation of wind will have a great effect on the power produced by turbine. So analyzing the data recorded by metrological instrument and knowing the behavior of wind speed parameters is important to generate electricity from wind using wind turbines. The aim of this section is to characterize the main wind speed parameters using direct and indirect methods.
Direct methods: There are a lot of parameters in wind energy data analyses calculated directly from the given metrological data. Some of them are shown in the Table 1 [6].
| S/N | Parameters | Formula | Where | Equation |
|---|---|---|---|---|
| 1 | Power available from wind (Pw) | 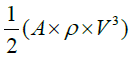 |
A=Rotor swept area, m2 (πr2), ρ=density of air (kg/m3), V=the wind velocity | (1) |
| 2 | Power generated by a wind turbine (Po) | 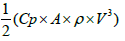 |
Cp=Maximum power coefficient, A=Rotor swept area, m2 (πr2) ρ=density of air (kg/m3) | (2) |
| 3 | Air Density (ρ) | 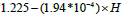 |
H=the site elevation in meters. | (3) |
| 4 | Average wind speed (Vav) | 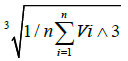 |
V=the wind velocity and n=the number of wind data (number of observations) | (4) |
| 5 | Standard deviation (v) | 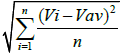 |
Vav=Average wind speed, V=the wind velocity and n=the number of wind data | (5) |
| 6 | wind power density (P/A) | 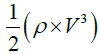 |
A=Rotor swept area, m2; (πr2),ρ=density of air (kg/m3), V=the wind velocity | (6) |
| 7 | Turbulence (TI) |  |
σ=the standard deviation of wind speed; and Vav=the average wind speed for the recording interval | (7) |
| 8 | Wind shear exponent (α) | 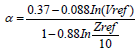 |
Vref=velocity at reference height; Zref=height at the reference height | (8) |
Table 1: Direct methods used to analysis wind data parameters with their respective formulas [6].
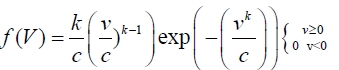
Indirect methods: There are different models or method used to analyses the wind distribution statically. However, many literatures such as Busby, Manwell et al. and Burton et al. [7-9] agreed that the Weibull distribution function is widely used and has great advantages than other probability density functions. The Weibull distribution is given by eqn. (1).
 (9)
(9)
0(v)<0
where f (V)=the frequency of occurrence Weibull random variable
C=the scale factor which is closely related to the mean wind speed
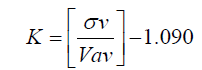
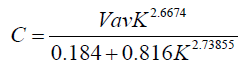
K=shape factor which is a measurement of the width of the distribution
Even if there a lot of methods used to calculate the values of K and C standard deviation method is selected on due to its simplicity. The value of K and C is calculated using eqns. (9) and (10) respectively which is called standard deviation method [6].
 (10)
(10)
Where K=shape factor
σ v =Standard deviation
Vav=Average wind speed
 (11)
(11)
Where k=shape factor
Vav=Average wind speed
Result and Discussion
Data validation and analysis the missing data
Data validation using range test: All data were reviewed for accuracy and invalid data were neglected to create a validated data set. Data’s were considered invalid if they did not fill full range test rule. All the listed variables/parameters’ listed in the recorded raw data are within the range proposed by range test except temperature. For example, the temperature for the years 2010/2011 runs between -80 and -85. Look the range test rule validation criteria in Albany et al. [5].
For the selected site, the available wind speed data were recorded from 2010 to 2014. However as can be seen from Table 1 in the appendix part in 2010 1.09% (i.e. 4/365), 65% in year 2011 ,4% in year 2012 ,52.8 % in 2013 and 62.2 % in 2014 of data were missing. Based on a study [10] the missing data should not exceed 10%. So years 2010 and 2012 will be used as input for this thesis.
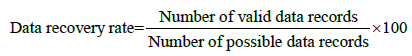
Data validation using data recovery rate: As stated in a study [11] data recovery rate is a general indicator of wind data quality. is expressed by eqn. (12) [5,11].
 (12)
(12)
N.B: Data Records Collected (valid data records)=Data Records Possible - Number of Invalid Records
As declared in Matang [12] when reporting the mean wind speed read by any one sensor over a one-month period, that sensor should have a minimum data recovery rate of 80 % for that month. Data recovery rate was calculated using eqn. (12) and the results are presented in Table 2.
| Month | Year | Total days | Total Recorded data’s | Valid | Number of possible data records | DR (%) |
|---|---|---|---|---|---|---|
| January | 2010 | 31 | 3872 | 158 | 4464 | 3.54 |
| February | 2010 | 28/29 | 4175 | 2058 | 4176 | 49.28 |
| March | 2010 | 31 | 4464 | 4363 | 4464 | 97.74 |
| April. | 2010 | 30 | 4316 | 4199 | 4464 | 94.06 |
| May | 2010 | 31 | 4462 | 4342 | 4464 | 97.27 |
| June | 2010 | 30 | 4317 | 3671 | 4320 | 84.98 |
| July | 2010 | 31 | 4459 | 4115 | 4464 | 92.18 |
| August | 2010 | 31 | 4462 | 3885 | 4464 | 87.03 |
| September | 2010 | 30 | 4316 | 3671 | 4320 | 84.98 |
| October | 2010 | 31 | 4454 | 4446 | 4464 | 99.6 |
| November | 2010 | 30 | 4320 | 4318 | 4320 | 99.95 |
| December | 2010 | 31 | 4462 | 4371 | 4464 | 97.91 |
| January | 2011 | 31 | 4464 | 4391 | 4464 | 98.36 |
| February | 2011 | 28/29 | 4032 | 3972 | 4032 | 98.51 |
| March | 2011 | 31 | 4462 | 4371 | 4464 | 97.92 |
| April | 2011 | 30 | 4318 | 4269 | 4464 | 95.63 |
| May | 2011 | 31 | 516 | 510 | 4464 | 11.42 |
| January | 2012 | 31 | 2210 | 1758 | 4464 | 39.38 |
| February | 2012 | 28/29 | 4176 | 4153 | 4176 | 99.45 |
| March | 2012 | 31 | 4463 | 4447 | 4464 | 99.6 |
| April. | 2012 | 30 | 4319 | 4266 | 4464 | 95 |
| May | 2012 | 31 | 4464 | 4384 | 4464 | 98 |
| June | 2012 | 30 | 4320 | 3962 | 4320 | 91 |
| July | 2012 | 31 | 4464 | 3941 | 4464 | 88 |
| August | 2012 | 31 | 4463 | 3533 | 4464 | 81 |
| September | 2012 | 30 | 4320 | 3732 | 4320 | 84 |
| October | 2012 | 31 | 4464 | 4438 | 4464 | 100 |
| November | 2012 | 30 | 4320 | 4279 | 4464 | 95 |
| December | 2012 | 31 | 4464 | 4441 | 4320 | 100 |
| January | 2013 | 31 | 4462 | 4377 | 4464 | 98 |
| February | 2013 | 28/29 | 4030 | 4018 | 4032 | 99.6 |
| March | 2013 | 31 | 4463 | 4444 | 4464 | 99.5 |
| April | 2013 | 30 | 2519 | 2456 | 4320 | 56 |
| October | 2013 | 31 | 496 | 494 | 4464 | 11.06 |
| November | 2013 | 30 | 3402 | 3393 | 4320 | 78.54 |
| December | 2013 | 31 | 4203 | 4162 | 4464 | 93.23 |
| January | 2014 | 31 | 2621 | 2406 | 4464 | 53.89 |
| February | 2014 | 28/29 | 2377 | 2363 | 4032 | 58.6 |
| March | 2014 | 31 | 851 | 839 | 4464 | 18.79 |
Table 2: Data validation using range test and data recovery rate of different months.
As we see in Table 2 years 2011, 2013 and 2014 already excluded from analysis. But these years some of their months’ have data recovery rate greater than 80%. So months’ were used to replace similar missing month’s in year 2010 and 2012 that data recovery rate less than 80%. For example for this journal the data for January 2010 and January 2012 was filling by taking the average values of January 2011 and January 2013 and the data for February 2010 was taken from the mean value of February 2011, February 2012 and 2013.
Characterisation of observed wind resource
Hourly and daily average wind velocity variation analysis: Wind speed at a certain location can differ between night and day. To explains the diurnal wind speed variation hourly wind speed data has been used. This was done by grouping (summing) similar hours to one side. For examples March has 31 d thus the collected data’s in 31 days starting from zero hour up to 23 hours were grouped. Look eqn. (13). The recording time stared from 00:00 mid night hour to 23:00 hour for 24 h each day based on 10-minute interval.
Average of single hour=  (13)
(13)
Where H=individual hour (0-23 h) and M=the number days in the given month starting from 1 to either 28, 29,30 or 31)
As show in Figure 2 months like June, July, August and September increase their wind speed from 7th h or 1:00 am local time to 14th h or 8:00 pm local time and starts settling down on 15th h. October starts to decrease at 12th and the rest month’s shows noticeable trend of increment in wind speed starting from 7th h to 17th h or 11:00 local time

Figure 2: Hourly distribution of average wind speed for the months of 2010 at 10 m.
In general, in both Figures 2 and 3 also most of the months increase their wind speed starting 7th h (1:00 am local time and reaches maximum at 17th h (11:00 pm local time) and start to decrease at 18th h (i.e. 12:00 pm local time). But months July and August start to decrease on 15th h (i.e. 9:00 pm) and month’s April and May start to decrease on 16th h (10:00 pm local time).

Figure 3: Hourly distribution of Average wind speed for the months of 2012 at 10 m.
Monthly average wind velocity variation analysis: From Figure 4 the maximum monthly average wind speed of the site was 5.38 m/s in the month of March 2012 while in March 2010 this value was 4.01 m/s and February was the month with maximum average wind velocity in 2010. August was the month with the minimum average wind speed for both years with mean speed of 1.16 m/s in 2012 and 1.65 m/s in 2010. The annual mean wind speed was 3.67 m/s in 2010 and 3.57 m/s in 2012.

Figure 4: Monthly variation of Average wind velocity for MU in 2010 and 2012.
Seasonal average wind velocity variation analysis for year 2010 and 2012: The minimum seasonal wind speed as shown in Figure 5 was noticed in summer (i.e. June, July and August) for both years because this season is cold or rainy season in Ethiopia. Therefore, in this season, it is better to use other source of energy options like hydropower, battery or hybrid system and the maximum wind velocity appears in winter (i.e. December, January, February) in both years (i.e. 2010 and 2012). Winter is dry season in Ethiopia.

Figure 5: Seasonal Variation of Average Wind Velocity in 2010 and 2012 G.C at MU
Daily average power density variation analysis for year 2010 and 2012: The daily power density of the site was described for 2010 and 2012. As shown in Figures 6 and 7 except few months most of the months have power density fluctuates less than 100 w/m2 which is class- I as stated [7,8].

Figure 6: Daily distribution of average wind power density for the months of 2010.

Figure 7: Daily distribution of average wind power density for the months of 2012
Frequencies distribution of the wind speeds for the measured (actual) data: As shown in Figure 8 the most the frequent mean wind velocity was the velocity which found between the interval of 4 m/s and 5 m/s it occurs for about 13828 times or it blows for 2305 hours (13830/6) and the second most frequent the velocity is velocity which found between the interval of 3 m/s and 4 m/s it occurs for about 12780 times and the third most frequent velocity which found between the interval of 0 and 1 (about 12625 times).

Figure 8: Probability of occurrence of each wind speed of actual data of 2010 and 2012.
56666Using statistical methods
Since wind, speed has stochastic behavior and to cope with its variability engineers apply statistical and probabilistic methods in design of wind turbine. Statistical methods are used calculate probability wind data for given site. In this paper, Weibull probability distribution method was used to predict the wind speed in the candidate site.
Estimation Weibull Parameters: The value of ρ, TI, α, K and C was calculated using eqns. eqns. (3), (7), (8), (10) and (11) respectively. N.B the elevation of the site is 2208 m and thus the calculated air density is about 0.96 kg/m3 (Table 3).
| month-year | Average wind velocity, m/s | Standard deviation (σ) | Shape factor (K) | Scale factor (C),m/s | Direction | Turbulence Intensity (TI) | Wind shear exponent (α) |
|---|---|---|---|---|---|---|---|
| 10-Jan | 4.53 | 0.84 | 6.29 | 4.87 | 63.05 | 0.19 | 0.25 |
| 10-Feb | 5.23 | 0.91 | 6.74 | 5.59 | 44.3 | 0.18 | 0.24 |
| 10-Mar | 4.01 | 0.85 | 5.42 | 4.35 | 123.07 | 0.21 | 0.26 |
| 10-Apr | 4.51 | 0.93 | 5.59 | 4.88 | 118.16 | 0.21 | 0.25 |
| 10-May | 3.6 | 0.82 | 5.02 | 3.92 | 119.74 | 0.23 | 0.27 |
| 10-Jun | 2.08 | 0.66 | 3.49 | 2.31 | 204.46 | 0.32 | 0.28 |
| 10-Jul | 1.99 | 0.69 | 3.17 | 2.23 | 267.95 | 0.35 | 0.32 |
| 10-Aug | 1.65 | 0.64 | 2.81 | 1.85 | 254.18 | 0.39 | 0.31 |
| 10-Sep | 2.19 | 0.58 | 4.26 | 2.41 | 154 | 0.26 | 0.28 |
| 10-Oct | 4.52 | 0.85 | 6.18 | 4.86 | 99.72 | 0.19 | 0.245 |
| 10-Nov | 5.19 | 0.9 | 6.75 | 5.55 | 107.21 | 0.17 | 0.23 |
| 10-Dec | 4.5 | 0.84 | 6.23 | 4.83 | 119.82 | 0.19 | 0.25 |
| 10-Jan | 4.53 | 0.84 | 6.29 | 4.87 | 63.05 | 0.19 | 0.25 |
| 12-Feb | 5.25 | 0.93 | 6.6 | 5.62 | 6.51 | 0.18 | 0.24 |
| 12-Mar | 5.38 | 0.95 | 6.62 | 5.76 | 6.71 | 0.18 | 0.23 |
| 12-Apr | 4.47 | 0.9 | 5.74 | 4.83 | 6.2 | 0.2 | 0.25 |
| 12-May | 3.79 | 0.79 | 5.52 | 4.1 | 5.12 | 0.21 | 0.34 |
| 12-Jun | 2.07 | 0.65 | 3.53 | 2.3 | 5.03 | 0.31 | 0.32 |
| 12-Jul | 1.44 | 0.629 | 2.47 | 1.62 | 6.24 | 0.44 | 0.33 |
| 12-Aug | 1.16 | 0.52 | 2.4 | 1.31 | 5.31 | 0.45 | 0.31 |
| 12-Sep | 1.94 | 0.56 | 3.87 | 2.15 | 4.92 | 0.29 | 0.3 |
| 12-Oct | 4.22 | 0.79 | 6.21 | 4.53 | 4.33 | 0.19 | 0.25 |
| 12-Nov | 4.22 | 0.78 | 6.3 | 4.53 | 4.36 | 0.18 | 0.25 |
| 12-Dec | 4.39 | 0.79 | 6.48 | 4.7 | 4.7 | 0.18 | 0.25 |
| Average | 3.8 | 0.81 | 5.43 | 4.11 | 75.13 | 0.25 | 0.28 |
Table 3: General monthly characteristics of wind resource of the MU site.
Wind speed frequency (occurrences) using Weibull distribution: As shown in Figure 9 the most the frequent mean wind velocities were the velocities which found between the interval of 4 m/s and 5 m/s (approximately 4.5) it occurs for about 99875.84 times. The probabilities of wind speeds below 1 m/s were zero.

Figure 9: Probability of occurrence of each wind speed using Weibull distribution year 2010 and 2012.
Comparison of measured Vs. Weibull average wind velocity distribution occurrences: As shown in Table 4 the most the frequent mean wind velocity in both cases was the velocity, which found between the interval of 4 and 5 and the chance of wind getting greater than 10 m/s and below 1 m/s at site were very rare.
| Criteria | Measured wind speed data | Weibull (predicted) wind speed |
|---|---|---|
| Most frequent wind velocity | [4-5] | [4-5] |
| Frequency of the most probable velocity | 13830 | 99875.83901 |
| Percentage | 15.90% | 26.30% |
| Least frequent wind velocity | ≥10 | [0-1] and ≥10 |
| Frequency of the least probable velocity | 81 | 0 |
Table 4: Comparison of Actual Vs. Predicted Wind Speed.
Analysis Of Wind Direction
Direction occurrence: The magnitude of wind direction in the year 2012 and 2013 was almost similar which was in range of 3° to 6.96° (i.e. comes from north) this is inconsistent because wind direction cannot blow in the same direction throughout the year. So, for wind direction, analysis year 2010 was taken as representative and conclusion was drawn based on this year. Because as recommended in Mathew S, Prasad RD and Bailey et al. [6,10,13] wind data for a period of one year recorded at the specific site is sufficient to represent the long-term variations. In this study wind direction bin of 22.5 was used and creates 16 segments as shown in Figure 10.
We now that the compass direction starts from true north (0° or 360°) and goes through, East (90°) south East (135°), South (180°), South West (225°), West (270°) and North West (315°) and others there are a lot of other direction in between these direction. From Figure 10 most of the wind direction comes from east (E) and then followed by North and the third most dominant wind direction was ESE.

Figure 10: Monthly of occurrence of wind direction for 2010.
Extrapolation of wind speed and wind power density to hub height
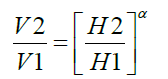
As recommended earlier [14-16] the lowest position of the rotor siting has to be at least 30% of the building height above the center of the roof. Here the maximum height considered is 19 m and the 30% of 19 m is 5.7 m. Therefore, the hub height of the turbine is the sum of 19 and 5.7 (i.e. 19 m+5.7 m=26 m). Our interest for wind power application (hub height) is 26 m. Therefore, the available wind speeds are adjusted to the wind turbine hub height using power law using eqn.(6) (Figures 11 and 12).
 (6)
(6)

Figure 11: Average wind velocity for the year 2010 and 2012 at height of 10 m and 26.

Figure 12: Average wind power density for the year 2010 and 2012 at height of 10 m and 26.
d at the reference height H1 (known wind speed)
V2=wind speed estimated at height H2, (i.e. unknown wind speed)
α=wind shear coefficient which is calculated using eqn. (8) in Table 1.
The minimum monthly average wind speed at 10 were 1.65 m/s and 1.16 m/s in the month of August for both year and these values were increase to 2.22 m/s and 1.56 m/s at height of 26 m respectively. So approximately the monthly wind speed shows 30 % increment when the height increase from 10 m to 26 m.
The minimum monthly wind power density occurs in August for both years (i.e. 2.16 and 0.75 W/m2 at 10 m) but these values increase to 5.24 W/m2 and 1.82 W/m2 at 26 m respectively. Generally, the wind power density values show approximately 100% increment when the height increases from 10 m to 26 m.
Conculsion
The wind resource changes in magnitude and strength suddenly and varies from place to place and time to time. Therefore, understanding the characteristics and mood of the wind resource, estimating and predicting its potential helps us to know economic viability of the project and selected wind turbines thus it helps us to use wind energy as alternative energy source. Because wind speed is the main driving force for wind turbines of all sizes to perform their intended tasks and due to cubic relationship between wind velocity and wind power thus even a small variation may result significant change in power so calculating the wind resource is important.
In this report, the wind energy potential at Mekelle University main campus was assessed. The historical wind data measured at 10 m height has been used to analyze hourly, daily, monthly and seasonal wind speed variation. The power law equation was used to extrapolate the measured data to the hub height. Weibull probability distribution method was used to forecast the wind resource statically. So based on the assessments (analysis) made here in the thesis the following conclusions were drawn.
1. Winds are stronger during daylight hours than at night this is due to the surface heating of earth by the sun during the day.
2. In both years (2010 and 2012) winter (“bega” in Amharic) have highest average wind summer was a season with lowest average wind speeds.
3. The site consists of primarily Classes-I, and with a very small percentage represented by class II and III at 10 m.
4. The result of turbulence and roughness exponents were in the expect range or related experimental results of urban areas as written in different literatures.
5. The frequency of the measured data and the frequency calculated using Weibull probability density function (PDF) was compared. In both cases, the most frequent and least frequent wind speeds were the speeds, which found between 4 and 5 m/s and wind speeds greater than 10 m/s respectively.
6. The frequency of the measured data and the frequency calculated using Weibull probability density function (PDF) was compared. In both cases, the most frequent and least frequent wind speeds were the speeds, which found between 4 and 5 m/s and wind speeds greater than 10 m/s respectively.
7. When the height increases the velocity of wind and the power density increases dramatically.
8. East was the prevailing wind directions.
References
- Adaramola M (2015) Wind Resources And Future Energy Security Environmental, Social,and Economic Issues. Apple Academic Press.
- Cai Y, Zhao F, Liu S (2015) Wind Field CFD Analysis on the Flat Roof of the Building. First International Conference on Information Sciences, Machinery, Materials and Energy.
- Aquino AI, Calautit JK, Hughes BR (2017) Urban Integration of Aeroelastic Belt for Low-Energy Wind Harvesting. Energy Procedia 105: 738-743.
- Mathew S (2006) Wind Energy Fundamentals, Resource Analysis and Economics.
- Busby RL (2012) Wind Power The Industry Grow Up. PennWell Corporation, United States of America.
- Manwell JF, McGowan JG, Rogers AL (2009) Wind Energy Explained Theory, Design And Application. Second Edn, John Wiley & Sons Ltd.
- Burton T, Jenkins N, Sharpe D, Bossanyi E (2011) Wind Energy Hand Book. John Wiley & Sons, Ltd.
- Prasad RD (2008) Assessment of Wind Resources and Analysis of Wind Data for Some Locations in Fiji.
- Zang MH (2015) Wind Resource Assessment and Micro-Siting Science and Engineering. China Machine Press.
- Bailey BH, McDonald SL, Bernadett DW, Markus MJ, Elsholz KV (1997). Wind Resource Assessment Handbook Fundamentals For Conducting a Successful Monitoring Program.
- Sengupta AR, Biswas A, Gupta R (2017) Vertical Axis Wind Turbines in the Built Environment. Isesco J Sci Technol 12: 11-16.
- Probala D, Sabolova B, Jeno M (2016) Urban Wind Turbines and the Possibility of their Use in Slovakia" Acta TecnologÃa. Int Sci J Technol 2: 11-16.
- Gagliano A, Nocera F, Patania F, Capizzi A (2013) Assessment of micro-wind turbines performance n the urban environments: an aided methodology through geographical information systems. Int J Energ Environ Eng 4: 43.
Citation: Kidane H, Rao SC, Gebremariam K (2019) Preliminary Urban Area Wind Resource Assessment and Wind Speed Data Analysis. Innov Ener Res 8: 232.
Copyright: © 2019 Kidane H, et al. This is an open-access article distributed under the terms of the Creative Commons Attribution License, which permits unrestricted use, distribution, and reproduction in any medium, provided the original author and source are credited.
Select your language of interest to view the total content in your interested language
Share This Article
Recommended Journals
Open Access Journals
Article Usage
- Total views: 3889
- [From(publication date): 0-2019 - Nov 23, 2025]
- Breakdown by view type
- HTML page views: 2993
- PDF downloads: 896