The Implications of Land Use/Cover Dynamics on Resources Development in Tubah Sub-Division, Cameroon
Received: 27-May-2017 / Accepted Date: 23-Jun-2017 / Published Date: 28-Jun-2017 DOI: 10.4172/2168-9717.1000204
Abstract
The environment at various scales is greatly modified through the activities of man and his dynamic science and technology. These modifications essentially constitute land use/cover changes. This paper describes the implications of land use dynamics on resource development in Tubah Sub-division over time and space from 1983 to 2013. This research has made use of remote sensing techniques and Geographic Information System (GIS) in describing land use/cover changes in Tubah Sub-division. Primary data was obtained through field observations and ground truthing in order to confirm observations on satellite imageries. Land use maps were produced using some GIS software packages such as Google Earth, ENVI 4.3, Global Mapper 15 and ArcGis 10.2. Maps were generated to show changes in Land use/cover which were transpose into tables and bar graphs to show the magnitude of changes, percentage of change and the rate of change. The analysis of static land use maps of 1983, 2000, and 2013, all pointed to the fact that, there have been significant changes observed on forest cover, farmland, grazing land and settlement land uses
Keywords: Land use/cover; Dynamics; Remote sensing techniques; Geographic information system; Resource implications; Tubah
77340Introduction
Land is central in human existence and development. Humans have used land and its resources to meet their material, social, cultural and spiritual needs. According to Molombe [1], humankind since creation has relied on land to sustain his ever changing whims and caprices. Land use is the term employed to embrace all the ways in which land is used to provide man with his needs. According to Meyer [2], land use and land cover are distinct yet closely linked characteristics of the earth’s surface. Land use is defined as any form of activity that the land is put to, such as building construction, forestry and agriculture, while land cover implies the physical or natural state of the Earth’s surface including water, vegetation, soil and/or artificial structures [3]. Land use is a direct manifestation of human endeavours, while land cover may result from natural processes or from human activities. Land use may exert a direct impact on the land cover. Human need of land resources give rise to land use which varies with the purposes it serves in terms of processing materials, provision of shelter, food production, and recreation.
Change is inevitable and this too applies to land. Mayer defines land use dynamics as conversion of land from one form to another. These changes involve modifications, either direct or indirect on the natural habitat which impacts the environment [4]. It is estimated that nearly 50% of the earth surface has been significantly transformed through human activities [5]. In this process, they have modified and are modifying land in various ways, and intensities. Natural forests and grasslands are converted into agricultural and grazing areas for crops and livestock production, or urban and industrial lands. Wetlands are drained and converted to agricultural, residential, recreational and industrial uses. Cropland undergoes intensification, marginalization and abandonment. Abandoned land may be reforested or may be degraded further. Settlements may experience urbanization, suburbanization or de-urbanization. Residential areas may be converted into commercial areas and vice versa. High income neighborhoods can be turned into slums [6]. Land use and land cover changes are strongly linked as they involve land conversion, modification, intensification and alteration. These changes occur constantly on a temporal and spatial basis as a consequence of natural and or cultural stimuli, that is, they reflect both natural and human activity. Changes in land use may not always occur as a result of planned actions but may also be an unexpected effect.
Studies so far have shown that only few landscapes on the earth are still in their natural state. Balgah, observed that there are few landscapes remaining on the earth’s surface that have not been significantly altered or are not gradually being altered by mankind for one reason or the other [7]. In the past two centuries, the impact of human activities on the land has grown enormously, altering entire landscapes, and ultimately impacting the earth's nutrient and hydrological cycles as well as the climate [8]. There are two categories of causes of land use dynamics which include: natural and anthropogenic factors. Human influence on land has resulted to the transformation of the natural land cover into artificial land cover. The growing human population has exerted increasing pressure on the landscape as demands multiply for resources such as food, water, shelter and fuel. Socio-economic activities bring about land use dynamics and these factors are dynamic. What may be a stimulus at one point in time may cease to be important subsequently. Lambin and Geist, observed that the major factors influencing land use dynamics include; natural variability, socioeconomic factors, technological factors and globalization [9].
Mannion, observed that in the past man depended on gathering and hunting of resources on land, this only led to resource manipulation rather than transformation of the land [10]. With the advent of agriculture and its subsequent spread, began the subjugation of nature which manifest as land use. Land is essential for human survival and development and land use dynamics have always been among the central themes of global change research. One of the fundamental factors which determine the quality of an environment is the use to which the land is put. Land use information is one of the essential tools for nearly all development efforts. Data on land use is very important for development purposes especially in the African continent as a large proportion of the population depends either directly or indirectly on agriculture [11].
Since the 19th Century, Tubah Sub-division has transcended from being a traditional monoculture society to a complex heterogeneous area, offering many services to its inhabitants as well as its hinterlands. It attracts a lot of people due to its economic, social and administrative functions. In Tubah, the continuous loss of rangeland, forest and farmland is not only becoming a threat to resource sustainability, but it is having a great impact on the landscape pattern, atmospheric environment, biodiversity and human vulnerability.The demand for social amenities such as roads, waste disposal sites, electricity, water as well as landed property, has noticed an exponential increase since the 1980s. As a result, there is a gradual but steady conversion of the natural landscape to meet up with Man’s modern needs in Tubah Subdivision which has implications on resource development.
The problem
The physical environment of Tubah Sub-division and its environs that knew little or no stress prior to the 1980s has witnessed a progressive change of the land cover and land use patterns. The rapid increase in population (from 29,192 person in 1976 to 65, 250, (National Office Website 2015), stand as the main driving force behind land use/cover dynamics. The main economic activity in Tubah Subdivision is agriculture; farmers and graziers have cleared off large portions of the forest with the use of fire for agricultural and grazing purposes. For instance, there has been encroachment in to protected forest area, tremendous degradation of rangelands for subsistence farming leading to farmer-grazier conflicts which is common in Bambili and on the Sabga highlands. There is high demand for land to meet the dire residential needs, commercial needs, social amenities and socio-economic infrastructures in Tubah Sub-division. This has exerted pressure on the lean resources and created a variety of complex land cover and land use dilemmas and if not controlled can degenerate to environmental crisis. These anthropogenic activities enhance development but there is a high cost on the sustainability of the resources. There also exist sporadic floods and landslides in Bambui which have caused land cover changes.
Consequently, the focus of this paper is to study the implications of land cover and land use dynamics on resource development in a bid to curb the negative aspects of these changes and suggest the way forward for sustainable land use planning and development in Tubah Sub-division.
Study area
Tubah Sub-division is located between latitudes 4°50’ to 5°20’N and longitudes 10°35’ to 11°59’E of the Green Wish Meridian [12]. Tubah is one of the five Sub-divisions making up Mezam Division in the North West Region of Cameroon. It is bordered to the North by Belo in Boyo Division, to the North West by Bafut, to the South and South East by Ndop and Balikumbat in Ngoketungia Division and to the West by Nkwen in Bamenda III Sub-division (Figure 1). Tubah has a considerable surface area of 365 km2 giving a population density of 145 persons/km2 (United Councils and Cities of Cameroon National Office Website, 2015). Tubah is made up of four main villages; Bambili, Bambui, Kedjo-ketinguh and Kedjom-keku.

Figure 1: Location of Tubah sub-division in the North West Region.
Materials and Methodology
This study employs the use of both primary and secondary data to describe land use dynamics over time and space in Tubah Sub-division from 1983 to 2013. Primary data was collected from the field with the use of a hand held Global Positioning System (GPS). Ground control points were collected from the different land use types such as forest cover, grasslands, settlements and croplands in Tubah Sub-division. The identified points were downloaded on an excel sheet and displayed on the based map of Tubah Sub-division. Reconnaissance survey and field survey were used to complement the interpretation of satellite imageries.
The dynamic nature of land use/cover processes involving vast areas made traditional methods both costly and inadequate in meeting the spatial and temporal requirements needed in assessing such changes. Past trends which could not be observe from direct field observation, had to be gotten from satellite imageries. It is against this background that the use of remotely sensed data and techniques were employed in the assessment of land use and land cover dynamics in Tubah Subdivision. Satellite imageries for three time periods, namely, 1983, 2000 and 2013 were used. Land use maps were produced using some GIS software packages such as Google Earth, ENVI 4.3, Global Mapper 15 and ArcGis 10.2.
First, Google Earth was used to locate the study area where the GPS coordinates of its Limits were obtained. These coordinates were later on used to download raster and elevation data for the area as well as satellite images from the Global Land Cover Facility website. Landsat ETM image Files of 1983, 2000 and 2013 were downloaded and the various bands for each year were modulated and corrected to reveal settlements, roads, farmlands and other geographic features using ENVI 4.3. Open Street maps were also downloaded using Global Mapper 15 to help reveal the road network, names of towns and villages in the area. These images were later exported to Global Mapper 15 where the visible features of interest were digitised and their shape files exported to ArcGIS 10.2 where they were assembled together with the raster and elevation data to produce the maps for each year as JEPG files. The polygons representing the various parameters were measured using ArcGIS 10.2 and computed using M.S Excel 2013. The method of classification used was the supervised classification. Based on the prior knowledge of the study area and a brief reconnaissance survey with additional information from previous research in the study area, a classification scheme was developed forthe study area after Anderson et al. [13]. In this regard, an appropriate land use and land cover classification scheme was selected that takes into consideration the characteristics of the area. For this study, only the major land use/cover classification scheme was used not the very specific types. The land use/ cover types for this study are presented in Table 1.
| Primary classes Level I | Secondary classes Level II | Description of the classes |
|---|---|---|
| Agricultural lands | Farmland Grazing land | Cultivated land includes most flat areas and also some steep slopes where various food and cash crops are grown, either on a rain-fed basis or using irrigation. Both active and seasonal farming areas. Grazing land is evident to land units allocated as a source of animal feed, including privately and communally owned grazing areas. |
| Vegetal cover | Forest cover Grassland | Areas covered with natural tree cover forming close canopy and punctuated by hills with alternating forest patches and grasses. Grasslands are areas covered with permanent grasses, shrubs and thorny bushes. |
| Settlement | Urban settlement Rural settlement | Areas with dense housing and availability of socio-economic and political services. Habitable areas with low housing density such as villages with isolated dwelling structures. |
Table 1: Land use-land cover (LULC) classification scheme for change detection.
To determine the rate of land use/cover changes the magnitude of change, percentage of change and the annual rate of change were calculated.
The magnitude of change for each LULC class was calculated by subtracting the area coverage of the second year from that of the initial year as shown by equation 1;
1. Magnitude = Land use situation of the New Year – the land use situation of the previous year
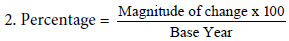
Percentage change (trend) for each LULC type was then calculated by dividing magnitude change by the base year (the initial year) and multiplied by 100 as shown by equation 2:
In obtaining annual rate of change for each LULC type, the percentage change was divided by 100 and multiplied by the number of study year 1983-2000 (17 years), 2000-2013 (13 years) as appropriately using equation 3.
3. Annual rate of change = percentage change x Difference in the study year.
Results and Discussion
The land use/cover situations were examined for the three time periods; 1983, 2000 and 2013 in Tubah Sub-division. This was gotten from Satellite imageries that were downloaded and LULC static maps were produced using the GIS Packages and from the Maps tables were produced.
Human demands for agricultural products increased rapidly and their impacts on the landscape became noticeable. Agriculture dominated the land use pattern of Tubah Sub-division occupying the largest surface area as majority of the inhabitants depended on it for their livelihood. Farmland occupied 167.74 km2 and grazing occupied 106.89 km2, followed by forest cover with 70.94 km2 to settlement with 19.8 km2 as seen in Table 2 and Figure 2.
| LULC | 1983 | 2000 | 2013 | |||
|---|---|---|---|---|---|---|
| Area in km2 | Area in % | Area in Km2 | Area in % | Area in Km2 | Area in % | |
| Settlement | 19.8 | 5.4 | 31.05 | 8.5 | 43.03 | 11 |
| Forest | 70.94 | 19.4 | 62.87 | 17.2 | 59.02 | 16.1 |
| Farming | 167.74 | 46 | 178.89 | 49 | 181.14 | 49.6 |
| Grazing | 106.89 | 29.2 | 92.56 | 25.3 | 82.18 | 22.5 |
| Total | 365.37 | 100 | 365.37 | 100 | 365.37 | 100 |
Source: Derived from Satellite (Landsat) and Google Earth Imageries: 1980s, 2000 and 2013.
Table 2: LULC Static Situations for Tubah Sub-division for 1983, 2000 and 2013.

Figure 2: Static land use-land cover situations for Tubah sub-division in 1983.
In the year 2000, the land use pattern of Tubah Sub-division had undergone significant changes; these could be accounted for, in part, by the increase in human population from 29,192 in 1976, it rose to 54,000 in 2000 (MINEPAT, 2010). Like in the case of 1983, farmland still dominated the land use categories in Tubah Sub-division. Farmland witnessed an increase in surface area to 178.89 km2 indicating 49% of the total surface area. This was followed by grazing land which dropped to 92.56 km2 accounting for 25.3% of the total surface area. Forest cover dropped to 62.87 km2 giving a percentage of 17. This reduction in forest land cover could be explained by the fact that the natural forest of Tubah Sub-division was giving way to agricultural activities like crop cultivation, animal grazing, settlements, as well as the harvesting of fuel wood needed by the inhabitants. Settlements at this time increased greatly to 31.05 km2 accounting for 8.5% of the total surface area of Tubah Sub-division. This can be seen in Table 2 and Figure 3.

Figure 3: Static land use-land cover situations of Tubah sub-division (2000).
In 2013, the population of Tubah Sub-division which was about 54000 in the year 2000 later increased to 73,890 in 2013 (MINEPAT, 2010 and United Councils and Cities of Cameroon National Office Website)). This increase in population meant an increase in land uses and functions with existing land uses being intensified and new land uses cropping up. Settlements increased rapidly to meet the needs of the rising population. Coupled with the fact that, part of Tubah Subdivision has been considered as urban (Bambili and Bambui), this has, therefore, resulted to tremendous increase in urban functions like schools, hospitals, banks, among other services. Based on the analysis in Table 2 and Figure 4, settlement land use increased rapidly to 43.05 km2 indicating 11.8%. Farmlands witnessed a steady increase in area coverage to 181.14 km2 indicating 49.6% surface area coverage. This increase in farmlands is accounted for by the opening of new farm lands especially in mountainous and grassland areas. Generally, the forest coverage in 2013 dropped to 59.02 km2, accounting for 16.1% of the surface area. This drop in forest cover can be accounted for by an increase in settlements and farmlands taking up part of the forest land. Grazing land dropped to 82.18 km2, accounting for 22.5% of the surface area. These changes can be accounted for by the increase demand for land by the growing population of Tubah Sub-division.

Figure 4: Static land use-land cover situations for Tubah sub-division in 2013.
The percentage of LULC evolution for Tubah Sub-division for 1983, 2000 and 2013 can be presented on a bar graph in order to depict clearly the situations (Figure 5).

Figure 5: Percentage of LULC evolution in Tubah sub-division for 1983, 2000 and 2013.
Land use/cover dynamics in Tubah sub-division
In describing land use/cover dynamics in Tubah Sub-division over the 3 time periods (1983, 200 and 2013), the different land uses and land cover have to be compared. An overlay map was drawn to identify only those LULC that changed from one use to another from; 1983- 2000, 2000-2013 and 1983-2013 (Table 3).
| Land Use-Land cover | 1983-2000 | 2000-2013 | 1983-2013 | |||
|---|---|---|---|---|---|---|
| Magnitude of change in Km2 | % of change | Magnitude of change in Km2 | % of change | Magnitude of change in Km2 | % of change | |
| Settlement | 11.25 | 56.8 | 11.98 | 38.6 | 23.23 | 117.32 |
| Forest | -8.07 | -11.4 | -3.85 | -6.1 | -11.92 | -16.8 |
| Farming | 11.15 | 6.65 | 2.25 | 1.25 | 13.4 | 7.9 |
| Grazing | -14.33 | -13.4 | -10.38 | -11.2 | -24.71 | -23.11 |
Source: Calculated from static Land Use Maps of Tubah Sub-division (1983, 2000 and 2013).
Table 3: Land Use/Cover Dynamics (1983-2013).
Land use/cover dynamics (1983-2000)
Tubah Sub-division has undergone remarkable changes in its land use/cover situation over time and space since 1983 to 2000. The magnitude of change in the land use/cover categories is shown in Table 3. Settlement land use increased from 19.8 km2 (5.4%) in 1983 to 31.05 km2 (8.5%) in 2000. This indicated a magnitude change of 11.25 km2 (56.8%) increase in settlement with an annual change rate of 0.67%, this situation was visible in Bambili and Bambui where settlement increased at the expense of forest, grazing land and farmlands.
Forest land use decreased steadily from 70.94 km2 (19.4%) in 1983 to 62.87 km2 (17.2%) in 2000. This accounted for a magnitude change of -8.07 km2 (-11.4%) decrease in forest cover with an annual change rate of -0.47%. During this period, forest cover in Kedjom Keku and Bambili gave way in favour of farmlands and settlement land use.
Farmlands increased from 167.74 km2 (46%) in 1983 to 178.89 km2 (49%) in 2000. This indicated a magnitude change of 11.15 Km2 (6.65%) increase in the area covered by farmland with an annual change rate of 0.65%. During this period, farmlands increased steadily in the Subdivision at the expense of forest cover and grazing lands.
Grazing land decreased from 106.89 km2 (29.2%) in 1983 to 92.56 km2 (24.3%) in 2000. This indicated a magnitude change of -14.33 km2 (-13.4%) decrease in the area covered by grazing with an annual change rate of -0.84%. Grazing land in Sabga, Kedjom Ketinguh and Bambili gave way to farmlands and settlements.
Land use/cover dynamics: 2000-2013
Tubah Sub-division has undergone significant changes in the land use-land cover from 2000 to 2013. The magnitude of change among the land use-land cover categories is shown in Table 3. The settlement land use of Tubah Sub-division witnessed a further expansion from 31.05 km2 (8.5%) in 2000 to 43.03 km2 (11.8%) in 2013. This indicated a magnitude change of 11.98 km2 (38.6%) increase in the area covered by settlements at an annual change rate of 0.9% at the expense of forest cover, farmlands and grazing lands.
Forest cover dropped from 62.87 km2 (17.2%) in 2000 to 59.02 km2 (16.1%) in 2013. This indicated a magnitude change of -3.85 km2 (-6.1%) decrease in the area covered by forest with an annual change rate of -0.3% in favour of farmlands and settlements.
Farmland witnessed a steady increase in land use over time from 179.89 km2 (48.9%) to 181.14 km2 (49.6%). This indicated a magnitude change of 2.25 km2 (1.25%) increase in farmland with an annual change rate of 0.1% at the expense of forest cover and grazing lands.
Grazing land decreased from 92.56 km2 (25.3%) to 82.18 km2 (22.5%). This accounted for a magnitude change of -10.38 km2 (-11.2%) decrease in gazing land in Tubah Sub-division with an annual change rate at -0.8% in favour of farmlands and settlements.
Land use/cover dynamics: 1983-2013
The overall changes in land use from 1983 to 2013 have been significant in the study area; this change is presented in Table 3 and Figures 5. The settlement land use doubled from 19.8 km2 to 43.03 km2. This indicated a magnitude change of 23.23 km2 (117.32%) increase in settlement land use with an annual rate of change of 0.7% at the expense of forest cover and grazing land. Forest land use decreased from 70.94 km2 (19.4%) to 59.02 km2 (16.1%). This indicated a magnitude change of -11.92 km2 (-16.8%) decrease in forest cover with an annual rate of change of -0.4% in favour of farmlands, grazing and settlements. Farmland increased steadily from 167.74 km2 (46%) to 181.14 km2 (49.6%). This indicated a magnitude change of 13.4 km2 (7.9%) increase in farmland in Tubah Sub-division with an annual change rate of 0.4% at the expense of forest and grazing land. Grazing land witnessed a steady decrease in area coverage from 106.89 km2 (29.2%) to 82.18 km2 (22.5%). This accounted for a magnitude change of -24.71 km2 (-23.11%) decrease in surfaced area covered by grazing with an annual change rate of -0.8% in favour of settlement and farmlands (Figure 6).

Figure 6: Land use dynamics 1983-2013. Source: Derived from land use-land cover maps of 1983 and 2013.
The bar graph depicting the overall percentage change of LULC for Tubah Sub-division for 1983-2013 shows a clear picture of the situation (Figure 7). It indicates the increased in settlement and farm lands at the expense of forest cover and grazing land [14].

Figure 7: Magnitude of change among LULC patterns in Tubah sub-division: 1983-2013.
The land use land cover statistics in Tubah Sub-division indicates that there has been a steady growth in settlement and farmlands at the expense of forest cover and grazing lands from 1983 to 2013. According to Balgah [15], these changes can be accounted for by man’s activities to meet up with his ever increasing needs, the yearning for food crops, and social, economic, political or financial prosperity. These have implications on the resource development in Tubah Subdivision which urges planners to put forward strategies for sustainable land use planning.
Sustainable land use planning for Tubah sub-division
One of the most significant challenges in this century relates to management of the transformation of the earth’s surface occurring through changes in land use and land cover. Land use changes with subsequent alterations on the environment will proceed at a faster rate in the coming decades in Tubah Sub-division as the population continues to grow and with improvement in technology. There will be continuous mismanagement of soils, inadequate land use policies, ineffective implementation of soil management and conservative policies and so on, hence, the hope of the future generation to meet their needs will be shattered. Therefore, there is need for sustainable land use planning which will contribute to the realization of sustainable resource development and facilitate the allocation of land to the use(s) that provide thegreatest sustainable benefits to the population.
Land use planning involves the systematic assessment of land and water potential, alternative land use, economic and social conditions in order to select and adopt the best land use options [16]. For Tubah Sub-division to make optimum use of the land resources, it is imperative to develop policies that take into account the land resource base, population changes and the interest of the local people. Land use planning is being carried out in Tubah Sub-division through planning for recreation, waste disposal, transport, settlements, prime agricultural land and protection of forest and watershed areas among others, but there is little follow up resulting from haphazard development. Consequently, land use planning is very important to protect and exploit the natural resources in a development like the intensification of agriculture, agro-industrial activities, and industrial and service activities. To achieve sustainable land use planning with positive implications on resource development, the transport sector in Tubah Sub-division has to be improved upon and designed for environmental compatibility uses/mode. To develop a sustainable master plan that will enhance the resources development base, land capability and suitability studies must be carried out in Tubah Subdivision.
Land involves terrestrial, semi aquatic and aquatic landscapes, therefore, a land capability study is important in order to sustain these land resources. Land capability is the ability of the land to support a given use, based on evaluation of the physical, chemical, biological characteristics of the land including topography, soil, vegetation and drainage [17]. It involves an evaluation of the degree of limitation posed by permanent or semi-permanent attributes of land to one or more land uses. It is essentially a negative approach whereby as the degree of constraint increases, the capability of land decreases. So, land use planners aided by the council authorities in Tubah Sub-division should carry out an in-depth resource inventory on the soil profile and landscape characteristics such as soil thickness, colour, texture, structure, coarse fragments, field pH, aspects, stoniness and vegetation cover. The results obtained should be combined with a good mastery of the technology of the inhabitants derived from their direct interaction with the environment as to put in place a land capability classification which indicates areas which will support a given change in land use without affecting negative resource development. Land capability classification is primarily supportive to land use planning; for instance, it balances the need for agricultural land against urban development or forest cover against agriculture or pasture development. In doing this, the land capability classification has made important contributions to the development of land use planning and resource management.
Land suitability classification is another element to be implemented in Tubah Sub-division. There is need for an overall land suitability assessment of the various land uses to determine the appropriateness of a given area to carry out land use activities. Land suitability is the fitness of a given type of land for a specified kind of land use (FAO, 1983). Land suitability is determine by looking at the different aspects of the landscape such as steepness of slope, parent material, soil composition, flooding potential and other aspects such as proximity to streams, water and wetlands. The result of the analysis should be presented in a land suitability map to show areas with high to low constraints to resource development. The high ratings indicate areas with no constraints to resource development while the low ratings indicate that the area is not suitable for such developmental purpose. The clearance of forest cover and watersheds for agriculture in areas as Abongfen, Alegafor and keffem will be highly profitable in the short-run but have resulted to soil erosion, progressive pasture degradation and adverse change in river regimes downstream. Such consequences outweigh the shortteam profitability and cause the land to be classed as not suitable for such resource development purposes in Tubah Sub-division.
However, sustainable land management (SLM) is the best alternative towards managing the land to mitigate environmental problems and resource development conflicts. SLM is a knowledgebased procedure that helps integrate land, water, biodiversity and environmental management to meet the rising food and fibre demands while maintaining sustainable ecosystem services and livelihoods. SLM is necessary in order to meet the requirements of the growing population in Tubah Sub-division. Improper land management can lead to land degradation and a significant reduction in a sustainable manner so as to meet the needs of the future generation.
A master plan is a legal instrument for urban housing planning and development in operationalising urban renewal, monitoring and controlling landuse and eliminating incompatible land uses. Tubah Sub-division has a master plan, but with problems imbedded in it as it was developed without an understanding of the necessary physical and cultural constraints; results from questionnaire analysis revealed that 61.1% were of the opinion that people use land as they desire, 35.4% were aware of the land use planning regulations and adhered to it while 3.5% had no idea about land use planning. This indicates that the planning regulations have not been well implemented in Tubah due to ignorance of the population. Therefore, there is misuse or abuse of resources due to the different allocation of land uses. There is dire need to protect and restore prime agricultural lands and residual upland forest watershed areas and marginal lands for posterity. There is need for town planners and council officials to sensitise the population on various town planning regulations through the organization of seminars to ensure that they undertake their respective activities in conformity to the tenets of the master plan. This will avoid situations of multiplicity of conflicting land uses and consequent mismanagement of resources which will usher untold suffering on the population.
The transport sector is very fundamental to land use dynamics and to resource development. It is important for planners to recognised the potential of rural-urban linkages and the great role it plays in poverty alleviation [18]. Consequently, the land use changes caused by the improvement in the transport sector should have a positive impact on resource productivity and service function [19]. The sustainable land use management system should be implemented in achieving sustainable development goals for Tubah Sub-division. Sustainable land uses can only be achieved by planning and managing land sustainably. To minimize the environmental problems and resource degradation, the most efficient trade-offs and an appropriate choice is to link social and economic development to environmental protection and enhancement.
In order to achieve a sustainable land use planning, there is need for a monitoring committee to follow up all the plans that have been implemented in Tubah Sub-division and to review and revised other plans to achieve sustainable resource development due land use dynamics. A sustainable town planning document must involve a master plan, a land use map drawn from interpreting soil and landscape characteristics for land suitability and capability classification [20-22].
Conclusion
Land use dynamics is an inevitable phenomenon which occur on temporal and or on permanent basis. These changes are necessary for economic development and social progress, but often come at a substantial cost on the environment and resources. A spatial-temporal analysis of land use/cover has been carried out in Tubah Sub-division from 1983 to 2013. The land use maps and interpretations all point to the fact that significant changes in land use/cover have been observed on the forest cover, farmland, grazing land and settlement. It revealed that the forest cover and grazing land witnesses a steady decline in favour of settlement and farmland. This was manifested through agricultural expansion, multiplicity of uses such as construction of roads, schools, hospitals among others which are attracting more people into Tubah who at the end demand more land for settlement and resources. These changes in land use/cover has introduced a host of environmental and resources issues ranging from loss of biodiversity, reduction in water quantity and quality, landslide, flooding and other socio economic impacts such as land use conflicts and haphazard development which has impacts on resource development.
This article has therefore, provided substantial and unique source of information to the administrators of Tubah and Cameroon at large. The results and methodology will increase awareness of the significant role of resource information in development efforts, as well as the roles which remote sensing can play in the study of environmental resource problems. The article has also provided increased proficiency to the application of remote sensing and cartographic techniques for resource inventory, planning, and evaluation and development studies.
References
- Molombe JM (2011) Land Tenure Systems on Urban Growth and Development in the Limbe Municipality. Unpublished M.Sc. Thesis, FSMS, University of Buea.
- Meyer WB (1995) The Nature and the implications of environmental change past and present land use and land cover in USA. Consequences 1: 1.
- Ellis E (2007) Land-use and land-cover change. The Encyclopedia of Earth.
- Meyer WB (1996) Human Impact on the Earth. Cambridge University press London.
- Lambi CM, Balgah SN (2010) Reflections on the Changing Land Use in Some Grassland Rural Environments of the North West Region of Cameroon. African Journal of Social Sciences 1: 7-22.
- Briassoulis H (2000) Analysis of Land Use Change Theoretical and Modeling Approaches. In the Web Book of Regional Science S Loveridge, West Virginia University, Morgantown.
- Balgah SN (2007) Population Growth and Land Use Dynamics in Buea urban Area. Loyola Journal of Social Science, p: 1.
- Lambin EF, Geist HJ, Lepers E (2003) Dynamics of Land-use and Land-cover Change in Tropical Regions. Annual Review of Environmental Resources 28: 205-241.
- Lambin E, Geist H (2007) Causes of Land-use and Land-cover Change. The Encyclopedia of Earth.
- Mannion AM (2002) Dynamic World Land Cover and Land Use Changes. Oxford University press Inc.
- Adeniyi PO (1979) Application of Remote Sensing to Land Use Studies. An article presented to the UN/FAO Regional Training Seminar on Remote Sensing Applications, Ibadan, Nigeria.
- Ndenecho EN (2009) Implications of Fuel Wood Yield, Availability and Harvest in Tubah Mountain Forest, Cameroon. Global Journal of Human Social Science 10: 49-55.
- Ande rson JR, Hardy EE, Roach JT, Witmer RE (1967) A Land Use and Land Cover Classification System for Land Use with Remote Sensor Data. Geological Survey Professional, United State, Washington.
- Anderson LE (1996) The Causes of Deforestation in Brazilian Amazon. Journal of Environment and Development, pp: 309-328.
- Balgah SN (2005) Land Use and Land Cover Dynamics in Buea and Tiko Sub-Division Cameroon. Unpublished Ph. D Thesis, Faculty of Social and Management Sciences, Department of Geography, University of Buea.
- FAO/UNED (1999) The Future of our Land Facing Challenges. Guidelines for integrated planning for Sustainable management of Land Resources, Rome.
- Un-Habitat (2003) Global Report on Human Settlements The Challenge of Slums. United Nations Human Settlement Programme, pp: 11-17.
- Lambi CM (2001) Changing Land Use in Batie Hill of the West Province of Cameroon. Journal of Applied Social Sciences 2: 24-40.
- Lambi CM, Takang RT (2010) Land Use Dynamics on the Eastern Slopes of Mount Cameroon. African Journal of Social Sciences, AJOSS 1: 20-35.
- Lambi CM, Kah EF (2012) Application of Remote Sensing in the Evaluation of Land use Dynamics in the Mount Cameroon Region. AJOSS 3: 4-27.
Citation: Nguh BS, Maluh NB (2017) The Implications of Land Use/Cover Dynamics on Resources Development in Tubah Sub-Division, Cameroon. J Archit Eng Tech 6: 204. DOI: 10.4172/2168-9717.1000204
Copyright: © 2017 Nguh BS, et al. This is an open-access article distributed under the terms of the Creative Commons Attribution License, which permits unrestricted use, distribution, and reproduction in any medium, provided the original author and source are credited.
Select your language of interest to view the total content in your interested language
Share This Article
Recommended Journals
Open Access Journals
Article Tools
Article Usage
- Total views: 8717
- [From(publication date): 0-2017 - Sep 01, 2025]
- Breakdown by view type
- HTML page views: 7603
- PDF downloads: 1114