The Technical Efficiency of Tunisian Ports: Comparing Data Envelopment Analysis and Stochastic Frontier Analysis Scores
Received: 13-Jul-2018 / Accepted Date: 12-Sep-2018 / Published Date: 15-Sep-2018 DOI: 10.4172/2155-9910.1000261
Keywords: Efficiency; Data Envelopment Analysis (DEA); Stochastic Frontier Analysis (SFA); Tunisian seaports
Introduction
Maritime transport is the backbone of the world globalization and trade because 80 per cent of the volume of international trade in goods is carried by sea [1]. The maritime transport provides efficient and lowcost means of transporting goods, which help create prosperity among nations and peoples and facilitates trade. The advantage of seaway is safety, speed, comfort, and the ability to manage heavy traffic of goods and passengers at relatively low prices.
Efficiency is the success with which a Decision Making Unit (DMU) uses its inputs to produce outputs. In simple terms, efficiency can be simply defined as the ratio of output to input.
Farell [2] proposed that the efficiency of a DMU consists of two components, technical efficiency, which reflects the ability and willingness of a firm to maximize its output from a given set of inputs and allocative efficiency which reflects the ability and willingness of the firm to use the inputs in optimal proportions for given factor prices. Economic efficiency or total efficiency is determined by the product of the technical and allocative efficiency.
A review of previous studies shows that the majority of the studies focused on the seaports in Europe [3-6] and Asia [7,8]. Nevertheless, none of these studies has focused on North Africa so far. Tunisia has 7 commercial ports (Bizerte, Goulette, Rades, Sousse, Sfax, Gabes and Zarzis). Their complementarity and exceptional location can accommodate various types of ships and treat all types of merchandise. Hence, it is important to study and evaluate the efficiency of the Tunisian ports as this country is witnessing significant development in port legislation and is setting many investment plans in port infrastructure like the new project of Enfidha port which is dedicated to receive panamax and post-panamax ships.
The objective of this paper is to investigate the technical efficiency of 7 ports in Tunisia by using two methodologies: the Data Envelopment Analysis (DEA) and the Stochastic Frontier Analysis (SFA). The analysis of technical efficiency in this research covers DEACCR [9], DEABCC [10] and SFACD (Cobb-Douglas function).
Moreover, we propose the input-oriented DEA model to minimize the inputs while the given current output remains the same if we look at the inefficiency in terms of excess inputs.
This study is organized as follows. In section 2, we present the of DEA and SFA methodologies. In section 3, we give a review of studies on measurement of port efficiency. We describe the data and present the results of empirical study in section 4. Finally, section 5 concludes this paper.
In the fast twenty years, a significant part of the literature on ports has focused on seaport efficiency. Most of the studies focused on seaports in Europe [3,5,11] and in Asia [7,8] but few dealt with the efficiency in the African and in the Middle East seaports. Thus, the majority of studies use both DEA and SFA methodologies to measure the efficiency of seaports.
Empirical port efficiency by using DEA
The first researchers who attempted to use the DEA to analyze the seaport efficiency are Hayuth and Roll [12]. They used cross-section data to estimate the efficiency of 20 seaports. Their work was limited to the application of the DEA-CCR, which is a standard DEA model.
Martinez et al. [11] classified 26 Spanish ports into three groups namely high, medium and low complexity ports. These authors examined the technical efficiency of these ports by using the DEA-CCR and DEA-BCC models. They conclude that high complexity seaports were associated with high efficiency.
Applying both DEA-CCR and DEA-additive models, Tongzon [13] estimated the technical efficiency of four Australian and twelve international ports for the year 1996. He concludes that Melbourne, Rotterdam, Yokohama and Osaka are the most inefficient ports in the sample.
By using a cross-sectional data for the year 1998, Valentine and Gray [14] applied the DEA-CCR model to determine the relationship between port efficiency with a particular type of ownership and organizational structure of 31 container seaports among the world’s top 100 container seaports in 1998.
Barros and Athanassiou [3] employed both DEA-CCR and DEABCC to estimate the efficiency of 4 Portuguese and 2 Greek seaports. The writers conclude that the majority of the seaports are efficient, with the sole exception of Thessaloniki.
By using DEA window analysis, Park [15] estimated the efficiency of 11 Korean container terminals for a period of three years 1999-2002. The data include the total quay length, the number of cranes, the size of yard areas, the size of the labour force, the size Lifts per Calls (LPC) storage, Net Berth Productivity (NBP) as inputs. The cargo throughput and the terminal capacity are used as outputs.
By using a cross-sectional data for the year 2002, Cullinane and Wang [4] applied the DEA-CCR and DEA-BCC models to estimate the efficiency of 69 container terminals with an annual throughput of over 10,000 TEUs in Europe. The general conclusion is that the terminals are inefficient.
Regarding the research applied to Africa and the Middle East, Al- Eraqi et al. [1] used the Standard Data Envelopment Analysis (DEA) and DEA Window Analysis to study the technical efficiency of seaports. Cross-sectional and panel data from 2000 to 2005 were collected for each of the twenty-two seaports in the Middle East and East African region. They reveal that the DEA-BCC model provides higher efficiency scores than the DEA-CCR model and they also conclude that the ports of Khor Fakkan and Djibouti are the most efficient.
Both DEA-CCR and DEA-CCR models were applied by Munisamy and Singh [7] to analyze the technical efficiency of 69 container ports in the Asian region. They concluded that most of the efficient ports in Asia are located in Bangladesh, Philippines, China, Cambodia, India and Singapore.
Rajasekar and Deo [8] have applied the Standard Data Envelopment Analysis (DEA) and DEA-Additive models to examine the technical efficiency of selected major ports in India for the period between 1993 and 2011. They concluded that the size is not a determinant factor for port efficiency i.e. bigger ports Jnpt, Mormugao and smaller ports Tuticorin and Ennore were proved to have efficient port operations all through. Table 1 below presents the studies conducted using the DEA method.
| Authors | Method | Units | Inputs | Outputs |
|---|---|---|---|---|
| Hayuth and Roll [12] | DEA-CCR model | Hypothetical numerical example of 20 ports | Manpower, capital, cargo uniformity | Cargo throughput, level service, consumer satisfaction, ship calls |
| Martinez et al. [11] | DEA-BCC model | 26 Spanish ports, 1993-1997 | Labour expenditure, depreciation charges, other expenses | Total cargo moved through docks, revenue obtained from rent of port facilities |
| Tongzon [13] | DEA-CCR additive model | 4 Australian and 12 other international container ports for the 1996 | Number of cranes, number of container berths, number of tugs, terminal area, delay time, labour, | Cargo throughput, ship working rate |
| Valentine and Gray [14] | DEA with CCR model | 31 container ports out of the world’s top 100 container ports for the year 1998 | Total length of berth, And container berth length | Number of container, total tons throughout |
| Barros and Athanassiou [3] | DEA-CCR and BCC | 2 Greek and 4 Portuguese | Number amount of workersand capital | Number of ships, movement of freight , cargo handled, container handled |
| Park [15] | DEA window | 11 Korean container terminals, 1999-2002 | Total length of quay, number of cranes, size of the yard areas, size of the labour force, LPC (lifts per calls), NBP(net berth productivity) | Cargo throughput, terminal capacity |
| Cullinane and Wang [4] | DEA-CCR and BCC | 69 container terminals in Europe for the year 2002 | The terminal length, size of the terminal area, equipment | Container throughput |
| Barros [5] | DEA-CCR and BCC | 24 Italian seaports, 2002-2003 | Number of personnel, the capital invested, value of the operational costs | Liquid bulk, solid bulk, number of containers, number of ships, total receipt |
| Al-Eraqi et al. [1] | Standard DEA and DEA window | Middle East and East Africa, 2000–2005 | Berth length, storage area, handling equipment | Ship calls , cargo throughput |
| Munisamy and Singh [7] | DEA-CCR and BCC | 69 container ports in the Asian region for the year 2007 | Berth length, terminal area, total refers points, total quayside cranes, total yard equipment | Total throughput |
| Rajasekar and Deo [8] | Standard DEA and DEA-Additive | 8 ports in India, 1993 -2011 | The number of berths, berth length, number of equipments and number of employees | Container throughput in TEU, total traffic |
| Zheng and Park [16] | DEA-CCR and BCC | 30 seaports for the year 2014 | Berth length, yard area, number of quay cranes and number of yard cranes | Container throughput in TEU |
| Hanaa Abdelaty [17] | Standard DEA | 9 seaport in Saudi Arabian for the year 2014 | Ports imports, number of discharged vessels and number of berth | Number of loaded vessels and ports exports |
Table 1: Literature review of DEA studies.
Recently, Zheng and Park [16] evaluated the efficiency of 30 seaports in 2014 with using the DEA-BCC and DEA-CCR models. They concluded that the efficiency of major terminals in Korea (DEACCR: 0.815, DEA-BCC: 0.886) showed similar efficiency with China’s terminals (DEA-CCR: 0.817, DEA-BCC: 0.887).
Hasan Esmai [17] applied the Standard Data Envelopment Analysis (DEA) of nine seaport in Saudi Arabian. They used two output and three inputs to measure of port performance for the year 2014. The writer concluded that Jazan port is considered inefficient plus most of the ports are also inefficient.
Empirical port efficiency by using SFA
Among the applications of SFA to the port industry, Liu [18] used the technical efficiency with a translog production function to test the hypothesis which states that the public sector ports are less efficient than private ones. A set of panel data relating to the outputs and inputs of 28 British ports over the 1983-1990 period was used.
The translog cost function was used by Coto Millan et al. [19] to estimate the economic efficiency of 27 Spanish ports from 1985 to 1989. They concluded that smaller ports are more efficient. These authors claimed that this is not so much due to size, but to the level of autonomy: ports with smaller autonomy are considered to be highly efficient.
By using the cross-sectional and panel data versions, Cullinane and Song [20] applied the SFA with Cobb-Douglas cost function to access the privatization achievement of 5 Korean and UK container terminals. For inputs, they took the managerial service, the employees’ salaries, the capital cost of terminal operations, the net book value of mobile and cargo and handling equipment. For outputs, they took the turnover derived from the provision of container terminal services, but excluded property sales.
Tongzon and Heng [21] used the Cobb-Douglas production to measure the efficiency levels of 25 container ports/terminals and examine the relationship between port efficiency and port specific characteristics. They concluded that the private sector participation in the port industry can to some extent improve the port operation efficiency, which will in turn increase port competitiveness.
By using the translog cost function, Barros [22] analyzed the extent of the technical change and technical efficiency in Portuguese seaport for the 1999-2000 period. His results showed an average score of inefficiency of 39.6%, denoting a high degree of waste in the management of seaports. The inputs include the price of labour and of capital. The outputs included the number of ships and the total cargo.
Applying the Cobb-Douglas production function, Sun et al. [23] estimated the efficiency of the container port production. Annual panel data from 1997 to 2005 have been collected for each of the eightythree container terminal operators. Their inputs were the handling capacity between the ship and the quay, the handling capacity between the quay and the yard, the number of berths, the length of quay lines, the terminal area, the storage capacity of the port and the refers points while the cargo throughput was the output.
Using the cross-sectional data for 2002, Trujillo and Tovar [6] also used the Cobb-Douglas production function to analyze the technical efficiency of 22 European ports and estimate their legislation. They concluded that their analysis can’t explain the factors that determine the level of port efficiency.
González and Trujillo [24] applied a translog production function with panel data for 9 Spanish ports from 1990 to 2002 to evaluate the technical efficiency evolution in transport infrastructure and analyze the impact of 90’s port reforms. The results show that average technical efficiency has changed after the reforms.
By applying a panel data from 2002 to 2012, Barros et al. [25] analysed the impacts of cost and operational variables on major Chinese ports by means of a stochastic frontier model. Their inputs were the cost in Renminb, the price of labour, price of capital and price of intermediate consumption. The number of passengers and handled containers are output variables. The writers conclude that there is considerable heterogeneity in China’s seaports, affecting their cost efficiency estimation. Table 2 below shows the applications made by using the SFA method.
| Authors | Method | Units | Inputs | Outputs |
|---|---|---|---|---|
| Liu [18] | Translog production function | 28 British port authorities, 1983-1990 | Labour, capital | Turnover |
| Coto-Millan, et al. [19] | Translog cost function | 27 Spanish Ports, 1985-1989 | Price of labour, price of capital, price of intermediate consumption | Aggregated single variable of goods, passengers and vehicles |
| Estache et al. [26] | Cobb-Douglas and Translog production function | 11 Mexican port authorities 1996-1999 | Number of workers, length of docks | Volume of merchandise handled |
| Cullinane and Song [20] |
Cobb-Douglas cost function | 5 container terminals, Korean and UK, different year of observations (65 observations) | Managerial service, employees’ salaries, capital cost of terminal operations, net book value of mobile, cargo handling equipment | Turnover |
| Tongzon and Heng [21] | Cobb–Douglas production | 25 container ports/terminals | The terminal quay length, the terminal surface, the number of quay cranes | Total throughput |
| Barros [22] | Translog cost function | 10 Portuguese port authorities, 1990-2000 | Price of labour, price of capital | Number of ships, total cargo |
| Sun, et al. [23] | Cobb-Douglas production function | 83 container terminal operators 1997-2005 | Handling capacity between ship and quay, handling capacity between quay and yard, number of berths, length of quay lines, terminal area, storage capacity of port, reefer points | Throughput |
| Trujillo and Tovar [6] | Cobb-Douglas production function | 22 European port authorities 2002 | Number of employees, surface area | Container traffic, other types of freight and passenger traffic |
| González and Trujillo [24] | Translog production function | 9 Spanish port authorities, 1990-2002 | Length of berth, surface area, labour | Container and passenger traffic,liquid bulk and other cargo |
| Barros et al. [25] | random and fixed-effect stochastic models | major Chinese ports 2002-2012 | Cost in Renminb, the price of labour, price of capital, price of intermediate consumption | Number of passengers, handled containers |
Table 2: Literature review of SFA studies.
Material and Methods
We adopt two alternative approaches, DEA and SFA to quantify operational efficiency. The main difference between the two is that the former is a non-parametric technique and doesn’t make accommodation for statistical noise, whereas the latter is a parametric technique and accounts for statistical noise. Both in the SFA and DEA analysis, a DMU’s distance from the efficient frontier measures its relative inefficiency. The two approaches are presented in the next paragraphs.
Data envelopment analysis approach
Data Envelopment Analysis (DEA) was proposed by Charnes et al. [9] in 1978. The DEA is non-parametric technique for measuring the relative efficiencies on making units (DMUs) with multiple inputs and/ or outputs. In case when there is no other DMU or a combination of DMUs which can produce at least the same amount of output with less of the same resources input and not more of any other resources, the DEA method states that a DMU is considered efficient. In general, a DMU is considered to be inefficient if it obtains a score of less than the unity where a score of unity implies that it is efficient.
Among the number of DEA models, we employ the two most used ones: DEA-CCR model [9] and DEA-BCC model [10]. The DEACCR model estimates constant returns to scale so that all the detected production combinations can be proportionally scaled up or down. Besides, the DEA-BCC model was developed by adding a convexity restriction to the DEA-CCR model envelope formulation, which leads to variable returns to scale. Besides, this model is an extreme point technique; noise (even symmetrical noise with zero mean) such as measurement error may cause significant problems [26].
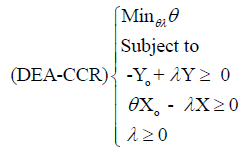
In this study, we will adopt the input-oriented approach. Therefore, the dual mathematical formulation of the DEA-CCR model is:
 (1)
(1)
Equation 1: Mathematical formulation of the DEA-CCR model [27].
Where:
θ: is a sought scalar (it represents the efficiency score of DMUi), λ: vector of non-negative weights, Y: is the m × n matrix of outputs, X: is the k × n matrix of inputs.
Yo’s and Xo’s are the observed output and input values, respectively, of the DMUo, and the DMU to be evaluated.
θ* is the input-oriented efficiency score of DMUo. If θ * is equal to the unity, then the current input levels cannot be reduced, indicating that DMUo is efficient. However, if θ *<1, then DMUo is technically inefficient.
The DEA-CCR problem (3) integrates an additional constraint, the convexity constraint N1′λ = 1, where N1 is the n × 1 vector of 1s.
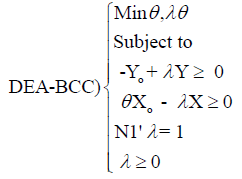 (2)
(2)
However, the DEA presents some drawbacks. The first drawbacks is that the DEA it ignores the statistical noise. So, one can apply the parametric Stochastic Frontier Approach (SFA) to resolve this problem.
Stochastic frontier approach
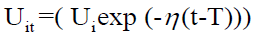
This approach was independently introduced by Aigner et al. [28] and Meeusen and van den Broeck [29]. In fact, this paper uses the SFA model of Cobb-Douglas production function to analyze the efficiency of 7 Tunisian ports. The estimation of this model is allowed by the access to a panel of data which covers a nine year period 2007-2017. The specific functional formal tested are the following:

Equation 3: Specific functional formal test equation [30].
Where the variables are all deviations from the geometric mean and defined as i=1,2,...,7; t=1,2,…,T; t: is a time trend; yit : is the volume of merchandise handled in port i during period t; x1it : is the area stored in port i during period t; x2it: is the number of stevedoring equipment used by port i in period t; x3it :is the number of employees in port i in period t; βk:is the unknown parameters to be estimated k=0,1,2,3; Vit: are random variables which are assumed to be i.i.d N(0,σV 2), and independent of the Uit; Uit: are non-negative random variables representing technical inefficiency and are assumed to be i.i.d as half-normal distribution N (0,σU 2); η: is a parameter to be estimated; σV: is the variance parameter of noise term; σU: is the variance parameter of inefficiency term.
Furthermore, we use the parameterization of Battese and Corra [30,31]. They substitute σV 2 and σU 2 with σ2= σ V2+ σ U2 and γ = σ U2 / ( σ V2+ σ U2 ) , respectively. The parameter γ is between 0 and 1. If γ is close to one, it shows that the deviations from the frontier are due principally to the technical inefficiency. However, if γ is close to zero, it shows that the deviations from the frontier are due principally to noise.
The method of likelihood ratio-test is proposed to examine the presence of inefficiency effect (uit) under both the null and alternate assumptions. This method is defined as:
LR=-2{ln[L(H0) ]-ln[ L(H1)]}
Equation 4: Likelihood ratio-test [32].
Where L(H0) and L(H1) are the values of the likelihood function under the null hypothesis (H0) and the alternative (H1), respectively. In this case, if H0=0 is true, this LR statistics, has an asymptotic distribution which is a mixture of chi-square distributions X².
Results
The available data are annual covering eleven years period, from 2007 to 2017, about 7 Tunisian ports (Bizerte, Goulette, Rades, Sousse, Sfax, Gabes and Zarzis). Thus, the sample of the analysis comprises a total of 77 observations.
The data were obtained from the Merchant Marine and Port Office (OMMP) and the Tunisian Stevedoring and Handling Company (STAM).
The measurement of the output is indicated for one element:
• Throughput: Movements of general cargo (dry, liquids and containers) unload and load (tons).
The measurement of the inputs is considered by the indicators:
• Number of stevedoring equipment: Total number of reach stackers, straddle carriers, number of quayside cranes, mobile cranes, quay gantry, mobile gantry and the ship shore container gantry,
• Number of employees: Total number of employees of the OMMP and of the STAM,
• Area stores: Total area stores (m²).
Table 3 contains the descriptive statistics of the variables used in the study. They include the sample mean, the median, the standard deviation, the minimum and maximum value for each of the variables. Here, the largest traffic of throughput (i.e., 10319193 tons in 2017), the largest number of stevedoring equipment (i.e., 122 in 2014) and the largest number of employees (i.e., 709 in 2015) correspond to the port of Rades since it plays an important role in the national transport chain through its specialization in container traffic and rolling units (mainly trailer traffic). While the maximum Area stores (i.e., 35600 m² in 2014) correspond to the port of la Goulette.
| Variables | Output | Inputs | ||
|---|---|---|---|---|
| Throughput (Tons) | Stevedoring equipment (No) | Area stores (m²) | Employees (No) | |
| Mean | 3672270,013 | 42,0259 | 15986,1558 | 168,2597 |
| Median | 4048751 | 31 | 13000 | 85 |
| Std. Deviation | 2556765,005 | 35,8755 | 11481,9591 | 205,0763 |
| Maximum | 10319193 | 122 | 35600 | 709 |
| Minimum | 650573 | 2 | 4000 | 6 |
Table 3: Summary; statistics for the period.
On the other hand, the minimum values of the number of stevedoring equipment (i.e., 2 in 2007 and 2009) and of the area stores (i.e., 4000 m² from 2007 to 2015) are related to the port of Gabes. However, the minimum value of traffic of throughput (i.e., 650573 tons in 2007) corresponds to the port of Zarzis. Finally, the minimum number of employees (i.e., 6) is recorded in Gabes and Zarzis during 2007 and 2008, respectively.
To estimate the efficiency scores, we used balanced panel data on Tunisian seaport authorities for the years 2007 to 2017. This number of observations allows the estimation of DEA with CCR and BCC models and a stochastic frontier model based on Cobb-Douglass production function.
Discussion
Coelli [30] FRONTIER Version 4.1 computer software is adopted for the calculation of the frontier for SFA with Cobb-Douglas function for the half-normal distribution (SFACD). Table 4 summarizes the maximum-likelihood estimation results, the test value calculated and the corresponding critical value of the X² distribution at 5% of significance.
| Variables | Coefficient | Standard-Error | T-Ratio |
|---|---|---|---|
| Constant | 15.463 | 0.244 | 63.434 |
| lnx1it | -15.051 | 0.104 × 10⁻⁸ | -6.754 |
| lnx2it | 0.041 | 0.05 | 0.592 |
| lnx3it | 0.116 × 10⁻⁹ | 0.924 × 10⁻¹⁰ | 1.259 |
| σ2=σς2+σς2 | 1.704 | 0.924 | 1.845 |
| γ=σY2/(σς2+σY2 ) | 0.971 | 0.016 | 59.176 |
| Log (likelihood) | -9.272 | ||
| LR = | 165.777 | ||
| Observations | 77 | ||
Table 4: Maximum likelihood estimates of the SFA model.
The estimated value of the variance parameter γ(0.971) is close to the unity, which suggests that deviations are due to technical inefficiency. The test refers to the evaluation of a Cobb-Douglas as a representation of production technology. The null hypothesis, β1=β2=β3=0 test the joint significance of input parameters. LR values of SFACD (165.77722) are larger than the critical values (7.81) of X2 distribution. This test suggests that we cannot reject this hypothesis and therefore the Cobb- Douglas function can be considered a good model to represent the production technology of the Tunisian port sector.
Table 5 reports the technical efficiency of each port in Tunisia calculated by DEACCR, DEABCC and SFACD models within the observed period, between 2007 and 2017.
| Year | Scores | Port | |||||||
|---|---|---|---|---|---|---|---|---|---|
| Bizerte | La Goulette | Rades | Sousse | Sfax | Gabes | Zarzis | Average | ||
| 2007 | DEACCR | 0.548 | 0.026 | 0.211 | 0.109 | 0.278 | 1.000 | 0.164 | 0.334 |
| DEABCC | 1.000 | 0.112 | 1.000 | 0.308 | 0.801 | 1.000 | 1.000 | 0.746 | |
| SFACD | 0.840 | 0.141 | 0.999 | 0.201 | 0.793 | 0.965 | 0.139 | 0.582 | |
| 2008 | DEACCR | 0.500 | 0.029 | 0.235 | 0.109 | 0.259 | 1.000 | 0.198 | 0.333 |
| DEABCC | 1.000 | 0.112 | 1.000 | 0.308 | 0.951 | 1.000 | 1.000 | 0.767 | |
| SFACD | 0.998 | 0.365 | 0.738 | 0.245 | 0.326 | 0.856 | 0.886 | 0.631 | |
| 2009 | DEACCR | 0.503 | 0.025 | 0.230 | 0.124 | 0.297 | 1.000 | 0.201 | 0.340 |
| DEABCC | 0.889 | 0.112 | 1.000 | 0.328 | 1.000 | 1.000 | 1.000 | 0.761 | |
| SFACD | 0.691 | 0.995 | 0.803 | 0.260 | 1.000 | 0.728 | 0.499 | 0.711 | |
| 2010 | DEACCR | 0.496 | 0.027 | 0.229 | 0.123 | 0.267 | 1.000 | 0.174 | 0.331 |
| DEABCC | 1.000 | 0.112 | 1.000 | 0.321 | 0.859 | 1.000 | 1.000 | 0.756 | |
| SFACD | 0.935 | 0.927 | 0.918 | 0.919 | 0.934 | 0.926 | 0.914 | 0.925 | |
| 2011 | DEACCR | 0.536 | 0.024 | 0.260 | 0.174 | 0.340 | 1.000 | 0.163 | 0.357 |
| DEABCC | 1.000 | 0.112 | 1.000 | 0.351 | 1.000 | 1.000 | 1.000 | 0.781 | |
| SFACD | 0.385 | 0.139 | 0.924 | 0.655 | 0.722 | 0.999 | 0.128 | 0.565 | |
| 2012 | DEACCR | 0.587 | 0.026 | 0.270 | 0.189 | 0.381 | 1.000 | 0.191 | 0.378 |
| DEABCC | 1.000 | 0.112 | 1.000 | 0.333 | 1.000 | 1.000 | 1.000 | 0.778 | |
| SFACD | 0.437 | 0.125 | 0.996 | 0.626 | 0.454 | 0.759 | 0.203 | 0.514 | |
| 2013 | DEACCR | 0.572 | 0.025 | 0.265 | 0.236 | 0.457 | 1.000 | 0.255 | 0.401 |
| DEABCC | 1.000 | 0.151 | 1.000 | 0.526 | 1.000 | 1.000 | 1.000 | 0.811 | |
| SFACD | 0.999 | 0.100 | 0.831 | 0.259 | 0.917 | 0.554 | 0.121 | 0.540 | |
| 2014 | DEACCR | 0.427 | 0.030 | 0.260 | 0.269 | 0.497 | 1.000 | 0.290 | 0.396 |
| DEABCC | 0.509 | 0.175 | 1.000 | 0.560 | 1.000 | 1.000 | 1.000 | 0.749 | |
| SFACD | 0.326 | 0.216 | 0.781 | 0.831 | 0.658 | 1.000 | 0.160 | 0.567 | |
| 2015 | DEACCR | 0.994 | 0.060 | 0.470 | 0.496 | 0.838 | 1.000 | 0.470 | 0.618 |
| DEABCC | 1.000 | 0.178 | 1.000 | 0.565 | 1.000 | 1.000 | 1.000 | 0.820 | |
| SFACD | 0.962 | 0.889 | 0.719 | 0.926 | 0.966 | 0.771 | 0.830 | 0.866 | |
| 2016 | DEACCR | 1.000 | 0.074 | 0.435 | 0.370 | 0.661 | 1.000 | 0.265 | 0.544 |
| DEABCC | 1.000 | 0.178 | 1.000 | 0.565 | 0.728 | 1.000 | 1.000 | 0.782 | |
| SFACD | 0.383 | 0.342 | 0.807 | 0.836 | 0.916 | 1.000 | 0.459 | 0.678 | |
| 2017 | DEACCR | 0.843 | 0.060 | 0.417 | 0.369 | 0.647 | 1.000 | 0.224 | 0.508 |
| DEABCC | 1.000 | 0.178 | 1.000 | 0.565 | 0.894 | 1.000 | 1.000 | 0.805 | |
| SFACD | 0.935 | 0.917 | 0.925 | 0.930 | 0.914 | 0.927 | 0.915 | 0.924 | |
Table 5: Efficiency scores for 7 Tunisian ports (2007-2017).
The scores raised by the application of the DEA models were calculated using the DEAP 2.1 program created by Coelli [27].
The input-oriented efficiency represents the degree to which a port could minimize its input use without altering its output. The DEA and SFA scores are between 0 and 1 DMUs with DEA and SFA scores equal to the unity are efficient. A DMU with a score of less than the unity is relatively inefficient.
Based on the DEABCC results, the ports of Rades, Gabes and Zarzis have achieved the best overall technical efficiency (score=1). However, the results for the port of Bizerte vary because it was inefficient in 2009.
Moreover, the results of DEABCC for the port of Sfax also vary in terms of efficiency as shown in Table 5. In fact, this port was inefficient along 2007, 2008, 2010, 2016 and 2017. On the other side, it was efficient during the rest of the study period.
When the DEACCR model captures the total technical efficiency and adequately discriminate the efficient DMUs. The results show that the port of Gabes was the only efficient port for this set of samples and showed efficiency scores of 1. This efficiency can be explained by its large production (this port is ranked second in Tunisia in terms of freight traffic) and by the optimal use of the infrastructure and the superstructure.
The results also showed that the ports of Bizerte, la Goulette, Rades, Sousse, Sfax and Zarzis were inefficient during the whole period of analysis. Those ports that invested from 2007 to 2017 found a general decline in efficiency scores, an element which could be explained by the time lag between the investment and the subsequent potential increase in container throughput.
Regarding the SFACD analysis, the results showed that none of the studied ports has high efficiency. However, the port of Rades can be considered as an efficient port during all the study period since its SFACD efficiency scores are always higher than 0.7193 while the SFACD scores for the other seaports are fluctuating.
The port of the La Goulette is the most inefficient; this inefficiency can be explained by its specilization in the passenger traffic and cruise. On the other hand, the port of Gabes is the most efficient by applying the 3 models. In 2016, this port represents 2 times of total traffic of port of Sousse and 3 times of total traffic of port of Zerzis.
We can conclude that the inefficiency of tunisian seaports is noticed in the decline of handling traffic, which corresponds to the results obtained by Pjevčević et al. [33] regarding the Serbian ports case.
Conclusion
This study applies the two leading approaches to the efficiency measurement, DEA and SFA, on the same data set for the port industry in Tunisia and compares the efficiency derived from the two approaches.
The input data are composed of the storage area, the number of employees and the number of stevedoring equipment while the output data include the aggregated port throughput per year.
The analysis shows that the total average of operating efficiency scores of DEABCC (0.746)>SFACD (0.536)>DEACCR (0.334) between 2007 and 2017. Based on the DEABCC results, the ports of Rades, Gabes and Zarzis achieved the best overall technical efficiency of 1.0 over11 years of the observed periods. However, the port of Rades can be considered efficient during the whole period of analysis since its SFACD efficiency score has never fallen below 0.7193. Given these results, we can say that the port of Rades can be considered as the best efficient port in the 2 models (DEABCC, SFACD). Based on the DEACCR results, the port of Gabes is defined as the only efficient one for this set of samples, so we can conclude that the port of Gabes can be considered as the best efficient port by using the DEABCC, DEACCR and SFACD models.
We can conclude that there are two solutions to resolve the sources of inefficiencies. Firstly, all the most inefficient seaports are advised to increase the quantity of goods that can be transferred by attracting more clients. Secondly, these ports should rent their stevedoring equipment and storage area to other companies in order to reduce the use of considered inputs (number of stevedoring equipment, number of employees and storage area) in proportion to the achieved output (throughput) in these ports.
References
- Al-Eraqi A, Adli M, Khader M, Barros CP (2008) Efficiency of Middle Eastern and East African Seaports: Application of DEA Using Window Analysis. Europ J Sci Res 23: 597-612.
- Farrell MJ (1957) The measurement of productive efficiency. J Royal Stat Soc Series A (General) 120: 253.
- Barros CP, Athanassiou M (2004) Efficiency in European Seaports with DEA: Evidence from Greece and Portugal. Maritime Econom Logist 6: 122-140.
- Cullinane KPB, Wang TF (2006) The efficiency of European container ports: A cross-sectional data envelopment analysis. Int J Logist: Res Appl 9: 19-31.
- Barros CP (2006) A benchmark analysis of Italian seaports using data envelopment analysis. Maritime Econom Logist 8: 347-365.
- Trujillo L, Tovar B (2007) The European Port Industry: An Analysis of its Economic Efficiency. Maritime Econom Logist9: 148-171.
- Munisamy S, Singh G (2011) Benchmarking the efficiency of Asian container ports. African J Business Manag 5: 1397-1407.
- Rajasekar T, Deo M (2013) Measuring the operational efficiency of selected Major Ports in India. MJOR 2: 29-34.
- Charnes A, Cooper WW, Rhodes E (1978) Measuring the efficiency of decision making units. Europ J Operat Res 2: 429-444.
- Banker RD, Charnes A, Cooper WW (1984) Some models for estimating technical and scale inefficiencies in data envelopment analysis. J Manage Sci 30: 1078-1092.
- Martinez BE, Diaz AR, Navarro IM, Ravelo MT (1999) A Study of the Efficiency of Spanish Port Authorities Using Data Envelopment Analisys. Int J Transport Econ XXVI 2: 237-253.
- Hayuth Y, Roll Y (1993) Port Performance Comparison Applying Data Envelopment Analysis (DEA). Maritime Policy Manage 20: 153-161.
- Tongzon JL (2001) Efficiency Measurement of Selected Australian and Other International Ports Using Data Envelopment Analysis. Transport Res Part A: Policy Pract 35: 107-122.
- Valentine VC, Gray R (2001) The Measurement of Port Efficiency Using Data Envelopment Analysis. Proc Ninth World Conference on Transportation Research, Seoul 22: 27.
- Park BI (2005) An Efficiency Analysis for the Korea Container Terminals by the DEA/Simulation Approach. Korean Manag Sci Rev 22: 77-97.
- Zheng XB, Park NK (2016) A study on the Efficiency of Container Terminals in Korea and China. The Asian J Shipping Logistics 32: 213-220.
- Hanaa Abdelaty HE (2016) Efficiency Assessment of Jazan Port Based on Data Envelopment Analysis. Mediterranean J Soc Sci 7: 320-327.
- Liu Z (1995) The comparative performance of public and private enterprises: The case of British ports. J Trans Econ Policy 29: 263-274.
- Coto-Millan P, Banos-Pino J, Rodriguez-Alvarez A (2000) Economic Efficiency in Spanish ports: some empirical evidence. Maritime Policy Manage 27: 169-174.
- Cullinane KPB, Song DW (2003) A stochastic frontier model of the productive efficiency of korean container terminals. Applied Economics 35: 251-267.
- Tongzon J, Heng W (2005) Port privatization, efficiency and competitiveness: Some empirical evidence from container ports (terminals). Transport Res Part A: Policy Pract 39: 405-424.
- Barros CP (2005) Decomposing Growth in Portuguese Seaports: A Frontier Cost Approach. Maritime Econ Log 7: 297-315.
- Sun X, Yan Y, Liu J (2006) Econometric Analysis of Technical Efficiency of Global Container Operators. Proceedings of the 11th International Conference of Hong Kong Society for Transportation Studies: Sustainable Transportation 667-676.
- González M, Trujillo L (2008) Reforms and Infrastructure Efficiency in Spain’s Container Ports. Transportation Research Part A: Policy Pract 42: 243-257.
- Barros CP, Chen Z, Wanke P (2015) Efficiency in Chinese seaports: 2002-2012. Maritime Economics & Logistics 18: 295-316.
- Estache A, González M, Trujillo L (2002) Efficiency gains from port reform and the potential for yardstick competition: Lessons from Mexico. World Development 30: 545-560.
- Coelli TJ (1996a) A guide to DEAP version 2.1: A Data Envelopment Analysis Computer Program. CEPA Working Paper 96/98. Armidale: CEPA , University of New England, Australia.
- Aigner D, Lovell C, Schmidt P (1977) Formulation and estimation of stochastic frontier production function models. J Econ 6: 21-37.
- Meeusen W, Van DBJ (1977) Efficiency estimation from Cobb-Douglas production functions with composed error. Int Econ Rev 18: 435-444.
- Coelli TJ (1996b) A Guide to FRONTIER Version 4.1: A Computer Program for Stochastic Frontier Production and Cost Function Estimation, CEPA Working Paper No. 96/07, Centre for Efficiency and Productivity Analysis, University of New England, Armidale.
- Battese GE, Corra GS (1977) Estimation of a production frontier model: With application to the pastoral zone of Eastern Australia. Australian J Agri Econom 21: 169-179.
- Battese GE, Coelli TJ (1993) A stochastic frontier production function incorporating a model for technical inefficiency effects, working Papers in Econometrics and Applied Statistics No. 69, Dept. Econometrics, University of New England, Armidale.
- Pjevcevic D, Radonjic A, Hrle Z, Colic V (2012) DEA window analysis for measuring port efficiencies in Serbia. Promet-Traffic & Transportation 24: 63-72.
Citation: Kammoun R, Abdenadher C (2018) The Technical Efficiency of Tunisian Ports: Comparing Data Envelopment Analysis and Stochastic Frontier Analysis Scores. J Marine Sci Res Dev 8: 261. DOI: 10.4172/2155-9910.1000261
Copyright: © 2018 Kammoun R, et al. This is an open-access article distributed under the terms of the Creative Commons Attribution License, which permits unrestricted use, distribution, and reproduction in any medium, provided the original author and source are credited.
Select your language of interest to view the total content in your interested language
Share This Article
Recommended Journals
Open Access Journals
Article Tools
Article Usage
- Total views: 5406
- [From(publication date): 0-2018 - Dec 19, 2025]
- Breakdown by view type
- HTML page views: 4445
- PDF downloads: 961