Using Digital Elevation Models and Image Processing to Follow Clod Evolution under Rainfall
Received: 16-Feb-2018 / Accepted Date: 23-Feb-2018 / Published Date: 07-Mar-2018
Abstract
Soil surface roughness plays an important role in determining how the soil will interact with its environment. Analysis of soil roughness at small scale matters both for preparation of soil in order to allow for plant emergence, and for decisions to favor soil conservation. Indeed, soil roughness may be shaped by tillage operations and then changes with time, under rainfall impact. Soil surface roughness is usually estimated by various indices, computed on measured profiles or images of elevations. Another approach is focusing on soil cloddiness, either by sieving or by image segmentation. The objective of this study is to monitor the evolution of clods under rainfall with Digital Elevation Model (DEM) recording and image processing.
We prepared two trays of artificial soil surfaces in the laboratory with silt loam soil topped by pre-sieved clods. They were designed to look like a seedbed. Soil surface evolution was achieved by subjecting the trays to controlled artificial rainfalls, and DEM were recorded at each stage. We performed automatic clod segmentation and measurement of the volume of individual clods. Under rainfall impact, we could see smoothing and leveling of clods until disappearance of the smaller ones. We focused on the larger clods greater than 12 mm in diameter that remained till the last rainfall. They showed swelling (volume increase) followed by erosion (volume decrease), these two phenomena being size dependent. Clod volume decrease was modeled by an exponential function. Now, the slope and the amplitude parameters decreased according to a power law, as a function of mean volume of clods.
Monitoring of clod volume with cumulated precipitation with the help of DEM measurements is able to differentiate the dynamics of clod depending on their size. This technique improves the usual roughness description and allows for a better understanding of the processes.
Keywords: Soil surface roughness; Digital elevation model; Monitoring; Cloddiness; Modeling; Rainfall impact; Erosion
Introduction
The role of surface roughness for soil interactions with its environment, and soil properties is commonly acknowledged. Indeed, soil surface has a large impact on geomorphologic processes, especially at millimeter scale. The soil surface roughness is a result of soil and water mechanisms interaction and feedback. It is also created by tillage practices. Indeed, soil roughness may be shaped by tillage operations and then changes with time, under rainfall impact [1,2]. Analysis of soil roughness matters both for preparation of soil in order to allow for plant emergence [3], and for decisions to favor soil conservation. Some studies have focused on soil water storage [4-6], soil crust formation [7,8], soil detachment by rain splash [9] or soil erosion [10-14].
Soil surface roughness is usually estimated by various indices, such as the standard deviation of elevations. These indices are computed on measured profiles or images of elevations [13-17]. In this approach, the soil surface roughness is characterized on the whole. Another approach is focusing on soil cloddiness, either by sieving or by image segmentation [5,6,18-22]. The recent development of photogrammetry and laser scanners affords to retrieve the digital elevation model (DEM) of the soil surface at millimeter accuracy [13,16]. With image processing, DEMs allow for the monitoring and modeling of soil surface local irregularities such as clods. They are suitable to survey the soil roughness both on the whole and more locally [17,19-21,23].
The objective of this study is to monitor the evolution of clods under rainfall with DEM recording and image processing. Controlled soil surfaces made in the laboratory will be subjected to rainfall events performed by a rainfall simulator. The dynamics of clod will be differentiated depending on their size. In particular, the parameters of exponential decrease of volume as a function of cumulated precipitation will be modelled according to the initial volume of clods. Then the laws followed by these parameters will be included in the exponential model so as to propose an estimation of the clod volume at a given cumulated precipitation as a function of the volume occupied by the clod at an earlier stage.
Material And Methods
We prepared two trays of 50 cm by 50 cm with loose soil of silt loam (11% clay, 60% silt, 29% sand) topped by pre-sieved clods collected in the field. The clods were air-dried and of different sizes, to represent a wide range of diameters (Table 1). They were set upon a nearly horizontal surface of soil, by hand, randomly, in order to look like a seedbed except for the rows (Figure 1). The resulting soil surfaces show an isotropic property. The first tray and the second tray have a density of 530 and 800 clods per m2 respectively and standard deviations of elevations of 10.5 mm and 9 mm respectively. Let us notice that the clods stand out well from the soil support and are isolated on tray 1 and more gathered on tray 2. The clods of tray 2 are also generally smaller than those of tray 1.
| Diameters | Min (mm) | Max (mm) | Median (mm) |
|---|---|---|---|
| Tray 1 | 4 | 76 | 18 |
| Tray 2 | 5 | 40 | 14 |
Table 1: Range of clods on soil surfaces.

Figure 1: Controlled soil surfaces made in the laboratory, a) tray 1 b) tray 2.
Soil surface evolution was achieved by subjecting the trays to five controlled rainfalls, using a laboratory rainfall simulator equipped with oscillating nozzles (Figure 2). The experiment was done at INRA department of soil science, in Orleans (France). The rainfall simulator was placed 6 m above the trays and produced raindrops of 1.5 mm median diameter. The rainfall intensity was adjusted by the number of sweeps per minutes. The first lot of rainfalls had an intensity of 33 mm h-1 and duration of 60 minutes. Then, in order to speed up clod erosion, the intensity was set to a higher value of 42 mm h-1.

Figure 2: Rainfall simulator.
The three last rainfalls had a variable duration from 38 minutes to 90 minutes. They were stopped when the soil surfaces seemed to have evolved visually. The rainfall impact made the clods smoothed and flattened, and the smaller ones disappeared. Where the clods were close together on tray 2, we also observed the formation of blocks of clods. We shall consider only the isolated clods in this study. It is done to perform a clod by clod volume variation study, which requires stable clods and not varying blocks of clods according to merging and splitting. The total amount of cumulated rainfall was near 200 mm. The trays had a permeable bottom to allow for water percolation. They were also set at a 5% slope for water runoff.
The DEM of each stage of the soil surfaces was recorded by laser scanner with accuracies of 0.5 mm in x and y axes, and 1 mm in z axis. The surface geometry was measured along a profile in the x-z plane, with the help of lasers producing a line on the soil surface and a CCD camera set at an angle. Then, a stepper motor allowed to move the lasers and camera assembly along the x-axis to retrieve the whole surface geometry (Figure 3). More details on this process can be found in [23].

Figure 3: Schematic of laser scanner used to measure DEMs of soil surfaces.
The clod contours were automatically segmented by thresholding the elevations above 1 mm. The reference level of elevations is the soil support of the clods. A program was written in Matlab software for this purpose [23]. Then the volume of each clod was computed from the DEM, for the selected data points belonging to the clod. It was normalized by the volume occupied by the clod at initial stage. Let us denote VI(j) the volume occupied by clod i at the end of rainfall n°j, denoted stage j, where j ∈ 1; 2; 3; 4; 5 for the 5 rainfall events. The initial stage is referenced as j=0. We then consider the average of the normalized clod volumes among a subset of N clods:
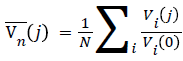
The average of the normalized volumes is then studied as a function of cumulated precipitation P. The decreasing part of Vn from the end of rainfall n°2 to the end of rainfall n°5 is modelled by: 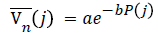
with j ∈ 2; 3; 4; 5 . Let us notice that modeling of  is performed at constant rainfall intensity equal to 42 mm.h-1.In order to prevent bias when averaging the clod volumes and modeling the decreasing part of , only the clods remaining after rainfall n°4 were taken into account to present the findings of this study. As an example, the Figure 4 shows the evolution of the clod contours from initial to final stage. We can see that a few clods have disappeared among the smallest and that a big clod have broken up. The clods have swelled during the first rainfall event and still have an enlarged perimeter at final stage. Let us notice that the swelling phenomenon is not isotropic. This was due to the inclination of the trays at 5% slope in order to allow for water outflow. The DEMs were detrended before segmentation of clods. The dynamic of elevations is represented by the colormap on this top view of the soil surface. The dimensions of the surface were reduced in the x and y axis, in order to allow for a clod by clod survey.

Figure 4: Clod contours on tray 1 at initial stage (in yellow dotted line) and at final stage (in white and solid line). The DEM is that of the final stage.
There remained a total of 58 single isolated clods from both trays. They were all greater than 1.2 cm in diameter. We gathered them evenly into five subsets of increasing initial clod volume to study a clod size influence upon the erosion of clods by rainfall impact. Each subset contained 11 or 12 clods. The characteristics of the clod equivalent diameters (for a half-sphere approximation) among the subsets are shown in Figure 5. The standard deviation among the subset of the largest clods is more elevated than the others because the large clods are scarce on both trays.

Figure 5: Equivalent diameters of the clods among the 5 subsets of the study. The standard deviation of diameters among each subset is written above the subset average and denoted .
In order to check the goodness of fits, we used the reliability factor introduced in [23]. This reliability factor corresponds to a normalized error and is defined as:
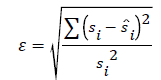
where si denote the ith data and the estimate of the ith data. The goodness of fit is even better when ɛ is small.
Results And Discussion
Figure 6 illustrates the average of the normalized clod volumes among the five subsets of clod size, as a function of cumulated precipitation. The smallest clods are represented in green, the next subsets respectively in cyan, blue, magenta and the largest clods in red. The clod initial volume ranges, in average, from 0.7 cm3 to 28.3 cm3. The reliability factors of the exponential modeling are less than 2% among all subsets.

Figure 6: Evolution of clod volumes, in average, under rainfall impact and according to clod size. The average volume of clods among each subset is indicated at initial stage, with equivalent diameter in parenthesis.
We can see an increase of during the first rainfall, which reflects a swelling phenomenon.
This swelling is increasing with clod size until 2.1 cm in diameter and is then saturating. For the largest clods, greater than 4.8 cm in diameter, the swelling is reduced and comparable to that of the clods around 1.7 cm in diameter.
Therefore, the largest clods might be more compact and less subjected to volume variations than the other clods.
This can be seen also on the decreasing part of , which is nearly linear for this category of clods. The decrease in volume is faster and faster as the size of clods decreases. It goes together with the value of b in the exponential model (Equation 2). Indeed, b is very small for large clods (0.0013) and increases as the size of clods decreases, with a maximum of 0.0134 for the smallest clods (Table 2). This shows that the small clods are more sensitive to breakdown by raindrop impact than the larger clods. Other authors [24] have already noticed that clod size is a major factor influencing soil detachment under rainfall. A possible explanation for this might be the earlier clod saturation for small clods. They are also more friable as the soil was tilled finer to produce them.
The parameter b of exponential decrease of clod volume under rainfall was further studied as a function of the average volume of clod subset at initial stage. Figure 7 represents the logarithm of b as a function of the logarithm of clod subset average volume at initial stage  . The linear fit has a reliability factor of 1%. It leads us to model b as:
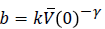

Figure 7: Size dependency of parameter b.
With k=0.012 and γ=0.65. Thus parameter b clearly shows a size dependency of the erosion of clods under rainfall impact. With a lower value of b, the large clods resist better than the smaller ones. The power law shows that this resistance increases with clod size but tends to steady as the size of clods increases.
The parameter a of equation 2 was also studied as a function of . Its evolution shows a discrepancy for the small values of (Table 2). Therefore, this was circumvented by representing as a function of in logarithmic scale (Figure 8). The reliability factor of the linear fit is 1% again. We thus model a as: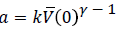
 |
a | b |
|---|---|---|
| 0.73 | 2.175 | 0.0134 |
| 1.254 | 2.151 | 0.0107 |
| 2.396 | 1.852 | 0.0070 |
| 6.125 | 1.525 | 0.0039 |
| 28.274 | 1.227 | 0.0013 |
Table 2: Parameters of exponential model among the subsets, according to clod subset average volume at initial stage.

Figure 8: Size dependency of parameter a 
with k=2.13 and γ=0.83. This confirms the size dependency of the erosion of clods under rainfall impact. Whereas parameter b is a slope parameter, parameter a is an amplitude parameter. It enables us to introduce a parameterization of the individual volume of clods  as a function of
  by combining equations 4 and 5 with equation 2, written for individual volumes instead of average volume:
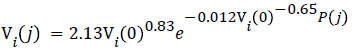
This equation is valid from the end of rainfall n°2, i.e. for j≥2, where  is maximum. It can be normalized as:
It was applied to estimate Vi(5) as a function of Vi(2) for the whole set of 58 clods. Let us denote  the estimate of Vi(5) according to eq. 7. The linear regression of as a function of Vi(5) has a slope of 0.96, an intercept of 0.026 and a coefficient of determination R2=99%. That is to say that is highly correlated to Vi(5) the slope is close to the expected value of 1 and the intercept is close to expected value of 0. However, the reliability factor of estimation is 9.3%, which shows that the model giving Vi(j) as a function of an earlier stage undergoes over- and under-estimations. It will need further deepening.
Conclusion
DEM recording and image processing enabled to monitor the erosion of clods under rainfall, with a quantified clod by clod survey. The clods were automatically segmented and the volume occupied by each clod was computed for the different stages of the soil surface. This study highlights the size dependency of the clod volume variation as a function of cumulated precipitation. This might be due to clod saturation occurring earlier for the smaller clods, allowing for a faster soil detachment as was already noticed by other authors. A parameterization of the clod volume decrease under rainfall, as a function of clod size at an earlier stage could be introduced. It gives satisfactory results on average but undergoes individual errors. Therefore, this parameterization will need further deepening before being implemented in surface generation and evolution programs. Future work will have to make the link with weathering models and will tackle a more in-depth analysis of the roughness of natural soil surfaces.
The better resistance of large clods under rainfall impact raises again the compromise between tillage requirements for plant emergence and decisions for soil conservation. This study shows the behavior of individual and isolated clods under controlled rainfall impact. It would need to be completed by a study of the behavior of clustered clods under rainfall impact and also by studies in natural field conditions. It then could be used to estimate the expected surface roughness evolution as a function of expected cumulated precipitation and clod initial volumes. This knowledge could then enlighten the decisions for agriculture and soil management.
References
- Takken I (2000) Effects of roughness on overland flow and erosion. Catholic University of Leuven, Belgium.
- Bauer T, Strauss P, Grims M, Kamptner E, Mansberger R, et al. (2015) Long-term agricultural management effects on surface roughness and consolidation of soils. Soil Tillage Res 151: 28-38.
- Durr C, Aubertot JN (2000) Emergence of seedlings of sugar beet (Beta vulgaris L.) as affected by the size, roughness and position of aggregates in the seedbed. Plant Soil 219: 211-220.
- Kamphorst EC, Chadœuf J, Jetten V, Guerif J (2005) Generating 3D soil surfaces from 2D height measurements to determine depression storage. Catena 62: 189-205.
- Arvidsson J, Bolenius E (2006) Effects of soil water content during primary tillage-laser measurements of soil surface changes. Soil Tillage Res 90: 222-229.
- Hemmat A, Ahmadi I, Masoumi A (2007) Water infiltration and clod size distribution as influenced by ploughshare type, soil water content and ploughing depth. Biosyst eng 97: 257-266.
- Baumhardt RL, Unger PW, Dao TH (2004) Soil and crop management-Seedbed surface geometry effects on soil crusting and seedling emergence. Agron J 96: 1112-1117.
- Gallardo-Carrera A, Leonard J, Duval Y, Durr C (2007) Effects of seedbed structure and water content at sowing on the development of soil surface crusting under rainfall. Soil Tillage Res 95: 207-217.
- Marzen M, Iserloh T, Casper MC, Ries JB (2015) Quantification of particle detachment by rain splash and wind-driven rain splash. Catena 127: 135-141.
- Romkens MJM, Helming K, Prasad SN (2001) Soil erosion under different rainfall intensities, surface roughness, and soil water regimes. Catena 46: 103-123.
- Licznar P, Nearing MA (2003) Artificial neural networks of soil erosion and runoff prediction at the plot scale. Catena 51: 89-114.
- De Bie CAJM (2005) Assessment of soil erosion indicators for maize-based agro-ecosystems in Kenya. Catena 59: 231-251.
- Eitel JUH, Williams CJ, Vierling LA, Al-Hamdan OZ, Pierson FB (2011) Suitability of terrestrial laser scanning for studying surface roughness effects on concentrated flow erosion processes in rangelands. Catena 87: 398-407.
- De Oro LA, Buschiazzo DE (2011) Degradation of the soil surface roughness by rainfall in two loess soils. Geoderma 164: 46-53.
- Bertuzzi P, Rauws G, Courault D (1990) Testing roughness indices to estimate soil surface roughness changes due to simulated rainfall. Soil Tillage Res 17: 87-99.
- Taconet O, Ciarletti V (2007) Estimating soil roughness indices on a ridge-and-furrow surface using stereo photogrammetry. Soil Tillage Res 93: 64-76.
- Dusseaux R, Vannier E, Taconet O, Granet G (2012) Study of backscatter signature for seedbed surface evolution under rainfall-Influence of radar precision. Prog Electromagn Res 125: 415-437.
- Sandri R, Anken T, Hilfiker T, Sartori L, Bollhalder H (1998) Comparison of methods for determining cloddiness in seedbed preparation. Soil Tillage Res 45: 75-90.
- Vannier E, Ciarletti V, Darboux F (2009) Wavelet-based detection of clods on a soil surface. Comput Geosci 35: 2259-2267.
- Taconet O, Dusseaux R, Vannier E, Chimi-Chiadjeu O (2013) Statistical description of seedbed cloddiness by structuring objects using digital elevation models. Comput Geosci 60: 117-125.
- Chimi-Chiadjeu O, Le Hegarat-Mascle S, Vannier E, Taconet O, Dusseaux R (2014) Automatic clod detection and boundary estimation from digital elevation model images using different approaches. Catena 118: 73-83.
- Ajdadi FR, Gilandeh YA, Mollazade K, Hasanzadeh RPR (2016) Application of machine vision for classification of soil aggregate size. Soil Tillage Res 162: 8-17.
- Vannier E, Taconet O, Dusseaux R, Darboux F (2018) A study of clod evolution in simulated rain on the basis of digital elevation models. Catena 160: 212-221.
- Lyles L, Disrud LA, Woodruff NP (1969) Effects of soil physical properties, rainfall characteristics, and wind velocity on clod disintegration by simulated rainfall. Soil Sci Soc Amer Proc 33: 302-306.
Citation: Vannier E, Taconet O, Dusseaux R, Darboux F (2018) Using Digital Elevation Models and Image Processing to Follow Clod Evolution under Rainfall. J Ecol Toxicol 2: 113.
Copyright: © 2018 Vannier E, et al. This is an open-access article distributed under the terms of the Creative Commons Attribution License, which permits unrestricted use, distribution, and reproduction in any medium, provided the original author and source are credited.
Select your language of interest to view the total content in your interested language
Share This Article
Recommended Journals
Open Access Journals
Article Usage
- Total views: 4858
- [From(publication date): 0-2018 - Jul 31, 2026]
- Breakdown by view type
- HTML page views: 3735
- PDF downloads: 1123