Valuation of Agro-Pastoral Rangeland Resources in Konso and Ali Districts, Southern Ethiopia
Received: 13-Jul-2021 / Accepted Date: 15-Aug-2021 / Published Date: 22-Aug-2021 DOI: 10.4172/2332-2608.1000309
Abstract
Natural resources play important roles in ecosystem service delivery, more especially in rural households where livelihoods depend heavily on natural resources for the delivery of ecosystem services. The various benefits derived from natural ecosystems such as food, medicines and carbon sequestration support human life and sustain its well-being. This study tried to value the streams of ecosystem services derived from rangeland in Segen area people zone 16214 hectare. Rangeland forage for livestock, fuel wood, construction wood, water resources, medicinal plants and passive or non-use value from the communal rangeland were estimated. Valuation was done to incorporate both marketed and non-marketed natural resources which were used within the production year. The total economic value for the area was estimated at ETB 175,136,405,914, Value of rangeland forage was estimated at ETB 170,050,535,419, valuation of fuel wood was estimated at ETB 2,416,576,020, valuation of construction wood was estimated at 2,243,520,000, valuation of water resource was estimated at 6,637,927, valuation of medicinal plant was estimated at ETB 357,600,548 and valuation of passive or non-use range land resource was estimated at 61,536,000. The non-use value was estimated by eliciting the willingness to pay for the rehabilitation of the degraded rangeland resources using a contingent valuation method. To assess the influence of the variables on the positive reported values of the WTP, the study considered the tobit econometric model. As to bit regression output indicated that increasing age had a negative influence on the WTP value and the increase in monthly income and the number of tropical livestock unit led to an increase in the WTP value. There were a number of challenges and opportunities identified from this study in communal rangeland and policy decision should act according to recommendation forwarded to improve rangeland resource.
Keywords: Rangeland; Total Economic Value; Willingness to pay; Tobit Model
Keywords
Rangeland; Total Economic Value; Willingness to pay; Tobit Model
Introduction
Valuation of natural resources is considered a complex process because most of the services and benefits are non-marketed and thus placing a monetary value on them represents a challenge [1]. Little attention is paid to values of ecosystems mainly because their services are not fully traded in a structured market and thus, receives little or no consideration in a decision making process by various policy makers. In neoclassical economic theory, an entity is considered to have economic value only when people are willing to pay for such an entity or willing to accept compensation to forego it [1,2].
One important approach based on ecosystem services is the use of economic valuation techniques, which translate the services provided by ecosystems into monetary values. Economic valuation of ecosystem services is a useful tool to strength the efforts to conserve and manage natural ecosystems.
Rangelands are natural terrestrial land surfaces that comprise grasslands, shrublands, woodlands, deserts and tundras. They constitute more than half of world total landmass [3]. Rangelands are mainly found in the arid and semi-arid regions where rain fed agriculture are unsuitable and thus, extensively utilized for animal grazing. They remain a primary source of forage for most livestock in Africa and Asia. Rangelands provide forage for livestock and wildlife, and support millions of world population.
Because it uses a metric that is easily understood (monetary units), economic valuation can increase society awareness about the importance of natural ecosystems in producing direct and indirect benefits that contribute to health, livelihood and economy [4]. In addition, economic valuation provides useful information for decision making and encourages investments in nature conservation [5].
The value and importance attached to an ecosystem service often reflect the socioeconomic attributes of the beneficiaries of such service [6,7]. The temporal and spatial scales of ecosystem services must be taken into consideration when valued [8]. Therefore, the interpretation of values of ecosystems require the knowledge of the spatial scales of services by defining the flow and characteristics of specific services for valuation, taking into account the values, cultural and belief systems of the various stakeholders affected with the valuation process.
Cousins (1999) argues that despite the contribution of natural resources to food security, income and other basic necessities of life, it appears that its importance are poorly understood by policy makers, conservation planners and fieldworkers. This, invariably impacts on the decision making process on governance and management of natural resources. The understanding of the concept of total economic values of natural resources and its contribution to rural livelihoods will assist decision-makers on how best to priorities conservation of natural resources in order to enhance sustainable livelihoods.
The same is true in study area and most of the transactions that require the use of natural resources are usually not marketed. Most of the resources are collected or accessed freely hence, there is no formal market exchange to determine their worth. It is interesting to note that most of values are outside the market hence, the need to adopt a valuation method that would reflect the total economic value to estimate the use and non-use values of the rangeland resources.
Objective of the Study
General
To undertake valuation of rangeland resources in study area
Specific objectives
To estimate the total economic value (TEV) of Communal rangeland in study area
To identify determinants of WTP for rangeland improvement services
To describe challenges and opportunities of the communal rangeland in study area
Methodology
Sample selection and interview approaches used
To estimate the total economic value of the study area range land resources, the study conducted a survey consisting of 180 respondents from two districts (Konso and Ali districts). These districts were selected based on rangeland potential in area coverage. From each district, two kebeles or villages, total of four kebeles or villages were selected randomly. The sample size in each kebele was selected based on probability proportion to size. We conducted the questionnaires individually, by face to face contact. We conducted the interviews on very early morning and/or afternoon because all people were in the field during mid day by performing their agricultural activities. The field data was collected by researchers collaborating with other stake holders (experts from districts and development agents who are working at kebele or village level). The researchers first introduced themselves, organization and objectives of the study openly. In order to collect different types of data to achieve the proposed objectives, varies methods were used and each of them were explained in the following paragraphs.
Rangeland valuation methods
Several valuation methods have been developed over the past years to measure welfare benefits and estimate economic values of earth’s ecosystem services [9]. Recently, there had been a growing increase in the use of economic valuation methods to assess the impacts of environmental projects in other developed economies, transitional economies as well as in developing countries [10].
The underlying principle of all methods of economic valuation of ecosystem services as is the case in private market goods is to measure welfare changes which are reflected by people’s willingness to pay or willingness to accept compensation for changes in level of consuming ecosystem services [11].
The choice of economic method to use depend primarily on the nature of the ecosystem service to be valued, information available, time, budget and expertise available [12]. For instance, if the ecosystem service to be valued is directly traded in the market, the market price reveal consumers’ preferences for such goods and that can be taken as an estimate of economic value of the resource. When ecosystem service is not directly traded, price information could be derived from a substitute market with direct relationship to the ecosystem service. In cases where market or substitute is not available for services, then a hypothetical market is constructed to elicit (obtain) consumers’ behaviors for such ecosystem services.
In this case, different types of rangeland resource estimation (valuation) Methods were used based on rangeland resource availability and each of them is explained in the following paragraphs. The methods used in this study include; production function analysis approach (also called input-output relationship), market analysis approach (direct market price or use value), substitution cost analysis approach and Contingent Valuation (CV) non-use value approach.
Production function analysis approach: It derives the economic value of an ecosystem service from its contribution to marketed economic outputs. It is based on input-output relationship in the production process of economic activities. It relates physical inputs or factors of production in a production process to the physical goods or outputs. Production function analysis is thus based on estimating the economic value of an ecosystem service used in the production of marketable economic output. Production function analysis is fairly a straightforward method because it adopts the scientific knowledge of cause-effect relationship between ecosystem services to be valued and the output levels of the marketed product [1].
Under practical application of the economic methods to value or estimate environmental attribute (in this case, range land resource, forage) was considered as primary input for production of marketed output (in this case, livestock products).
The production function between forage (input) and livestock (output) can be expressed in its simple form as:
L = f (F, V 1...... Vn)
Where L represents the quantity of the physical marketable output (livestock)
F is the function relating input to output (forage versus livestock production)
F is the Input (rangeland forage) and
V 1...... Vn represent other input variables used as supplementary feed for livestock production
Market price analysis approach: Market price analysis is often used to measure the economic values of ecosystem services that are directly tradable in a market. When market exist for a particular ecosystem service, the exchange value of such service is reflected in the price people are willing to pay to buy the service or willing to accept for selling the service. That is, the market price represents the value individuals attach to the good or service. This method is based on the principle of demand and supply of economic goods. Demand for natural resources is influenced by consumers’ income, price of the resource (where market exists), price of related goods or services, and individual’s preferences [13]. In this study, the range land resources estimated or valued by using market price analysis approach were: fuel wood, construction wood and water.
Substitution cost analysis approach: The method is used to estimate the value of non-marketed ecosystem services from the exchange value or market price of its substitute good. This valuation approach is based on the principle that the values of non-marketed natural resources could be derived from the value or cost of the next best alternative marketed products. In study area, use of medicinal plants from rangeland is common practice to treat illnesses of both animal and human being. The plants are freely collected from the village rangelands and majority of the households use with basic knowledge of medicinal plant use.
As medicinal plant is a non-marketed resource, its economic value and benefit to the society could be derived from the cost of its substitute goods. Conventional pharmaceutical medicine is assumed to be a perfect substitute for medicinal plants in study area for this study.
Contingent Valuation (CV) approach: Contingent valuation method is the most widely used method to estimate non-use value of ecosystem service. It is a survey-based method used to elicit willingness to pay (in case of improvements) or willing to accept (in case of damages) a stated amount of money for specified ecosystem services under a hypothetic market scenario.
Contingent valuation remains the only method which can be used to estimate the non-use or the passive use values components of ecosystem services particularly when the services to be valued is outside available market data [14]. It is effective and reliable when used alone or combined with other valuation methods to estimate the total economic value of environmental or natural resources. In this study, contingent valuation method was used to estimate currently non-use value in the rangeland in study area. The scenario was stated to elicit economic value of disappeared resources from the rangeland.
Respondents were interviewed using structured questionnaire to obtain information on their pattern of rangeland resource use within the commons. The format adopted for contingent valuation survey was open-ended and dichotomous or close ended valuation question. Dichotomous or close ended valuation questions were asked to either accept or leave a stated number followed up with lower or higher biddings.
Results and Discussions
Value of range land forage in study area
To determine the value of forage to human benefit in study area, the study used the production function analysis (also called productivity change method). Rangeland forage as an ecosystem product is not exchanged in the market but it is the main input together with other inputs used in production of livestock which are commercially marketed.
In order to calculate the monetary value of rangeland forage, it is necessary to calculate total income of livestock in study area. Total income of livestock is calculated by calculating net income of all livestock (live animals) monetary value, income earned from milk and butter from all livestock [15] Figure 1.

Figure 1: Cattle grazing.
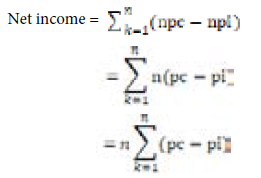
Net income of live animals is calculated as the difference between revenue and initial cost.
Where, n is number of all live animals, Pc is the current price of the each live animals and Pi is initial price of live animal.
The main live animals included in this study were cattle, goat, sheep and equine. The above formula was applied for each of aforementioned live animals and the calculations were undertaken using SPSS software and excel.
According to the above mentioned formula, the net income of live cattle in study area described in the following Table 1.
As indicated in the Table 1, net income of all live animals in study area was estimated as ETB 183,572,266,494. In addition to this, the estimated values of milk and butter for sampled respondents were ETB 8135 and ETB 15,496 respectively.
| Lives animals | Sampled respondent owning live animals (%) | Net income (sampled respondents ) | Total population owning live animals | Total net income of live animals in study area |
|---|---|---|---|---|
| Cows | 83 | 1,792,960 | 32,841 | 58,882,599,360 |
| Oxen | 86 | 2,973,220 | 34,028 | 101,172,730,160 |
| Heifers | 44 | 597,530 | 17,409 | 10,402,399,770 |
| Bulls | 27 | 306,400 | 10,683 | 3,273,271,200 |
| Calves | 48 | 260,350 | 18,992 | 4,944,567,200 |
| Goats | 82 | 1,570,672 | 32,445 | 50,960,040 |
| sheep | 49 | 205,643 | 19,388 | 3,987,006,484 |
| Equine | 24 | 90,430 | 9496 | 858,732,280 |
| Total net income 183,572,266,494 | ||||
The total economic value of the milk in study area can be calculated as:
Number of households earned income from milk was 10.6% of the total households
10.6/100 × 39,568 households = 4194 households
4194 × 8135 = ETB 34,118,190
Similarly, number of households earned income from butter was 15.6% of the total households
15.6/100 × 39,568 households = 6173 households
6173×15,496 = ETB 95,656,808
Therefore, total income of livestock becomes ETB 183,702,041,492.
However, Labour is a significant input factor in production of livestock. There are three distinct forms of labour identified in the study area namely self labour, hired labour, family or relative labour. Sixty two percent (62.4%) of respondent households who own livestock engaged in self labour for herding their livestock, only 0.6% engaged the service of hired or paid labour while 36% the services of family or relatives within the Communal Area. The average monthly cost of herding derived from the survey in the study area was ETB 320. To determine the total labour cost for livestock production, the average monthly wage of 320 for hired herding (labour) was taken as the opportunity cost for livestock owners who engaged in self and/or family labour.
Total estimated labour cost in the study area for one production year was:
320 × 12 × 237 (0.6% of total population, 39568) = ETB 910,080.
Treatment and vaccination of livestock also contributed as an input in the production of livestock in the study area with 89.4 % of livestock owning respondents treating and vaccinating their herds against disease outbreaks.
An annual average estimated ETB 146,396 was spent on treatments and vaccinations in the sampled respondents. The total annual average estimated costs spent on treatments and vaccination in study area calculated as:
146,396*89.4 % of total population (39,568) = ETB 5, 178,581,653
In addition to this, livestock owners are feeding not only rangeland forage but also purchase and offer supplementary feeds to their animals. Therefore, the purchased feeds also contributed as an input in the production of livestock in the study area with 64.2% of livestock owning respondents buy and supply to their livestock [16].
An annual average estimated ETB 333,509 was spent on purchasing supplementary feed for animals in the sampled respondents and the total expenditure of supplementary feed is calculated as:
333,509× (64.2% of total population, 39568) = 333,509 × 25,402 = 8,472,014,340
Having all aforementioned information, it is possible to obtain (calculate) the monetary value of rangeland forage in study area.
Rangeland forage monetary value = Total income of livestock – (labour cost + cost of livestock treatment and vaccination + cost of supplementary feed).
Total income of livestock = net income of all livestock monetary value + income earned from milk and butter = 183,572,266,494+ 34,118,190+ 95,656,808 = ETB 183,702,041,492
Therefore, rangeland monetary value calculated as:
183,702,041,492 – all costs (labour cost + cost of livestock treatment % & vaccination + cost of supplementary feed).
183,702,041,492 – (910,080 + 5, 178,581,653 + 8,472,014,340) = ETB 170,050,535,419
The economic value of rangeland forage is therefore ETB 170,050,535,419 study area. This value represents the economic benefit of rangeland grazing in study area which comprises 16,214 hectares.
Value of rangeland fuel wood in study area
Market price analysis was used to estimate the quantity of fuel wood used in the study area. Fuel woods are sold within the community. Therefore, it is very vital to evaluate the quantity based on the market price data of the fuel wood used.
75.4% (136) of respondents in the study area use fuel wood for energy generating purposes. The uses include cooking and heating. A household used on average 7.5 kg of fuel wood daily. There is no restricted access to collection of wood in the communal rangeland but some of respondents buy from the wood sellers. The woods are packaged and sold in bundles. A bundle is made up of 10 kg (average estimate of respondents) of wood and sold at ETB 30.
Economic value of fuel wood is therefore E = Qf × Mp, where E is Economic value of the fuel wood used, Qf is quantity of the fuel wood used and Mp is the market price of the fuel wood used in study area.
The economic value of the fuel wood used in study area can be calculated as:
Number of households using fuel wood is 75.4% of the total households
75.4/100 × 39,568 households = 29,834 households
Average quantity of fuel wood used daily is 7.5 kg per household per day and annual usage is 2700 kg per household.
Annual quantity of fuel wood used is 29,834*2700 = 80,552,534kg A unit bundle contains 10 kg of fuel wood. Therefore, annual quantity in bundle is
80,552,534kg /10 = 80,552,534 bundles used annually.
Economic value (E) = Quantity of fuel wood used (Qf) × Market price (Mp)
80,552,534 bundles × ETB 30 = ETB 2,416,576,020
Therefore, economic value of fuel wood in study area was estimated as ETB 2,416,576,020
This Figure represents the gross economic value of fuel wood contribution to livelihood strategy in study area.
The economic value of fuel wood on study area rangelands is calculated as:
2,416,576,020/16,214 ha = ETB 149043/ha
Value of rangeland construction wood in study area
Market price analysis was used to estimate the quantity of construction wood used in the study area. People in study area use woods from rangeland for their shelter and fence constructions. Sixty three percent of respondents in the study area use construction wood. Annually, a household used on average 75 collections (bundle) of construction wood. The estimated median value of construction wood per collection or bundle was ETB 1200.
Economic value of construction wood is therefore Ec = Qc × Mpc, where Ec is Economic value of the construction wood used, Qc is quantity of the construction wood used (in bundle) and Mpc is the market price of the construction wood used in study area.
The economic value of the construction wood used in study area can be calculated as:
Number of households using construction wood is 63% of the total households
63/100 × 39,568 households = 24,928 households
Economic value (Ec) = Quantity of construction wood used (Qc) × Market price (Mpc) (24,928 households)
= (ETB 1200) (75) (24,928) = ETB 2,243,520,000
Therefore, economic value of construction wood = ETB 2,243,520,000
The economic value of construction wood on study area rangelands is calculated as:
2,243,520,000/16,214 ha = ETB 138,369/ha
Valuation of medicinal plant use
Substitute cost method was used to estimate the benefit derived from medicinal plants because it has a close substitute of conventional drugs which have a direct market price. Where natural resources are not traded for the ecosystem services provided, the cost of a substitute product which have a direct market are taken as the best alternative. These prices represent a proxy prices because they reflect the amount of money the ecosystem services are valued in terms of expenditure saved.
If Pmg is the price of marketed good and Mg is marketed good, then the value of marketed good is (Pmg)* (Mg). Similarly, the price of the non-marketed environmental good, Nmg could be calculated as:
P (Nmg) = (Pmg)* (Mg)*(Rs) = (Pmg)* (Mg) where, P (Nmg) is the market value of non-marketed environmental good and (Rs) is marginal rate of substitution which was taken as equal to 1 because it was assumed that environmental aspect to be valued is perfect substitute for a marketed good. Figure 2 and Figures 3A and 3B

Figure 2:Some of medicinal plants used both for human and animals in
study area.

Figure 3: A: Animal pharmacy, B: Human pharmacy.
Thirty seven percent (37%) of the respondents indicated they use medicinal plants. Medicinal plants were used for treating both human and animal diseases. The main medicinal plants used (locally), and respective conventional drugs in pharmacy are presented in the Table 2 below.
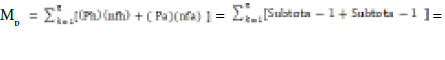
The value of medicinal plants used by community (as shown in the Table above) was calculated as:
| Local name of medicinal plants | Conventional drugs in pharmacy | Price per doze for human disease(Ph) in birr | Used frequency per year for human disease (nfh) | Subtota-1(in birr) | Price per doze for animal disease(in birr)( Pa) | Used frequency per year for animal disease (nfa) | Subtotal-2(in birr) | Grand total (Subtotal-1+ Subtotal-2) | |
|---|---|---|---|---|---|---|---|---|---|
| Human | Animal | ||||||||
| Oybata | Clokacillin | Antihelematic | 31 | 45 | 1395 | 33 | 99 | 3267 | 4662 |
| Patanal | - | Antihelematic | - | - | 0 | 31 | 20 | 620 | 620 |
| Kutata | - | Antitrips | - | - | 0 | 12 | 31 | 372 | 372 |
| Chamolitita | IC-tamo | Antibiotics | 15 | 46 | 690 | 140 | 34 | 4760 | 5450 |
| Kilimbota | Nyoscin | - | 32 | 4 | 128 | - | - | 0 | 128 |
| Halako | MTS, paracentam, Ddclo, chlorokine, bactrine | Antitrips | 21 | 43 | 903 | 12 | 87 | 1044 | 1947 |
| Tibita | - | Antitrips | - | - | 0 | 12 | 29 | 348 | 348 |
| Katao | - | Albendazole | - | - | 0 | 5 | 14 | 70 | 70 |
| Kiliphe | Clokacillin | - | 31 | 3 | 93 | - | - | 0 | 93 |
| Jewus | Anti-pain | - | 3 | 2 | 6 | - | - | 0 | 6 |
| Hitahiba | - | Oxy anti-biotics | - | - | 0 | 75 | 1 | 75 | 75 |
| Megagna | Electrolytic | - | 27.5 | 2 | 55 | - | - | 0 | 55 |
| Tambora | Clokacillin | - | 31 | 45 | 1395 | - | - | 0 | 1395 |
| Tambota | - | Ivervic | - | - | 0 | 35 | 77 | 2695 | 2695 |
| Malkisa | Anti-pain | - | 3 | 25 | 75 | - | - | 0 | 75 |
| Batana | Bactrine | Antihelematic | 10 | 5 | 50 | 33 | 10 | 330 | 380 |
| Koyra Maga | Anti-pain | - | 3 | 1 | 3 | - | - | 0 | 3 |
| Hadhayta | - | Nizal-QK 2400g | - | - | 0 | 10 | 1 | 10 | 10 |
| Shurata | - | Tetracozash-c | - | - | 0 | 10 | 60 | 600 | 600 |
| Aygita | - | Ivervic | - | - | 0 | 35 | 60 | 2100 | 2100 |
| Takema | Clokacillin | - | 31 | 15 | 465 | 0 | 465 | ||
| Kurutayta | No | - | - | 16 | 0 | - | - | 0 | 0 |
| Yesardinich | - | Penstrep | - | - | 0 | 140 | 9 | 1260 | 1260 |
| Kitkita | - | Antitrips | - | - | 0 | 12 | 1 | 12 | 12 |
| Tilbot | Bactrine | - | 10 | 30 | 300 | - | - | 0 | 300 |
| Chumba | - | Antitrips | - | - | 0 | 12 | 15 | 180 | 180 |
| Argayta | Clokacillin | - | 31 | 15 | 465 | - | - | 0 | 465 |
| Muduka | IC-tamo | - | 15 | 16 | 240 | - | - | 0 | 240 |
| Hangolayda | Antibiotic | - | 60 | 7 | 420 | - | - | 0 | 420 |
| Total | ETB 24,426 | ||||||||
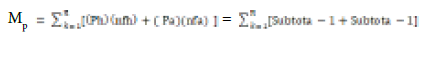
Where Mp = medicinal plants’ value, Ph is the Price per dose of given medicinal plant for human disease, nfh is used frequency per year for human disease, Pa is Price per doze for animal disease and nfa is used frequency per year for animal disease.
ETB 24,426 (see above table)
However, while this Figure is translated to given population size,
Mp = ETB 37/100*39,568*24,426 = 357,600,548
Therefore, the value of the medicinal plants in study area derived from substitute cost method is ETB 357,600,548.
The value per hectare will translate to the value of medicinal plants divided by the total hectare of the study area. That is ETB 357,600,548/16214ha = ETB 22,025/ha/year.
Valuation of water resources in study area
Some of the people in study area use rangeland water resources for their animals and home works. Despite of this, there is no attention is given to manage water resources and no documentation of the economic value of water resources. Therefore, it is vital to demonstrate the economic value of water resources to concerning body in order to give especial focus on rangeland water resources.
Twelve percent of the respondents in study area use range land water. The quantity of water used may not be uniform across households hence the median value is recommended to measure central tendency. Accordingly, the median water used by the respondents is 40 liters per day. An average monthly charge of range land water is ETB 116.5. This charge was based on local town market estimation of water. Most of people in study area prepare local drink called “cheka” by buying water and sell for their income generating purpose.
To derive the total annual water use in the study area the following approach was used:
116.5 × 12 months × (12/100) 39568 households = ETB 6,637,927
Therefore, the estimated value of water in the study area is ETB 6,637,927.
Annual direct use value per user household is calculated as:
Economic value of water resources/number of user households
6,637,927/4748 households = 1398 per household per annum
Economic value averaged across all households is 6,637,927/39568 = ETB 168 per household per annum
Non-use value of rangeland in study area
Non-use value of ecosystem service was estimated using a hypothetical market to extract the willingness to pay (WTP) for naturally free environmental services using a questionnaire. According to Oluwagbenga the median of individual willingness to pay is preferable to estimate the total wiliness to pay. The median individual willingness to pay for non-use value of study area communal rangeland was ETB 160 per month. The aggregate willingness to pay for ecosystem services in a study area was derived by multiplying the median WTP by the household population. Figure 4

Figure 4:Degraded rangeland with non-palatable shrubs and in study
area.
Total WTP = (median WTP) × (Population size)
ETB 160 × 32,050 households = ETB 5,128,000
Therefore, the aggregate willingness to pay monthly for the non-use value of the natural resources is 5,128,000. The study was conducted to estimate the total economic value of ecosystem services derived from study area natural resources over a production year. The non-use value of the communal rangeland per annum will therefore be calculated as 5,128,000 × 12 months = ETB 61,536,000
The annual non-use value of study area communal rangeland is therefore ETB 61,536,000.
Annual non-use value of study area communal area per hectare is therefore:
ETB 61,536,000 /16214 ha = ETB 3795/ ha
Non-use value per user household per annum is calculated as:
Economic value of non-use/number of respondent households
61,536,000 /32050 households = ETB 1920/household/annum
Annual economic value averaged across all households is calculated as:
Economic value of non-use /number of all households
61,536,000 /39568 households = ETB 1555/year
The total economic value of rangeland resource was estimated as TEV=economic value of rangeland forage + economic value of fuel wood + economic value of construction wood + economic value of medicinal plant + economic value of water resources + economic value of non use range land resource
TEV = 170,050,535,419 + 2,416,576,020 + 2,243,520,000 + 357,600,548 + 6,637,927 + 61,536,000
= ETB 175, 136,405,914
Econometric models output (Results)
To assess the influence of the variables on the positive reported
values of the WTP, the study considered the model with the following variables: sex, age, education, tropical livestock unit, total number of house hold (labour force), monthly income and owning individual or private range land. As indicated in the table below, increasing age had a negative influence on the WTP value (coefficient = -1.68, p = 0.065), which means that older people were less willing to contribute, ceteris paribus. The increase in monthly income (coefficient= 0.433, p = 0.000) and the number of tropical livestock unit (coefficient= 6.967, p = 0.000) led to an increase in the WTP value. The Table 3 also shows the marginal effect of tropical livestock unit and monthly income of respondent on participation on willingness to pay to improve rangeland resources. Accordingly, there is a probability of approximately 72% and 24% contribution to improve rangeland resource if respondent has more tropical livestock units and extra household income respectively Table 3.
| Maximum WTP | Coefficient | Std. Err. | t | P>|t| | Mfx (marginal effect) |
|---|---|---|---|---|---|
| Sex | -25.22807 | 48.42475 | -0.52 | 0.603 | -17.4685 |
| Age | -1.67736 | .9041415 | -1.86 | 0.065 | -9.542732 |
| Education | -1.220152 | 4.26637 | -0.29 | 0.775 | -16.24939 |
| TLU | 6.966311 | 1.760451 | 3.96 | 0.000 | 0.7207695 |
| Total no of household | -1.324126 | 7.318448 | -0.18 | 0.857 | -21.73856 |
| Monthly income | .4333231 | .0369124 | 11.74 | 0.000 | 0.2430449 |
| Own range land size | -.0123564 | 12.12227 | -0.00 | 0.999 | 51.35613 |
| Constant | 51.0272 | 59.50345 | 0.86 | 0.392 | |
| Obs. Summary: 40 left-censored observations at max. WTP <= 0 140 uncensored observations 0 right-censored observations |
|||||
Tobit regression Number of obs = 180 LR chi 2(7) = 137.75 Prob > chi 2 = 0.0000 Log likelihood = -915.8454 Pseudo R 2 = 0.0699
Challenges and opportunities of rangeland in study area
Rangeland resources have immense contribution to human wellbeing in study area. Their livelihood depends mainly on rangeland. As explained in earlier sections, a number of benefits (food, shelter and other economic aspects) are derived from rangeland natural resources. Despite of all aforementioned benefit, a number of challenges are facing agro pastoralists and limits their sustainable well beings. According to the explanation of beneficiaries, other experts and insight observations, a lot of constraints were featuring study area rangeland and some of them are elaborated in the following paragraphs.
Water is the very vital for both human and animals to sustain their live. However, in study area shortage of water for animals is increasing from time to time. Limited rainfall through the year resulting in scarcity of water and rangeland forages hence production and productivity of livestock is decreasing over time. Shocking climate change has been occurred in study area and resulted deaths of huge number of animals. For example, El Nino in 2015/16 happened for long time and feed and water challenges faced with destruction of masses of animals.
Expansion of agricultural land has also negative effect on rangeland sustainability in study area. Population and demand for resources are increasing overtime. To overcome and minimize natural problems people deforest rangeland resources and expanding agricultural lands. The increasing of agricultural land and decreasing of rangeland size results in declining carrying capacity of rangeland for existing livestock population. Therefore, overloading on fixed or decreasing rangeland causes sufferers to scarce resources.
Absence of rangeland management authority is another challenge in study area. According to discussion held with the experts and physical observations during field trips, there is no any regulation to use and manage rangeland resources. The rangeland area is open to everybody at every time. Neither governmental nor community based rangeland management system is applied in the area. Traditional way of livestock keeping system is practiced and results degradation of soil fertility and other palatable plants. According to respondents, animal disease outbreaks challenging in study area. They were explaining that there were silent killer animal diseases especially, for poultry. They complain that poultry disease gives no chance to treat either traditionally or modern way. It is transmittable from one to another animal and kills masses at a time. For this problem, there was no solution forwarded from respective stakeholders (government, non government, private). They said that poultry disease is also transmittable to human beings and cause unknown human diseases. The other problem that people in the study area complaining was lack of improved livestock breeds especially large and small ruminants. The existing cattle and shoat are low in productivity and exposable to climate changes.
Though there are many challenges in study area rangeland, it has noticeable opportunities for community. It is base for community livelihood wellbeing. Every human and livestock living alarm is related to rangeland resources in the area. The main opportunities identified during field data collection were medicinal plants and multipurpose grass in study area. People in the area, most of time, do not bring their animals to clinics which are found around them. They identify themselves the disease and treat their animals. They also use different plants for human being to treat diverse diseases as mentioned in the previous section. The other very remarkable resource in rangeland of study area is grass locally called “KAMBASHA”. This grass is found in Ale special district’s rangeland area. According to the respondents, kambasha is the multipurpose grass and they use it for different purposes. It is used: as forage for livestock; has many branches around root hence used for soil conservation; grow and multiply itself rapidly; climate smart plant because it tolerates draught; and uses for house construction because it is strong and has as much as required height.
Conclusions and Recommendations
Valuation study of rangeland is useful for demonstrating the importance of rangeland to community, providing guidance and direction for the government and other stakeholders to allocate resources to the conservation of the area. The study tried to analysis the ecosystem services by using the methods of production function approach, direct market price analysis, substitution cost approach and contingent valuation approach. This study presents that livestock farming remains a viable livelihood strategy in the semi-arid districts of study area. From the estimated values in this study, it is evident that the economic value of rangeland forage accounts the most percent of the total economic value of ecosystem services derived from natural resources in study area.
The study area rangeland is mainly faced with challenges like water shortage, decreasing rangeland size, traditional livestock keeping and disease outbreaks. Therefore, based on findings the following recommendations are forwarded for policy makers.
• Community based rangeland management system should be applied. Local and regional government including nongovernmental organizations should focus on working with community by creating awareness on how to manage, improve, rehabilitate and use rangeland resources. Area closure by fencing and resting part of rangeland at one time and shifting the same trend to another area should take place. The government together with beneficiary community should plan yearly, monthly and weekly to work on rangeland rehabilitation and management. The technical, managerial and financial support ought to be offered by government and other stakeholders. Information should be provided to beneficiaries regarding rangeland management practices via experience sharing. Clearing very aged plants and nonpalatable shrubs; planting and sowing climate smart improved forage cuttings and seeds over rangeland and providing them to individual households to develop their own forages; running soil conservation activities like terracing and afforesting; constructing water ponds by big machine together with community beneficiaries and harvesting water at water abundance seasons. Additionally, shifting traditional animal keeping system to modern carrying out practices like fattening by using full package which is recommended by research findings.
• As finding shows rangeland size is decreasing from time to time due to different reasons resulting in decreasing livestock productivity. In order to overcome such problems, awareness creation should be made on minimizing the number of livestock per house hold. Though the number of livestock is increasing from time to time, the existing rangeland size is decreasing hence carrying capacity of rangeland declining with diminishing productivity of animals. In study area, people assume that selling livestock is shame. They transfer livestock as heritable asset to next generations. Therefore, understanding and/or awareness should be made on destocking at drought time and restocking at forage and water abundance time. Furthermore, improved breeds of livestock should be introduced.
• Conducting further research on animal diseases, medicinal plants and identified multipurpose grass called “KAMBASHA” and promoting its contributions to beneficiary communities and other regions.
References
- Chee Y (2004) An ecological perspective on the valuation of ecosystem services. Biological Conservation 120: 549-565.
- Farber S, Costanza R, Wilson M (2002) Economic and ecological concepts for valuing ecosystem services. Ecological Economics 41: 375-392.
- Mathews J, Hinrichsen D, Tunstall D, Damlamian J, Conroy C, et al. (1986) World Resources 1986: A report by The World Resources Institute and The International Institute for Environment and Development.
- Figgis P, Mackey B, Fitzsimons J, Irving J, Clarke P (2015) Valuing nature: protected areas and ecosystem services. Sydney: Australian Committee for IUCN.
- Goldman RL, Tallis H, Kareiva P, Daily GC (2008) Field evidence that ecosystem service projects support biodiversity and diversify options. Proceedings of the National Academy of Sciences of the United States of America 105: 9445-9448.
- Carpenter S, Folke C (2006) Ecology for transformation. Trends in Ecology & Evolution 21: 309-315.
- O’Farrell P, De Lange W, Le Maitre D, Reyers B, Blignaut J (2011) The possibilities and pitfalls presented by a pragmatic approach to ecosystem service valuation in an arid biodiversity hotspot. J Arid Environ 75: 612-623.
- Hein L, Van Koppen K, De Groot R, Van Ierland E (2006) Spatial scales, stakeholders and the valuation of ecosystem services. Ecological economics 57: 209-228.
- Pascual U, Muradian R, Brander L, Gómez-Baggethun E, MartÃn-López B, et al. (2010) The economics of valuing ecosystem services and biodiversity. Bio Science 64: 1027-1036.
- Rietbergen-McCracken J, Abaza H (2013) Environmental valuation: A worldwide compendium of case studies.
- Alcamo J, Bennett E (Eds.) (2003) Ecosystems and human well-being: a framework for assessment. Choice Reviews Online 41: 4645.
- FEE (Forum for Economics and Environment) (2002) Environmental economics and natural resource policy. Pretoria.
- Ulibarri C, Wellman K (1997) Natural resource valuation: A primer on concepts and techniques. Pacific Northwest Laboratory.
- Alberini A, Cooper J (2000) Applications of the Contingent Valuation Method in Developing Countries: A Survey. Food and Agriculture Organisation 67.
- Costanza R, d'Arge R, De Groot R, Farber S, Grasso M, et al. (1997) The value of the world's ecosystem services and natural capital 387: 253-260.
- Cousins B (1999) Invisible capital: The contribution of communal rangelands to rural livelihoods in South Africa. Development Southern Africa 16: 299-318.
Citation: Oyka E, Galtsa D, Kamaylo K, Dukamo M, Tsala T (2021) Valuation of Agro-Pastoral Rangeland Resources in Konso and Ali Districts, Southern Ethiopia. J Fisheries Livest Prod 9: 309. DOI: 10.4172/2332-2608.1000309
Copyright: © 2021 Oyka E, et al. This is an open-access article distributed under the terms of the Creative Commons Attribution License, which permits unrestricted use, distribution, and reproduction in any medium, provided the original author and source are credited.
Select your language of interest to view the total content in your interested language
Share This Article
Recommended Journals
Open Access Journals
Article Tools
Article Usage
- Total views: 3395
- [From(publication date): 0-2021 - Dec 11, 2025]
- Breakdown by view type
- HTML page views: 2561
- PDF downloads: 834