Water Quality Analysis of parts of Muvattupuzha River, Kerala, India (2019-2020 case study)
Received: 02-Feb-2023 / Manuscript No. jbrbd-23-87524 / Editor assigned: 06-Feb-2023 / PreQC No. jbrbd-23- 87524 (PQ) / Reviewed: 20-Feb-2023 / QC No. Jbrbd-23-87524 / Revised: 22-Feb-2023 / Manuscript No. Jbrbd-23-87524 (R) / Accepted Date: 28-Feb-2023 / Published Date: 28-Feb-2023
Abstract
The impact of industrial effluents on water quality has been observed and scientifically studied by water quality analysis. The Muvattupuzha River was taken as the main source and water samples were taken from the tributaries. The industries located near the spots and the peculiarities of the spots led to the study of industries and their effect on the water bodies. The spots were inhabited areas, temples, tourism ranges, boat service places, and foreign project places. The special significance created by the industrial areas located nearby and the intervention with the local people led to the realization that the quality of the water body declined at an alarming rate. The need to conserve the aquatic ecosystem to maintain ecological balance was learned on a much deeper level.
Keywords
Water; Pollution; Industry; Quality
Introduction
Water is a prime life-sustaining natural resource that cannot be created like other commodities. Water is the elixir of life. The world’s population continues to soar but that rise in numbers has not been matched by an accompanying increase in supplies of freshwater. The availability of safe water is a major problem faced in the present scenario. Regarding the quality of drinking water, microbial contamination is a primary concern of developing countries. In addition, inorganic compounds, concerning both health and aesthetic aspects can be present in the water; Fluoride and arsenic are a great health problem worldwide. The public health burden of these two chemicals far exceeds that of other chemical contaminants in drinking water, but globally it is masked by the public health impact of microbial contamination. Also, other physical-chemical parameters can deteriorate water quality. Heavy metals like lead, chromium, cadmium, and mercury are dangerous for human health since they are toxic and can be carcinogenic. Potential water quality impacts must be considered based on a clear observation of various water quality characteristics. It is necessary to utilize a manifold evaluation of water quality characters to develop a total evaluation of existing water quality as well as micro-scale changes that might result from project alternatives [1]. The south-central part of the state of Kerala is characterized by the presence of two large basins of the Periyar and Muvattupuzha rivers [2]. The name Muvattupuzha is made up of three Malayalam words: 'Moo', which stands for 'three', 'aaru' - small river, and 'puzha', which also means a river [3]. 'Aaru' is a word that is usually used for rivers in the southern half of Kerala, while 'puzha's are northern rivers. The three rivers in this case are the Kothamangalam river or Kothayaar, Kaliyar, and Thodupuzha Rivers, which merge to form a single river. Hence, it is called Thriveni Sangamam or Centre Point. A significant change took place in the river flow characteristics since the commencement of the Idukki hydroelectric project [4]. The tail-race water 700-2700 cusecs was directed into the Muvattupuzha river from the Moolamattomb power station through the Thodupuzha river. This increased freshwater flow pushes back the total incursion from the river [5]. The bank erosion was observed to be rampant and freshwater biological specimens thrived in the river.
Six sites were chosen for the water quality analysis.
The attributes that are being tested in the present study are as follows:-
1. Temperature
2. Salinity
3. Electrical Conductivity
4. Total Dissolved Salts
5. Oxidation-reduction potential
6. pH
7. Dissolved Oxygen
The total review of all these parameters can give an idea of the water quality of Muvattupuzha.
1. Temperature: Palatability, viscosity, solubility, odor, and chemical reactions are influenced by the temperature. Thereby, the sedimentation and chlorination processes and biological oxygen demand are temperature dependent. It also affects the biosorption process of the dissolved heavy metals in water.
2. Salinity: Salinity is a measure of the number of salts in the water. Salts and other substances affect the quality of water used for irrigation or drinking. They have a critical influence on aquatic biota, and every kind of organism has a typical salinity range that it can tolerate. Moreover, the ionic composition of water can be critical. The units used to measure salinity fluctuate based on application and reporting procedure. Parts per thousand or grams/kilogram (1 ppt = 1 g/kg) used to be the standard.
Conductance and salinity are not mentioned by the BIS or any other national or international agency in providing guidelines for drinking-water safety. Both these parameters have a bearing
On the total dissolved solids (TDS) of drinking water. According to the BIS (IS-10500), TDS in
Drinking water has a desirable limit of 500 mg/L and a permissible limit of 2000 mg/L.
3. Electrical conductivity: The conductivity of water is an expression of its ability to conduct an electric current. This ability is directly related to the concentration of ions in the water. These conductive ions come from dissolved salts and inorganic materials such as alkalis, chlorides, sulfides, and carbonate compounds. The more ions that are present, the higher the conductivity of water. Conductivity is usually measured in micro- or Milli siemens per centimeter (uS/cm or mS/cm)
4. TDS: TDS stands for total dissolved salts and represents the total concentration of dissolved substances in water. TDS is made up of inorganic salts, as well as a small amount of organic matter. Common inorganic salts that can be found in water include calcium, magnesium, potassium, and sodium, which are all cations, carbonates, nitrates, bicarbonates, chlorides, and sulfates, which are all anions. Water that has a TDS level of more than 1000mg/L is unfit for consumption. A high level of TDS in water can lead to problems.
5. ORP: Oxidation-reduction potential measures the ability of a river to cleanse itself or break down waste products, such as contaminants and dead plants and animals. When the ORP value is high, there is lots of oxygen present in the water. This means that bacteria that decompose dead tissue and contaminants can work more efficiently. In general, the higher the ORP value, the healthier the river is. ORP depends on the amount of dissolved oxygen that is in the water, as well as the number of other elements that function similarly to oxygen. When ORP is low, dissolved oxygen is low, the toxicity of certain metals and contaminants can increase, and there is lots of dead and decaying material in the water that cannot be cleared or decomposed. The oxidation-reduction potential is measured in millivolts or mV. In healthy waters, ORP should read high between 300 and 500 millivolts. Water with a high pH level has a higher amount of reducing agents and is designated by -ORP, which is a negative ORP reading. Water with a low pH has a higher amount of oxidizing agents and is designated by +ORP, which is a positive ORP reading.
6. pH: The technical definition of pH is that it is a measure of the activity of the hydrogen ion (H+) and is reported as the reciprocal of the logarithm of the hydrogen ion activity. Therefore, water with a pH of 7 has 10-7 moles per liter of hydrogen ions; whereas, a pH of 6 is 10-6 moles per liter. The pH scale ranges from 0 to 14. It is a measure of how acidic or basic the water is. In general, water with a pH < 7 is considered acidic and with a pH > 7 is considered basic. The normal range for pH in surface water systems is 6.5 to 8.5 and for groundwater systems 6 to 8.5.
The pH of a body of water is affected by several factors. One of the most important factors is the bedrock and soil composition through which the water moves, both in its bed and as groundwater. Another factor that affects the pH is the amount of plant growth and organic material within a body of water. When this material decomposes carbon dioxide is released. The carbon dioxide combines with water to form carbonic acid. Although this is a weak acid, large amounts of it will lower the pH. A third factor that determines the pH of a body of water is the dumping of chemicals into the water by individuals, industries, and communities. A fourth factor that affects pH is the amount of acid precipitation that falls in the watershed. Acid rain is caused by nitrogen oxides (NOx) and sulfur dioxide (SO2) in the air combined with water vapor. These pollutants are primarily from automobile and coal-fired power plant emissions.
7. Dissolved oxygen: Dissolved oxygen is considered to be one of the most important parameters of water quality in streams, rivers, and lakes. It is a key test of water pollution. The higher the concentration of dissolved oxygen, the better the quality of the water. By analyzing the water samples from the Muvattupuzha river, an attempt is made to understand the quality of water used by the people of this region.
Materials and Method
Six sampling stations were chosen for assessing the quality of the Muvattupuzha river. Water samples were collected fall the six sampling stations (namely S1, S2, S3, S4, S5, and S6) during the month of February 2020. Water samples were collected twice during this period from each station at intervals of one week. Each water sample was analyzed for seven parameters such as temperature, pH, salinity, electrical conductivity, dissolved oxygen, total dissolved solids, and oxidation-reduction potential by using a pH meter, Portable dissolved oxygen meter - 831, pH/EC/TDS/Salinity Meter – 372 (PETS).
Selected six sampling stations were the following:
1. Piravom
2. Pazhoor
3. Kanjiramattom
4. Poothotta
5. Nadakkav
6. Vamaboor
The samples were collected in thoroughly cleaned 1-liter inert plastic bottles, which were rinsed with water before collection. The bottles were enough to accurately represent the whole water body. The water sample tends to modify itself to the new environment. Samples were collected in sampling bottles avoiding floating materials. The stoppers of the sample containers were closed properly to prevent outside contamination. The containers were labeled describing the name of the water body, date, time, and sampling points. Measurements of pH, mV, EC, TDS, and salinity were made with Systronics pH/EC/TDS/Salinity Meter. This apparatus has two electrodes with a temperature probe. mV, EC, TDS, and salinity are measured with one electrode along with a temperature probe. The second electrode is used for measuring pH, mV, EC, TDS, or Salinity (any of one at a time) parameters are displayed along with the temperature of the water samples.
Working Principle
First switch on the apparatus. Press the number key corresponding to the parameter which is to be measured in the water sample. Then wash the corresponding electrode with distilled water and wipe it with tissue paper. A water sample is taken in a clean beaker and the electrode along with the temperature probe is placed in the beaker. The value will be displayed on the display board. Press the number key corresponding to the next parameter which is to be measured in the water sample, thus the process can be continued. The dissolved oxygen of water samples was measured by using the Portable Dissolved oxygen meter of Scientific India. D O meter is designed in ABS plastic to provide rugged portability matched in fields with the accuracy demanded in the laboratory. A handy carrying case holds everything needed in the field operation. The instrument measures the DO of any solution in the fields, laboratory, or plant. The pH of the water samples was measured by using a Systronics pH meter.
➢ Study Area
➢ Poothotta
It is an island village that is 50 km away from Cochin international airport. Muvattupuzha river in Poothotta has on its bank the vista of 3 districts in Kerala; Alappuzha, Kottayam, and Ernakulam. The dying Konothupuzha River waits for revival and TRURA takes up this issue of river conservation. The residents of trippunithura have taken up the issue of the conservation of the river and submitted a memorandum to water resource minister Mathew T Thomas. Many industries are located near the river which I, directly and indirectly, harmful to the river.
➢ Kanjiramattom
It is a suburban area of the city of Kochi, Kerala lies approximately 25 km southeast of the city of Kochi the river that connects millunkall and puthiyakavu is the Muvattupuzha river. The portion forms a canal which was a spot for travelers to dump waste. Many industries can directly or indirectly affect the river.
➢ Nadakkave
It is a small village/hamlet in Mulanthuruthy block, Ernakulam district in Kerala state, India. It comes under Marakkunnam panchayath. It is located east of the headquarters, Kakkanad, km from Mulanthuruth, y and 198 from the state capital -Trivandrum. This is the place on the border of Ernakulam Alappuzha district.
➢ Piravom
It is a municipality in Ernakulam district and a suburb of Kochi in the state of Kerala, India. It is situated around 30 km southeast of Kochi city center and around 40 Km north of Kottayam. It is famous for historic Hindu temples and Syrian Christian churches. The town lies 20 km from Muvattupuzha. A large number of small-scale and large-scale industries are present in and around Piravom.
➢ Pazhoor
It is situated 33 km towards the southeast of Kochi. It is astrology Centre Linked to the erumthrikovil temple. A unique phenomenon observed here is that the Muvattupuzha river flowing west from east changes direction on Reaching Temple. It retraces its path and flows east for a certain distance before diverting Again to the north and west
➢ Valamboor
It is a small village in the vadavercode Block in the Ernakulam district of Kerala state. It comes under Mazhuvannor panchayath.
Parameters Used
➢ Temperature
The most important source of heat for fresh water is generally the sun, although the temperature can also be affected by the temperature of water inputs (such as precipitation, surface runoff, groundwater, and water from upstream tributaries), heat exchanges with the air, and heat lost or gained by evaporation or condensation. Water temperature fluctuates between day and night (diurnal temperature changes) and over longer periods (e.g., seasonally). Water temperature varies along the length of a river with latitude and elevation, but can also vary between small sections only meters apart, depending on local conditions. The most common physical assessment of water quality is the measurement of temperature. Temperature impacts both the chemical and biological characteristics of surface water. It affects the dissolved oxygen level in the water, photosynthesis of aquatic plants, metabolic rates of aquatic organisms, and the sensitivity of these organisms to pollution, parasites, and disease. Warm water is less capable of holding dissolved oxygen. For this reason, the temperature should be measured at the same place within the stream at which dissolved oxygen is measured. This allows the correlation between the two parameters to be observed. The problem of low dissolved oxygen levels is magnified by the fact that the metabolic rates of aquatic plants increase as after temperature rises, thus increasing their biochemical oxygen demand. Low dissolved oxygen levels leave aquatic organisms in a weakened physical state and more susceptible to disease.
➢ Electrical Conductivity (Ec)
➢ An electrical current results from the motion of electrically charged particles in response to forces that act on them from an applied electric field. In water and ionic materials or fluid,s a net motion of charged ions can occur. This phenomenon produces an electric current and is called ionic conduction.
➢ Electrical conductivity is defined as the ratio between the current density (J) and the electric field intensity (e) and it is the opposite of the resistivity (r, [W*m]):
➢ s = J/e
Silver has the highest conductivity of any metal: 63 x 106 S/m.
Water conductivity: Pure water is not a good conductor of electricity. Ordinary distilled water in equilibrium with carbon dioxide in the air has a conductivity of about 10 x 10-6 W-1*m-1 (20 dS/m). Because the electrical current is transported by the ions in solution, the conductivity increases as the concentration of ions increases. Thus, conductivity increases as water dissolved ionic species.
➢ Electrical Conductivity And Tds
➢ TDS or Total Dissolved Solids is a measure of the total ions in solution. EC is a measure of the ionic activity of a solution in terms of capacity to transmit current. In dilute solution, TDS and EC are reasonably comparable. The TDS of a water sample based on the measured EC value can be calculated using the following equation:
➢ TDS (mg/l) = 0.5 x EC (dS/m or mho/cm) or = 0.5 * 1000 x EC (mS/cm)
➢ The above relationship can also be used to check the acceptability of water chemical analyses. It does not apply to wastewater. As the solution becomes more concentrated (TDS > 1000 mg/l, EC > 2000 ms/cm), the proximity of the solution ions to each other depresses their activity and consequently their ability to transmit current, although the physical amount of dissolved solids is not affected. At high TDS values, the ratio TDS/EC increases and the relationship tends toward TDS = 0.9 x EC.
In these cases, the above-mentioned relationship should not be used and each sample should be characterized separately. For water for agricultural and irrigation purposes, the values for EC and TDS are related to each other and can be converted with an accuracy of about 10% using the following equation:
TDS (mg/l) = 640 x EC (ds/m or mho/cm).
➢ With the reverse osmosis process, water is forced into a semiimpermeable membrane leaving the impurities behind. This process is capable of removing 95-99 % of TDS, providing pure or ultra-pure water.
➢ Tds And Ph
TDS stands for total dissolved solids and represents the total concentration of dissolved substances in water. TDS is made up of inorganic salts, as well as a small amount of organic matter. Common inorganic salts that can be found in water include calcium, magnesium, potassium, and sodium, which are all cations, carbonates, nitrates, bicarbonates, chloride’s and sulfates, which are all anions. Cations are positively charged ions and anions are negatively charged ions.
How do these solids end up dissolved in water?
These minerals can originate from several sources, both natural and as a result of human activities. Mineral springs contain water with high levels of dissolved solids because the water has flowed through a region where the rocks have a high salt content. The water in the Prairie Provinces tends to have high levels of dissolved solids, because of high the amounts of calcium and magnesium in the ground. These minerals can also come from human activities. Agricultural and urban runoff can carry excess minerals into water sources, as can a wastewater discharge that is used to de-ice roads.
What happens to the water when the Tds level is high?
Alone, a high concentration of dissolved solids is usually not a health hazard. Many people buy mineral water, which has naturally elevated levels of dissolved solids. The United States Environmental Protection Agency (EPA), which is responsible for drinking water regulations in the United States, includes TDS as a secondary standard, meaning that it is a voluntary guideline in the United States. While the United States set legal standards for many harmful substances, TDS, along with other contaminants that cause aesthetic, cosmetic, and technical effects, has only a guideline. Most people think of TDS as being an aesthetic factor. In a study by the World Health Organization, a panel of tasters came to the following conclusions about the preferable level of TDS in water:
What are the guidelines for Tds?
In Canada, substances that are considered to be dangerous in high amounts are listed as Maximum Acceptable Concentrations (MACs) in the Canadian Guidelines for Drinking Water Quality. However, substances that are not considered dangerous at their MAC, such as TDS, are given an aesthetic objective in the Guidelines. The Canadian guideline for TDS is less than 500 milligrams per liter (which is the same as 500 parts per million). However, since the Canadian guidelines are not enforceable, each province is free to choose whether or not it will follow the guidelines. Saskatchewan has water that naturally contains high concentrations of TDS, so the province has chosen to not follow the Canadian guideline of 500 parts per million.
How can water treatment facilities remove Tds?
Water treatment facilities can use reverse osmosis to remove the dissolved solids in the water that are responsible for elevated TDS levels. Reverse osmosis removes virtually all dissolved substances, including many harmful minerals, such as salt and lead. It also removes healthy minerals, such as calcium and magnesium, and ideally, such water should be filtered through a magnesium and calcium mineral bed to add the minerals to the water. The mineral bed also increases the pH and decreases the corrosive potential of the water.
➢ Oxidation-Reduction Potential
Oxidation-reduction potential (ORP) measures the ability of a lake or river to cleanse itself or break down waste products, such as contaminants, dead plants, and animals. When the ORP value is high, there is lots of oxygen present in the water. This means that bacteria that decompose dead tissue and contaminants can work more efficiently. In general, the higher the ORP value, the healthier the lake or river is. However, even in healthy lakes and rivers, there is less oxygen (and therefore lower ORP values) as you get closer to the bottom sediments (mud; see the picture below of a lake bottom). This is because many bacteria are working hard in the sediments to decompose dead tissue, and they use up a lot of the available oxygen.
ORP measures an aqueous system’s capacity to either release or accept electrons from chemical reactions. When a system tends to accept electrons it is an oxidizing system. When it releases electrons it is a reducing system. In wastewater, ORP measurement is used frequently to control treatment processes that employ biological treatment solutions for removing contaminants. Oxidation-reduction potential offers many advantages to “real-time” monitoring and recording of water disinfection potential, a critical water quality parameter. Improvements in probe design and continuous digital recording via computer-linked data input are available. Record keeping can become a largely automated activity. A practical benefit of measuring ORP in postharvest uses such as transport flumes bind ranchers, cooling flumes, hydro coolers, water-spray vacuum cooling, and ice production, is that ORP values accurately define the antimicrobial potential of the water for free-floating microbes.
➢ pH Scale
The pH scale is logarithmic, which means that each step on the pH scale represents a ten-fold change in acidity. For example, a water body with a pH of 5.0 is ten times more acidic than water with a pH of 6.0. And water with a pH of 4.0 is 100 times more acidic than water with a pH of 6.0.
How does the ph of a water source change?
Surface water typically has a pH value between 6.5 and 8.5 and groundwater tends to have a pH between 6.0 and 8.5. The pH of a water source can vary naturally. Some types of rock and soil, such as limestone, can neutralize acid more effectively than other types of rock and soil, such as granite. Or, when there are a large number of plants growing in a lake or river, they release carbon dioxide when they die and decompose. When the carbon dioxide mixes with the water, a weak carbonic acid is formed; this can then cause the pH of the water body to decrease. Chemical pollution, from industrial operations, individuals, and communities, can cause a water body to become acidic. These chemicals can enter the water through illegal discharges or after inadequate wastewater treatment.
What happens when the ph of the water changes?
A change in the pH of water can have several consequences. In the environment, many plants and animals are harmed, or even killed, as a result of acidification. Many varieties of fish and aquatic life are extremely sensitive to changes in water temperature and composition.
Required Ph Level for the Survival of Common Species of Fish
Acidic water is synergistic, which means that a combination of a low pH and an increased concentration of certain substances is far more harmful than the sum of the parts. For example, aluminum, lead, and mercury are potentially dangerous substances, but when the pH of the water source is already low, these substances can have extremely detrimental consequences for aquatic life. Acidic water can also cause problems for human consumption. While slightly acidic water is not dangerous, on its own, it can be quite dangerous when combined with other compounds. Water with a pH that is less than 6.5 can leach metal ions, including iron, manganese, copper, lead, and zinc from plumbing fixtures and pipes. This, in return, can be quite dangerous. On the other end of the pH scale, water that has a pH greater than 8.0 can be difficult to disinfect.
What are the guidelines for ph?
Like TDS, pH is given an aesthetic objective in Canada. The Canadian guidelines for drinking water quality suggest that the pH of drinking water should be between 7.0 and 10.5. The Saskatchewan drinking water standards and objectives recommend that the pH of drinking water be between 6.5 and 9.0. In the United States, pH is, like TDS, a secondary standard; the secondary maximum contaminant level for pH is between 6.5 and 8.5. According to the Epa, the noticeable effects of a Hh that is less than 6.5 include a bitter, metallic taste and corrosion. The noticeable effects of a pH above 8.5 include a slippery feeling, soda-like taste, and deposits.
How do water treatment facilities change the ph of water?
Several methods can increase the pH of water, before disinfection. The pH is commonly increased using sodium carbonate and sodium hydroxide, but a better way of dealing with low pH is to use calcium and magnesium carbonate, which not only will increase pH levels but will also make the water less corrosive and both calcium and magnesium are of health benefits as opposed to sodium.
Why is it important to monitor Tds and ph?
It is important to monitor the TDS level and the pH of drinking water for several reasons. When a water source has a high level of TDS or a low pH, there are likely other harmful contaminants in the water. Both TDS and pH are also easy to measure and if something is happening to water, such as pollution, chances are both TDS and pH levels will change so keeping track of those changes can act as an early warning signal that something is happening to the water. For these reasons, it is important to monitor the TDS and pH levels, so that if they change, action can be taken immediately.
The Advantages of the Ph/Ec/Tds/Salinity Meter (Pets) 372 at a Glance:
1) Measurement of pH, mV, EC (Electrolyte Conductivity), TDS, and Salinity are possible by pH, E, TDS, or Salinity (Any of one at a time) parameters displayed along with the temperature of sample240 * 128 Monochrome LCD Display
2) Back up for calibration data
3) 500 Measured readings data stored for all four parameters along with temperature
4) Recall saved data for the view, print, etc.
5) In pH mode: 2, 3, 4 & 5 point calibration option, with user & STD buffer selection
6) Measurement Display with BIG FONT
7) Hold function
8) Temperature compensation Auto / Ma
Results and Observations
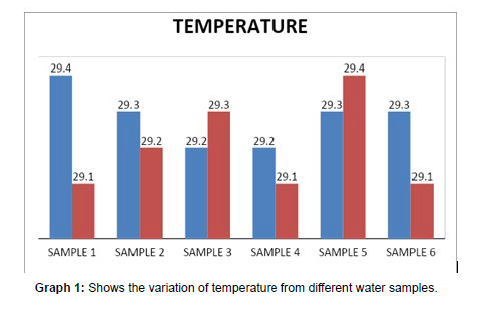
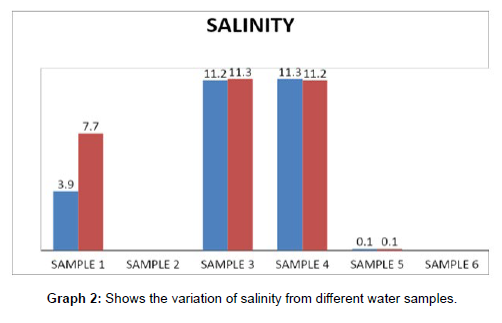
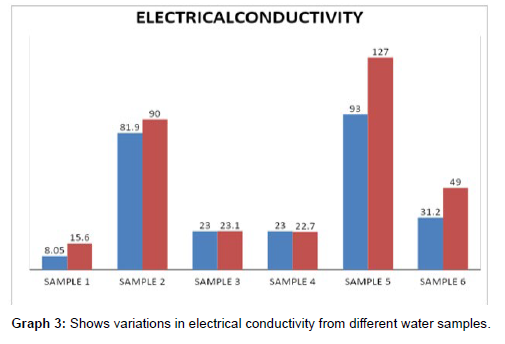
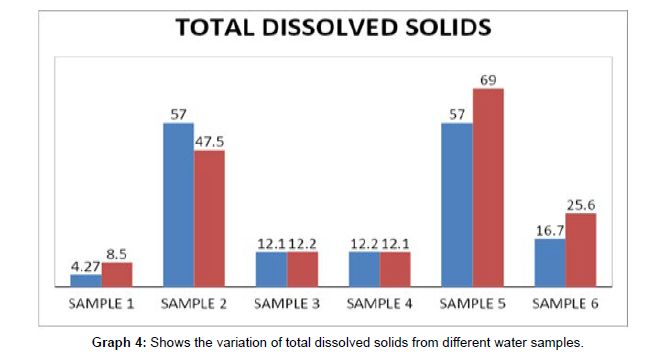
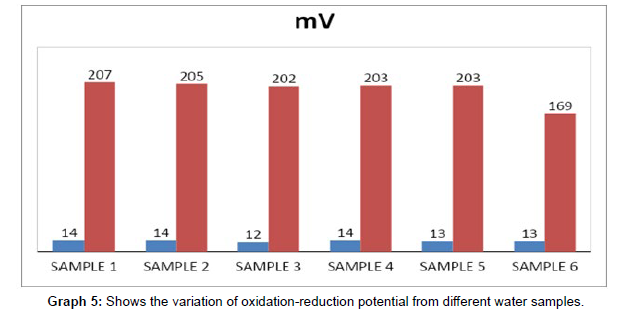
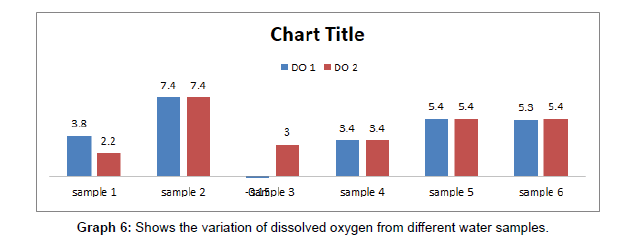
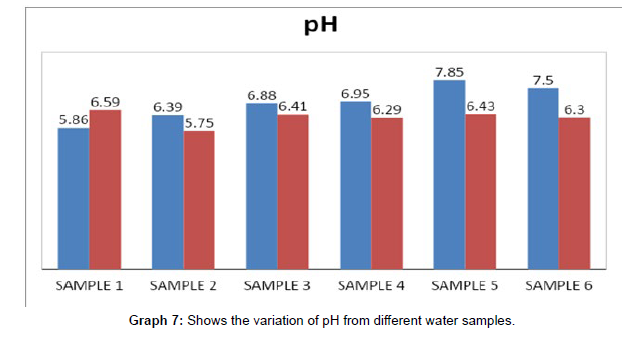
The observations revealed that there were considerable variations in the tested parameters in the examined water samples. The results of the analysis of various physio-chemical parameters of water of S1, S2, S3, S4, S5, and S6 stations were summarized in the following tables and graphs [Graph 1-7]. A comparison of the physical and chemical characteristics of the studied water samples has also been made with WHO standards (1993) and BIS standards (1991) [Table 1].
| Sl. No | Parameters | ||||
|---|---|---|---|---|---|
| 1 | Temperature - o C | 29.4 | 29.1 | ||
| 2 | Salinity - ppt | 3.9 | 7.7 | ||
| 3 | Electrical conductivity-mS/cm | 8.05 | 15.6 | ||
| 4 | TDS - ppm | 4.27 | 8.3 | ||
| 5 | ORP - mV | 14 | 207 | ||
| 6 | pH | 5.86 | 6.59 | ||
| 7 | Dissolved Oxygen - mg/L | 3.8 | 2.2 |
Table 1: Result of the parameters analyzed in water samples collected from the S1 station.
Discussion
Temperature
Temperature is one of the most important factors in the aquatic environment (Singh et al, 2005) [Table 2-3]. Temperature also affects the solubility of oxygen in the water. Solubility of oxygen in water increases with decreasing temperature (Joshi et al, 2001). During water quality analysis temperature was in the range of 29.10°C to 29.40°C. From the samples collected from different stations during the first analysis, it was observed that S1 had the highest temperature (29.4°C) and S3 and S4 had the lowest temperature (29.2°C). After one week the observations denoted that the highest temperature was present in S5 (29.4°C) and the lowest temperature was found in S1, S4, and S6 (29.1°C). The values were plotted using a bar diagram for the easiness of comparison. It was also shown in [Table 4-8]. Even though many pronouncing variations were not felt in temperature, there was a slight increase in the temperatures for S3 and S5 which can have serious impacts on aquatic life, including bacteria, algae, invertebrates, and fish.
| Sl. No | Parameters | ||
|---|---|---|---|
| 1 | Temperature- o C | 29.3 | 29.2 |
| 2 | Salinity-ppt | 0 | 0 |
| 3 | Electrical conductivity-mS/cm | 81.9 | 90 |
| 4 | TDS – ppm | 57 | 47.5 |
| 5 | ORP - mV | 14 | 205 |
| 6 | Ph | 6.39 | 5.75 |
| 7 | Dissolved Oxygen - mg/L | 7.4 | 7.4 |
Table 2: Result of the parameters analyzed in water samples collected from the S2 station.
| SL NO | PARAMETERS | ||
|---|---|---|---|
| 1 | Temperature- o C | 29.2 | 29.3 |
| 2 | Salinity-ppt | 11.2 | 11.3 |
| 3 | Electrical conductivity-mS/cm | 23 | 23.1 |
| 4 | TDS | 12.1 | 12.2 |
| 5 | ORP-mV | 12 | 202 |
| 6 | pH | 6.88 | 6.41 |
| 7 | Dissolved Oxygen-mg/L | -0.15 | 3 |
Table 3: Result of the parameters analyzed in water samples collected from the S3 station.
| SL NO | PARAMETERS | ||
|---|---|---|---|
| SAMPLE 1 | SAMPLE2 | ||
| 1 | Temperature -o C | 29.2 | 29.1 |
| 2 | Salinity-ppt | 11.3 | 11.2 |
| 3 | Electrical conductivity-mS/cm | 23 | 22.7 |
| 4 | TDS | 12.2 | 12.1 |
| 5 | ORP-mV | 14 | 203 |
| 6 | pH | 6.95 | 6.29 |
| Dissolved Oxygen-mg/L | 3.4 | 3.4 | |
| 7 |
Table 4: Results of parameters analyzed in water samples collected from S4 stations.
| SL NO | PARAMETERS | SAMPLE 1 | SAMPLE2 |
|---|---|---|---|
| 1 | Temperature- o C | 29.3 | 29.4 |
| 2 | Salinity- ppt | 0.1 | 0.1 |
| 3 | Electrical conductivity- mS/cm | 93 | 127 |
| 4 | TDS | 57 | 69 |
| 5 | ORP- mV | 13 | 203 |
| 6 | pH | 7.85 | 6.43 |
| 7 | Dissolved Oxygen-mg/L | 5.4 | |
| 5.4 |
Table 5: Results of parameters analyzed in water samples collected from S5 stations.
| SL NO | PARAMETERS | SAMPLE 1 | SAMPLE2 |
|---|---|---|---|
| 1 | Temperature- o C | 29.3 | 29.1 |
| 2 | Salinity-ppt | 0 | 0 |
| 3 | Electrical conductivity-mS/cm | 31.2 | 49 |
| 4 | TDS | 16.7 | 25.6 |
| 5 | ORP-mV | 13 | 169 |
| 6 | pH | 7.50 | 6.30 |
| 7 | Dissolved Oxygen-mg/L | 5.3 | 5.4 |
Table 6: Results of parameters analyzed in water samples collected from S6 stations.
| Sl. No | Parameters | ||||||
|---|---|---|---|---|---|---|---|
| S1 | S2 | S3 | S4 | S5 | S6 | ||
| 1 | Temperature | ||||||
| 29.4 | 29.3 | 29.2 | 29.2 | 29.3 | 29.3 | ||
| 2 | Salinity | ||||||
| 3.9 | 0 | 11.2 | 11.3 | 0.1 | 0 | ||
| 3 | EC | ||||||
| 8.05 | 81.9 | 23 | 23 | 93 | 31.2 | ||
| 4 | TDS | ||||||
| 4.27 | 57 | 12.1 | 12.2 | 57 | 16.7 | ||
| 5 | OR | ||||||
| 14 | 14 | 12 | 14 | 13 | 13 | ||
| 6 | pH | ||||||
| 5.86 | 6.39 | 6.88 | 6.95 | 7.85 | 7.5 | ||
| 7 | DO | 3.8 | 7.4 | 0.15 | 3.4 | 5.4 | 5.3 |
Table 7: Comparison of the Result of Parameters of Water Samples from Different Stations.
| Sl. No | Parameters | ||||||
|---|---|---|---|---|---|---|---|
| S1 | S2 | S3 | S4 | S5 | S6 | ||
| 1 | Temperature | ||||||
| 29.1 | 29.2 | 29.3 | 29.1 | 29.4 | 29.1 | ||
| 2 | Salinity | ||||||
| 7.7 | 0 | 11.3 | 11.2 | 0.1 | 0 | ||
| 3 | EC | ||||||
| 15.6 | 90 | 23.1 | 22.7 | 127 | 49 | ||
| 4 | TDS | ||||||
| 8.3 | 47.5 | 12.2 | 12.1 | 69 | 25.6 | ||
| 5 | OR | ||||||
| 207 | 205 | 202 | 203 | 203 | 169 | ||
| 6 | pH | ||||||
| 6.59 | 5.75 | 6.41 | 6.29 | 6.43 | 6.3 | ||
| 7 | DO | 2.2 | 7.4 | 3 | 3.4 | 5.4 | 5.4 |
Table 8: Comparison of the Result of Parameters of Water Samples from Different Stations.
Salinity
Salinity is a factor that can change the entire composition of water and can indicate the utility of the water source which can directly affect the existence of organisms in it. The values of salinity showed variations from 0 ppt to 11.3 ppt. The highest value during the first analysis was obtained from S4 (11.3 ppt). It was clear that two water samples such as S2 and S6 were free of salinity during the first analysis and were confirmed for the same during the second analysis. Salinity is a factor, influencing the types of organisms that live in a water body as well as the kind of plants that will grow in it. The ability of an organism to live in saline water depends upon its ability to withstand the conditions.
Electrical conductivity
Electrical conductivity measures the amount of dissolved mineral content in water. A higher value of conductivity shows a higher concentration of dissolved ions. The conductivity of the water sample was found in the range of 8.05 mS/cm to 127 mS/cm which is much below the WHO standards. Conductivity is an important criterion in determining the suitability of water for irrigation. The maximum value of electrical conductivity (127 mS/cm) was found at sampling station S5 during the second analysis. The same station showed the next highest value (93 mS/cm) during the first analysis. So, the number of free ions is higher in the S5 sample. This was followed by (90 mS/ cm) sampling station S2. The last value (8.05 mS/cm) was recorded at sampling station S1 during the first analysis.
Total dissolved solids
The total dissolved solids is a measure of the dissolved combined content of all inorganic and organic substances present in a liquid in molecular, ionized, or micro-granular suspended form. The values obtained for total dissolved solids were in the range of 4.27 ppm to 69 ppm. The highest value obtained during the first was from S2 (57 ppm) and least value was from S1 (4.27 ppm). During the second analysis, S5 showed the highest value of 69ppm and S1 showed the least value of 8.3. According to the classification of waters into freshwater, brackish water, saline water, and hypersaline water TDS values indicated that all the water samples are freshwater as the TDS is less than 1000 mg/l. Fresh water usually has TDS levels between 0 and 1,000 mg/L, depending on the geology of the region, climate and weathering, and other geographical features that affect sources of dissolved material and its transport to a water system. Drinking water generally has a TDS below 500 mg/l. So, all the samples from different stations are potable given TDS.
Oxidation-reduction potential
The ORP value had a variation from lower to higher values ranging from 12 mV to 207 mV. The values were below 20 during the first analysis but increased drastically during the second analysis in all the samples. The values exceeded 200 mV. Observations of the first analysis denoted the highest value from S1, S3, and S4 and the least value was present in S3. The successive week showed an increase in the values S1 had the highest value of 207 mV and S3 had the lowest value of 202 mV.
Dissolved Solids
The maximum solubility of oxygen in water at 1 atm pressure (standard air pressure at sea level) ranges from about 15 mg/L at 0ºC to 8 mg/L at 30ºC—that is, ice-cold water can hold twice as much dissolved oxygen as warm water (Wetzel 2001). Dissolved oxygen is essential for a healthy aquatic ecosystem. Fish and aquatic animals need oxygen dissolved in the water to survive. The need for oxygen depends on the species and life stage; some organisms are adapted to lower oxygen conditions, while others require higher concentrations. Dissolved oxygen can affect the solubility and availability of fresh water.
pH
The pH of water samples was found in the range of 5.75 -7.85, slightly acidic. The maximum value of pH was recorded at sampling station 5 during the first week (7.85) which is slightly alkaline and the minimum value of pH was recorded at sampling station 2 during the second week (5.75) which is slightly acidic. The maximum permissible limit of pH as prescribed by WHO is 6.5 to 8.5. Even though, sample 5 and sample 6 were slightly alkaline during the first week it was observed to be acidic during the observations of the next week. So all the values kept the limit and proved to be safe for aquatic life.
Conclusion
Water is a precious resource that requires proper management to make it available for use. Development and conservation must go hand in hand so that both neutralize the demerits of each other. Analysing the reasons for contamination is equally important to mitigating measures. This work helped to know the reasons behind the quality of water being reduced.
References
- Divya Bhardwaj, Neethu Verma (2017) Research paper on analysing the impact of various parameters on water quality Index Int j adv res 0976-5697
- Prof Jency Nadayil, Aabhijith KA, Aby Sunny (2018) Studies on groundwater quality in and around Muvattupuzha Municipality, Kerala, India Int J Eng Sci 2318-6726
- Girish Gopinath (2003) An integrated hydrological study of the Muvattupuzha river basin, Kerala, India Dept Mar Geol and geo phy.
- Aswini P V, Chinnu Mary (2016) Groundwater quality analysis Int J Eng Res Technol 2278-0181
- Pooja Suresh, Liya Kalappuraikkal (2019) The influence of flood and variation in water quality index in river periyar, Kerala, India IOSR j environ Sci Toxicol food Technol.
Indexed at, Crossref, Google Scholar
Indexed at, Crossref, Google Scholar
Citation: James S (2023) Water Quality Analysis of parts of Muvattupuzha River, Kerala, India (2019-2020 case study). J Bioremediat Biodegrad, 14: 553.
Copyright: © 2023 James S. This is an open-access article distributed under the terms of the Creative Commons Attribution License, which permits unrestricted use, distribution, and reproduction in any medium, provided the original author and source are credited.
Select your language of interest to view the total content in your interested language
Share This Article
Recommended Journals
Open Access Journals
Article Usage
- Total views: 5875
- [From(publication date): 0-2023 - Dec 09, 2025]
- Breakdown by view type
- HTML page views: 4946
- PDF downloads: 929

