Research Article Open Access
Spectrophotometric Determination of Uric Acid in Urine Based-Enzymatic Method Uricase with 4-Aminodiphenylamine Diazonium Sulfate (Variamine Blue RT Salt)
Hairul Hisham Hamzah1,3*, Zainiharyati Mohd Zain2 , Nor Lailatul Wahidah Musa3 , Yun-Chun Lin1 and Emma Trimbee1
1School of Chemistry, University of Southampton, Highfield Campus, SO17 1BJ, Southampton, UK
2Faculty of Applied Sciences, Universiti Teknologi MARA (UiTM), 40450, Shah Alam Selangor, Malaysia
3Faculty of Applied Sciences, Universiti Teknologi MARA Pahang, 26400, Jengka Pahang, Malaysia
- *Corresponding Author:
- Hairul Hisham Hamzah, PhD
School of Chemistry, University of Southampton
Highfield Campus, Southampton SO17 1BJ, UK
E-mail: hhh1v12@soton.ac.uk
Received date: March 30, 2013; Accepted date: June 05, 2013; Published date: June 07, 2013
Citation: Hamzah HH, Zain ZM, Musa NLW, Lin YC, Trimbee E (2013) Spectrophotometric Determination of Uric Acid in Urine Based-Enzymatic Method Uricase with 4-Aminodiphenylamine Diazonium Sulfate (Variamine Blue RT Salt). J Anal Bioanal Tech S7:011. doi: 10.4172/2155-9872.S7-011
Copyright: © 2013 Hamzah HH, et al. This is an open-access article distributed under the terms of the Creative Commons Attribution License, which permits unrestricted use, distribution, and reproduction in any medium, provided the original author and source are credited.
Visit for more related articles at Journal of Analytical & Bioanalytical Techniques
Abstract
A simple spectrophotometric method based-uricase enzyme for the detection of uric acid in normal urine and gout patient’s urine samples has been developed based on the reaction of hydrogen peroxide (H2O2) with yellow color of 4-Aminodiphenylamine Diazonium Sulfate (variamine blue RT salt) to yield a pale yellow-green coloured solution. The absorbance of products as the output of enzymatic reaction and variamine blue RT salt were detected using uv-visible spectrophotometer with maximum absorbance at 269 nm. The response time of this proposed method was 20 minutes. The optimum pH activity on enzymatic and variamine blue RT salt reactions was foud to be pH 9. The relative standard deviation (RSD) of the reproducibility of this method was very good at 0.7%. The calibration plot of different concentrations of uric acid was found to be between 0.5-13 mM with a detection limit of 0.58 mM. The kinetic parameters the Michaelis-Menten constant (KM) and the maximum abosrbance (Absmax) in the presence of different concentrations of uric acid were evaluated using the Linewaver-Burk and Hofstee plots respectively. The enzymatic-spectrophotometric method was compared with established clinicalmethod and satisfactory agreement was achieved.
Keywords
Biosensor; Uric acid; Spectrophotometric determination; Uricase enzyme; Urine samples
Introduction
Uric acid is the primary end-product of purine metabolism and excreted in the urine. It is derived from purines arising from the catabolism of dietary and endogenous nucleic acid stem from increased catabolism dysfunction of one of the shunt pathways which leads to increased urate production [1]. The assay of uric acid in body fluids (e.g: serum and urine) is a clinically valuable diagnostic indicator. Normally, uric acid is present in the blood in concentration range 0.15- 0.45 mmol/L and excreted in urine in 1.19-2.98 mmol/day [2]. The presence of elevated uric acid levels is a sign of gout, hyperuricemia, or Lysch-Nyhan syndrome. Similarly, elevated uric acid levels are related to other conditions including increased alcochol consumption, obesity, diabeties, high cholestrol, kidney disease, and heart diseases. Many epidemiological studies have suggested that serum uric acid is also a risk factor for cardiovascular disease [3]. Therefore, it is necessarily to develop a reliable analytical method for the detection and quantification of uric acid in urine. Monitoring uric acid in the urine is important because it can be used as a powerful indicator for an early warning sign of kidney diseases [4].
There are many standard analytical methods that have been reported in the literatures for uric acid determination. The levels of uric acid in different biological matrices such as urine and serum have been determined by numerous standard analytical methods such as reversedphase liquid chromotography [5], potentiometric enzyme electrode [6] and flow injection analysis system with tubular amperometric detector [7]. All the analytical methods are well established and exhibit a large range of advantages. However, these methods also have weaknesses such as they are still under development, time-consuming, expensive, cannot be performed easily outside the laboratory and need very highly skilled technicians. On the other hand, early-warning systems are needed for scientists to react in case of contamination pollution.
Biosensor technology is a powerful alternative to coventional analytical techniques, harnessing the specificity and sensitivity of biological systems in small and low cost devices. Biosensors are defined as measurement devices that utilize chemical or biological reactions to detect and quantify a specific analyte. Biosensors consists of an analyte-specific bioreceptor (enzyme, antibody, nucleic acid, tissue, cell or microorganism) and a physical transducer element(electrode, optical, mass, or quartz) which converts the change in the receptor to a detectable signal [8]. In enzyme-based determination, the enzyme reacts selectively with its substrate associated with or intergrated within a physico-chemical transducers may be optical, electrochemical, thermometric, piezoelectric or magnetic [9].
The spectrophotometric method is the quantitative measurement of the reflection or transmission properties of a material as a function of wavelength. It is more specific than the general terms of electromagnetic spectroscopy in that spectrophotometry deals with visible light, near-ultraviolet, and near-infrared, but does not cover time-resolved spectroscopic techniques. The Spectrophotometric method involves the use of a spectrophotometer. A spectrophotometer is a photometer (a device for measuring light intensity) that can measure intensity as a function of the light source wavelength. Important features of spectrophotometers are spectral bandwidth and linear range of absorption or reflectance measurement [10]. The UV-visible spectrophotometer equipment will be adopted for the determination of uric acid in urine because it is attractive procedure and widely used in routine analysis around the world. A spectrophotometric technique is always an acceptable chemical analysis method, due to its acceptable precision and accuracy. The advantages of this method are low implementation, low maintenance costs and good analytical frequency [11]. In spectrophotometric trace analysis, knowledge of the sensitivity of the colour of the reaction employed of paramount importance and it is necessary to have a simple method available for the expression of the sensitivity. The common method of using the spectrophotometer requires the construction of the standard curve (also called the analytical reference of calibration curve) for the constituents being the determined. For this purpose, suitable of the constituent are taken and treated exactly the same way as the sample solution for the development of the colour measurement of the transmittance at the optimum wavelength [12].
Recently, a few reports on spectrophotometric determination of uric acid using diffrent approaches have been reported [1,13-16]. In this work, the development of the spectrophotometric method for the determination of uric acid is based on oxidation of uric acid in the presence of uricase will produce products of allantoin, CO2, and H2O2 respectively. Then, the concentration of uric acid can be related to the yielding and reactions of H2O2 with variamine blue RT to form a pale yellow-green product. Based on previous studies, there are few works reported on quantitatively reactions of the pale blue colored variamine blue B dye with H2O2 to form an intense violet color [17-19]. Nevertheless, the sensing scheme based upon ezymatic reaction of uricase with uric acid and Variamine blue RT Salt has not yet been reported. The sensing scheme is based on the changing of yellow variamine blue RT solution into the pale yellow-green species, due to the reaction between hydrogen peroxide and variamine blue RT. Experimental parameters such as response time study, spectral study, pH optimization, reproducibility of the method, calibration of the developed method, kinetic study, interference study, and real sample analysis were performed. The developed spectrophotometric method was validated against well established method from clinical laboratory (Pathlab Sdn Bhd).
Experimental Procedure
Ultraviolet-visible spectrophotometer (Varian-Carry Win) was used to study on determination of uric acid based on an enzymatic reaction of uricase with the presence of dye Variamine Blue RT salt. The measurement of wavelength for absorbance spectra on this procedure was fixed in the range of from 230-500 nm. Quartz cuvettes were used in this procedure.
Materials and Methods
Reagent
Uricase enzyme from Bacillus fastidiosus (18.8 units mg-1), Uric Acid and Variamine Blue RT Salt were purchased from Sigma Aldrich. 0.05 M borax buffer solution was prepared and used as buffer throughout the analysis. 5 mg of Uricase enzyme was dissolved in 100 ml of 0.05 M borax buffer and was stored at 3°C. 0.29 g of variamine blue RT salt (yellow powder) was dissolved in 100 ml of deionized water. The stock solution of 9.9×10⁻³ M variamine blue RT solution was stored in refrigerator at 3°C. Stock solution of 20 m Muric acid was prepared by dissolving 1.68 g of uric acid in 500 ml of hot deionized water with addition of 300 μL of 0.6 M NaOH. A series of different concentrations of uric acid were prepared by appropriate dilution of the stock solution.
Procedure
A mixture volume of 2 mL Uricase, 1 mL of 10 mM Uric acid, and 1 mL of 0.1 mM Variamine blue RT salt solutions were transferred to a sample vial. The solution was left for 20 minutes to allow the reaction to go to completion. The measurements were carried out using a UV-Vis Spectrophotometer (Varian-Cary Win).
Real sample analysis
Urine samples were obtained from 2 male volunteers. One volunteer is healthy and another one of volunteer is a gout patient. The urine samples were collected 24 hours before analysis and kept in refrigerator at 3°C. The urine samples were centrifuged for 15 min in 4000 rpm. 1 ml of urine samples were 25-fold diluted with Milli-Q water and then were filtered through 0.45 m pore filter. The uric acid concentration in the sample was determined using the calibration graph of the developed method. In addition, for validation study the urine samples were sent to Pathlab Sdn Bhd in Malaysia for determination of uric acid based on established clinical method.
Result and Discussion
Spectral study
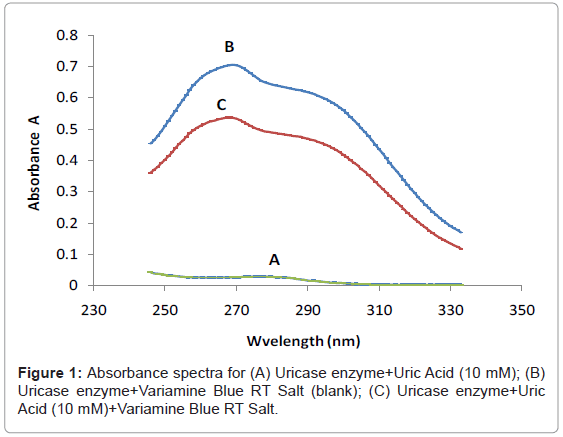
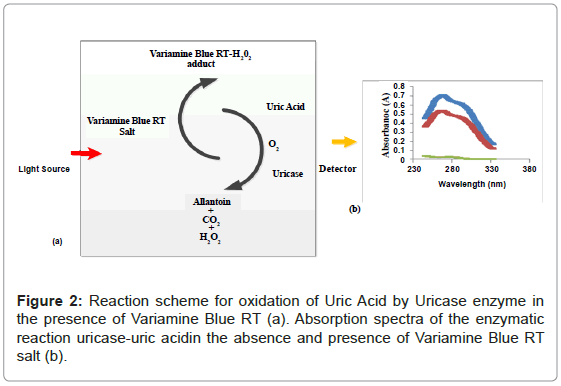
Figure 1 shows the three absorbance spectras of the different mixture of uric acid (UA), uricase enzyme and variamine blue RT salt solutions respectively. Absorbance spectra A was obtained by mixturing of uric acid and uricase enzyme solutions and no resultant absorption peak was observed in the absence of variamine blue RT reagent. By contrast, the absorbance spectras for B (blank) and C were produced with the presence of variamine blue RT solution. Quantitatively, in the presence of uricase enyzme, uric acid will be oxidized into allantonin, carbon dioxide and hyrogen peroxide (H2O2 ) respectively until the equlibrium state (Figure 2) [20-22]. The principle measurements for uric acid concentration is based on the reaction of hydrogen peroxide with yellow variamine blue RT to a pale yellow-green coloured products. Furthermore, this response is proportional to the uric acid concentrations and can be monitored spectrophotometrically.Hence, the absorbance spectra (C) reveals that the maximum absorption at wavelength of 269 nm. Thus, this wavelength was chosen as the optimum wavelength for the following analytical purposes.
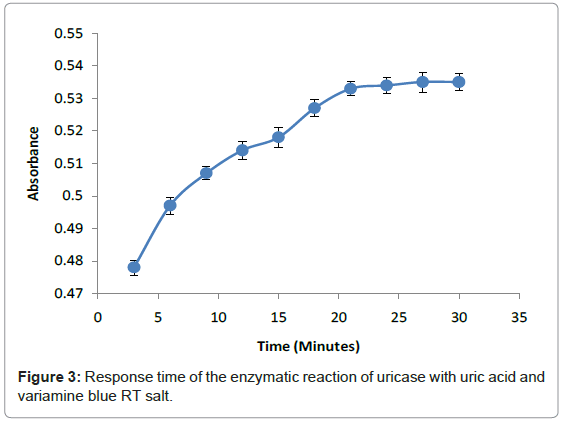
The response time of this method relied on enzymatic reaction of uricase with uric acid and hydrogen peroxide with Variamine Blue RT respectively at different times (2-20 minutes) (Figure 3). The response time was determined by steady signal that produced in 20 minutes when absorbance was constant. From this study, it can be concluded that the entire enzymatic reaction required 20 minutes to attain an equilibrium state. This response time was chosen as the acquisition time for all analytical purposes.
pH study
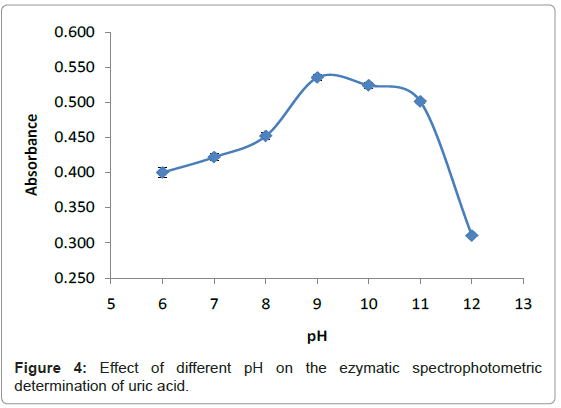
pH is a measure of concentration of hydrogen ions in a solution. The higher the hydrogen ion concentration, the lower the pH. Most enzymes function is only efficient over a narrow pH range. A change in pH above or below this range reduces the rate of enzyme reaction considerably. Changes in pH leads to the breaking of the ionic character of the side chain of the amino acid that hold the tertiary structure of the enzyme in place. The enzyme begins to lose its functional moiety, particularly the active site. When the substrate no longer is recognized by the active site, the enzyme is said to be denatured [23]. Also changes in pH, affect the charges on the amino acids within the active site such that the enzyme will not be able to form a specific enzyme-substrate complex. A suitable pH of enzyme plays an important role to provide an appropriate environment for the enzymatic reaction and pH at which enzyme catalysis a reaction at maximum rate is called the optimum pH. The Optimum pH was determined by studying the effect of different pH values (6-12) towards detection of uric acid. The pH values were adjusted to pH 6-12 by adding a few drops of 0.5 M sodium monobasic phosphate (NaH2PO4), 0.5 M of sodium dibasic phosphate (Na2HPO4) and 0.5 M of sodium hydroxide (NaOH) into the mixture of solutions respectively. Figure 4 illustrates the effect of pH for the detection of uric acid. The pH value of 9 was selected for the following analytical procedure. This value is in good agreement with previously reported results [21,24]. At pH 9, the enzyme catalyzed the reaction at the maximum rate and greatest amount of oxygen was produced. The amount of hydroxide ion pH 9 did not affect the charge of the tertiary structure and the charges of amino acids within the active site.
Reproducibility study
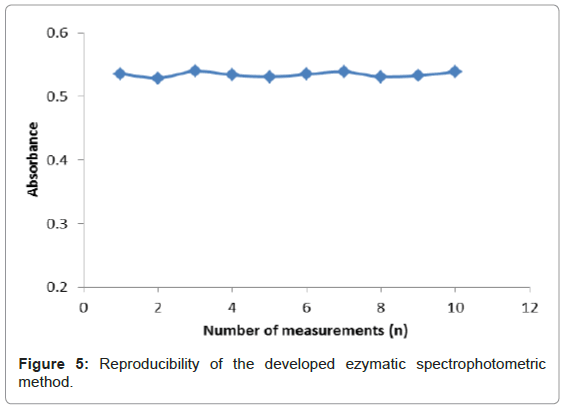
Reproducibility refers to the successive runs made using the same developed method to evaluate discrepancies between its responses. Figure 5 depicts the reproducibility of the enzymatic reactions of uricase, uric acid and variamine blue RT is based on ten measurements (n=10). The RSD for reproducibility of the developed method was calculated to be 0.7%. A small RSD value was observed for this method indicating a good precision of the method developed. The precision of an analytical method was dependent on the degree of agreement among individual test results when the method was applied repeatedly to the multiple samplings of the homogenous samples. This is usually expressed as the standard deviation or the relative standard deviation (coefficient of variation) [25]. The reproducibility data was obtained by repeatedly analyzing, in one laboratory within one day. The RSD value was important to show the degree of variation expected when the analytical procedure was repeated several times in a standard situation.
Calibration plot of uric acid
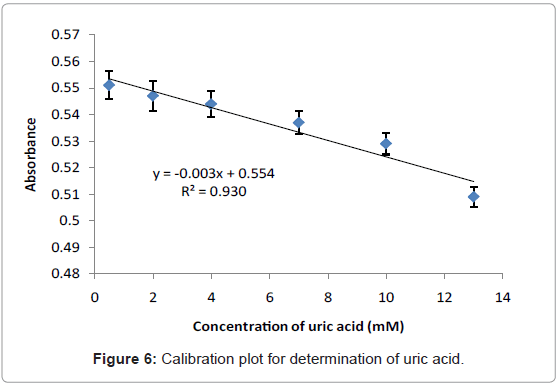
Figure 6 illustrates the linear response when uric acid concentration is within the range of 0.5-13 mM. The straight line obtained from this plot can be fitted by the linear regression (y=0.0031x+0.5549) and the calculated correlation coefficient (R2) was found to be 0.9307. The limit of detection (LOD) is defined as the concentration equivalent to a signal of blank plus three times the standard deviation of the blank was calculated to be 0.58 mM and it is higher than obtained by the electrochemical/optical biosensors-based immobilization uricase enzyme which are 1×10⁻³ mM [21], 8.5×10⁻⁴ mM [26], and (0.55 mM and 0.22 mM) [27] respectively. However, the LOD obtained is still under permitted levels (1.98-2.98 mM) [2].
Kinetic study
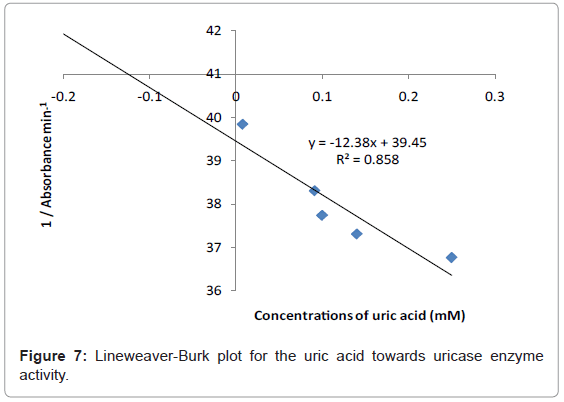
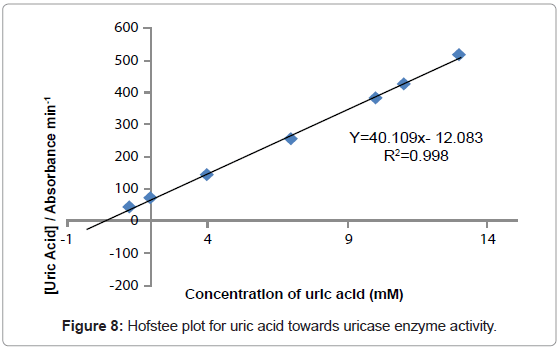
The study of the rate at which an enzyme works is called enzyme kinetics. The kinetics of uric acid on uricase enzyme was expressed and compared by Lineweaver-Burk and Hofstee equations respectively. The relationship of enzyme activity in the presence of different concentration uric acid was shown upon the double-reciprocal Lineweaver-Burk and Hofstee plots. The plots are expressed as linear plots of the same data derived from the enzyme kinetic reactions. The result is shown in Figures 7 and 8 respectively.
The KM and Absmax values for each plot can then be determined by the slope and the intercepts of the vertical and horizontal axes of these plots respectively. KM is defined as the concentration of the specific substrate at which a given enzyme yields one half its maximum velocities. A lower KM indicates that the enzymes requires only a small amount of substrate to become saturated and also shows greater affinity of the enzymes towards the substrate. Hence, the maximum velocity is reached at a relatively low substrate [28]. The KM constant and Absmax were calculated by the use of Lineweaver-Burk and Hofstee equations (Table 1). In addition, the KM values that were found on literature reviews for uric acid detection-based uricase are 1.57 mM and 0.90 mM [21,29]. Since the enzymatic reactions take place through a carrier medium, the affinity of the enzyme towards the substrate is not the same in every carrier media [21]. Therefore, it is considered normal different values of KM will be found on several literature reviews.
| Calculation Method | Lineweaver-Burk | Hofstee |
|---|---|---|
| Absmax | 0.0254 | 0.0249 |
| Michaelis Menten constant (KM) | 0.313 mM | 0.301 mM |
| Formula | 1/v = -12.385 1/[S] + 39.45 | [S] / v = 40.109 [S] -12.083 |
| Absmax calculation | Absmax = 1/c Absmax = 1/39.45 Absmax = 0.0254 |
Absmax = 1/m Absmax = 1/40.19 Absmax = 0.0249 |
| KM calculation | KM = m × Absmax KM = 12.385 × 0.0254 KM = 0.313 mM |
KM = c × Absmax KM = 12.03 × 0.0249 KM = 0.301 mM |
Table 1: Comparison of calculation methods for KM and Absmax based on Lineweaver-Burk and Hofstee equations.
Real sample analysis
The proposed method was applied for detection of uric acid in real samples. The 2-male volunteers’ urine were assayed in order to demonstrate the practical usage of the developed method. The concentration of uric acid in the samples was calculated using the constructed calibration curve (Figure 6) and the result is listed in Table 2. The results based on the developed method were compared with the results obtained using a established clinical method. The accuracy of the developed method was found to be high as verified by the t-test with two samples (paired t-test), at a confidence level of 95% (7.36<12.76), demonstrating that the results obtained by both developed method and clinical method are in excellent agreement. This indicates that it is possible to apply the developed method for determination of uric acid in urine samples.
| Sample | Clinical Method (mM) | Developed Method (mM) | Relative Erors (%) |
|---|---|---|---|
| Normal Urine | 2.83 ± 2 | 2.54 ± 5 | -11.4 |
| Gout Patient’s Urine | 5.24 ± 0.9 | 5.02 ± 3 | -3.6 |
Table 2: Determination of uric acid in urine samples by the developed spectrophotometric method and comparison with established clinical method.
Inteference study
Effects of the presence of interfering substances (ascorbic acid, urea, and glucose) on detection of uric acid were evaluated using 10 mM uric acid, and different concentrations of interfering substances. The degree of the interference of ascorbic acid, urea, and glucose towards detection of uric acid are listed in Table 3. From the listed results, all the foreign substances gave very lowest interference with the different signals. However, previous works by Syed et al. and Fatma, they reported that there were not any signal interferences detected for ascorbic acid, urea and glucose respectively [20,21]. In conrast the previous works by Yan and co-workers reported that slight interferences were seen in their methods for ascorbic acid, glucose and urea respectively [22].
| Substance | Interference % |
|---|---|
| Ascorbic Acid | 3.1 |
| Urea | 1.5 |
| Glucose | 0.3 |
Note: Interference (%)=[(x-y)/y]×100, where x is the average of absorbance value for mixed solution of uric acid and foreign substances, y is the average of absorbance value for uric acid solution only.
Table 3: Effect of possible interfering substances.
Conclusion
Some biosensors-based uricase enzyme immobilized and spectrophotometric methods for uric acid determination have been reported [13,16,20,21,27,30]. In this work, a simple spectrophotometric method for detection of uric acid in urine is based on enzymatic reaction of uricase, hyrogen peroxide and variamine blue RT Salt has been developed. A favourable use of dye Variamine blue RT salt (yellow) for determination of uric acid has been described based upon the formation of a pale yellow-green coloured adduct of Variamine blue RT-hydrogen peroxide. The optimized pH condition for operation was at pH 9. The response of the method was linear within substrate concentrations of 0.5-13 mM at the response time of 20 minutes. A good reproducibility (RSD=0.7%) was obtained using the developed method indicating a reliable detection system. The LOD value was 0.58 mM. The kinetic interpretations of the absorbance response of uric acid upon uricase were plotted using the Lineweaver-Burk and Hofstee plots respectively. The proposed method is simple, easy to operate, and able to detect uric acid in urine at the permitted level with satisfactory results.
Acknowledgement
The authors are indebted to the Research Management Institute (RMI), Universiti Teknologi MARA (UiTM), Shah Alam, Malaysia for funding under research project No.021000110032 as well as Ministry of Higher Education, Malaysia for support under Exploratory Research Grant Scheme (ERGS) project No. 600-RM1/ ERGS5/3(13/2012). Also, for Majlis Amanah Rakyat (MARA) for sponsoring Hairul Hisham Hamzah on his PhD studies at the University of Southampton, Highfield Campus, Southampton UK.
References
- Akyilmaz E, Sezgintürk MK, Dinçkaya E (2003) A biosensor based on urate oxidase-peroxidase coupled enzyme system for uric acid determination in urine. Talanta 61: 73-79.
- Chauhan N, Pundir CS (2011) An amperometric uric acid biosensor based on multiwalled carbon nanotube-gold nanoparticle composite. Anal Biochem 413: 97-103.
- Grabowska I, Chudy M, Dybko A, Brzozka Z (2008) Uric acid determination in a miniaturized flow system with dual optical detection. Sensors and Actuators B 130: 508-513.
- Ensafi AA, Dadkhah M, Karimi-Maleh H (2011) Determination of isoproterenol and uric acid by voltammetric method using carbon nanotubes paste electrode and p-chloranil. Colloids Surf B Biointerfaces 84: 148-154.
- Hausen A, Fuchs D, König K, Wachter H (1981) Quantitation of urinary uric acid by reversed-phase liquid chromatography. Clin Chem 27: 1455-1456.
- Kawashima T, Rechnitz GA (1976) Potentiometric enzyme electrode for uric acid. Anal Chim Acta 83: 9-17.
- Garcia MBQ, Lima JFLC, Silva ML, Sousa JP (2004) Automatic determination of uric acid in urine in a FIA system with tubular amperometric detector. Portugaliae Electrochimica Acta 22: 249-262.
- de Souza Gil E, de Melo GR (2010) Electrochemical biosensors in pharmaceutical analysis. Brazilian Journal of Pharmaceutical Sciences 46: 375-391.
- Hairul Hisham H, Nor Azah Y, Abu Bakar S, Fatimah AB (2011) Spetcrophotometric determination of benzoic acid based on inhibitive effect on tyrosinase enzyme. Asian Journal of Chemistry 23: 1133-1136.
- He X, Tubino M, Rossi AV (1999) Selective and sensitive spectrophotometric determination of total vanadium with hydrogen peroxide and 4-(2-pyridylazo)-resorcinol. Analytical Chimica Acta 389: 275-280.
- Figueiredo EC, de Oliveira DM, de Siqueira ME, Arruda MA (2009) On-line molecularly imprinted solid-phrase extraction for the selective spectrophotometric determination of nicotine in the urine of smokers. Anal Chim Acta 635: 102-107.
- Sandell EB (1959) Colorimetric determination of tracers of metals. Interscience Publishers, Inc, New York, pg. 75-110.
- Zhao H, Wang Z, Jiao X, Zhang L, Lv Y (2012) Uricase based highly sensitive andn selective spectrophotometric determination of uric acid using BSA-stabilized Au nanoclusters as artificial enzyme. Spectroscopy Letters 45: 511-519.
- Moghadam MR, Dadfarnia S, Shabani AM, Shahbazikhah P (2011) Chemometric-assisted kinetic-spectrophotometric method for simultaneous determination of ascorbic acid, uric acid, and dopamine. Anal Biochem 410: 289-295.
- Rocha DL, Rocha FRP (2010) A flow-based procedure with solenoid micro-pumps for the spectrophotometric determination of uric acid in urine. Microchemical Journal 94: 53-59.
- Sanz V, de Marcos S, Galbán J (2008) Uric acid determination using uricase and the autotransducer molecular absorption properties of peroxidase. Anal Chim Acta 607: 211-218.
- Khaled E, El-Ries MA, Zidane FI, Ibrahim SA, Abd-Elmonem MS (2011) Kinetic catalytic determination of trace levels of iodide based on the oxidation of basic dyes with hydrogen peroxide monitored potentiometrically using simple PVC electrodes. Talanta 83: 1538-1543.
- Elmorsy K, Hassan HNA, Moghieb AMH (2007) Flow injection spectrophotometric determination of iron based on its catalytic effect on the oxidation of variamine blue by hydrogen peroxide. J Flow Injection Anal 24: 109-113.
- El-Essi FA, Zuhri AZ, Al-Khalil SI, Abdel-Latif MS (1997) Spectrophotometric determination of enzymatically generated hydrogen peroxide using Sol-Gel immobilized horseradish peroxidase. Talanta 44: 2051-2058.
- Usman Ali SM, Alvi NH, Ibupoto Z, Nur O, Wilander M, et al. (2011) Selective potentiometric determination of uric acid with uricase immobilized on ZnO nanowires. Sensors and Actuators B: Chemical 152: 241-247.
- Cete S, Yasar A, Arslan F (2006) An amperometric biosensor for uric acid determination prepared from uricase immobilized in polypyrrole film. Artif Cells Blood Substit Immobil Biotechnol 34: 367-380.
- Zhang Y, Wen G, Zhou Y, Shuang S, Dong C, et al. (2007) Development and analytical application of an uric acid biosensor using an uricase-immobilized eggshell membrane. Biosens Bioelectron 22: 1791-1797.
- Choi JW, Kim YK, Lee IH, Min J, Lee WH (2001) Optical organophosphorus biosensor consisting of acetylcholinesterase/viologen hetero Langmuir-Blodgett film. Biosens Bioelectron 16: 937-943.
- Bhambi M, Sumana G, Malhotra BD, Pundir CS (2010) An amperomertic uric acid biosensor based on immobilization of uricase onto polyaniline-multiwalled carbon nanotube composite film. Artif Cells Blood Substit Immobil Biotechnol 38: 178-185.
- Rashmin BP, Mrunali RP (2008) An introduction to analytical method development for pharmaceutical formulations.
- Zhao C, Wan L, Wang Q, Liu S, Jiao K (2009) Highly sensitive and selective uric acid biosensor based on direct electron transfer of hemoglobin-encapsulated chitosan-modified glassy carbon electrode. Anal Sci 25: 1013-1017.
- Schrenkhammer P, Wolfbeis OS (2008) Fully reversible optical biosensors for uric acid using oxygen transduction. Biosens Bioelectron 24: 1000-1005.
- Abdullah J, Ahmad M, Heng LY, Karuppiah N, Sidek H (2006) Chitosan-based tyrosinase optical phenol biosensor employing hybrid nafion/sol-gel silicate for MBTH immobilization. Talanta 70: 527-532.
- Kawabata S, Nakaminami T, Ito S, Yoneyama H (1998) Preparation and properties of amperometric uric acid sensors. Sensor and Actuators B. Chem 52: 72-77.
- Yamaguchi T, Hasegawa K, Kamino S, Miyachi K, Tominaga H, et al. (2007) Spectrophotometric determination of uric acid based on fading of o-Hydroxyhydroquinonephthalein-palladium (II)-hexadecyltrimethyl ammonium complex. Anal Sci 23: 223-226.
Relevant Topics
Recommended Journals
Article Tools
Article Usage
- Total views: 29940
- [From(publication date):
specialissue-2013 - Nov 21, 2025] - Breakdown by view type
- HTML page views : 24015
- PDF downloads : 5925

