Conference Proceeding Open Access
Structural Elucidation of Small Organic Molecules by 1D, 2D and Multi Dimensional-Solution NMR Spectroscopy
Neeraj Kumar Fuloria* and Shivkanya Fuloria
Anuradha College of Pharmacy, Amravati University, Maharashtra, India
- *Corresponding Author:
- Dr. Neeraj Kumar Fuloria
M.Pharm (Pharmaceutical Chemistry)
Head, M.Pharm (Quality Assurance)
Anuradha College of Pharmacy
Chikhli, Buldhana, Maharashtra, India
Tel: 8805680423
E-mail: nfuloria@gmail.com, nfuloria@rediffmail.com
Received date: January 10, 2013; Accepted date: January 30, 2013; Published date: February 07, 2013
Citation: Fuloria NK, Fuloria S (2013) Structural Elucidation of Small Organic Molecules by 1D, 2D and Multi Dimensional-Solution NMR Spectroscopy. J Anal Bioanal Tech S11:001. doi: 10.4172/2155-9872.S11-001
Copyright: © 2013 de Francisco TMG, et al. This is an open-access article distributed under the terms of the Creative Commons Attribution License, which permits unrestricted use, distribution, and reproduction in any medium, provided the original author and source are credited.
Visit for more related articles at Journal of Analytical & Bioanalytical Techniques
Abstract
For the last fifty years nuclear magnetic resonance spectroscopy, generally referred as NMR, is one of the most versatile techniques for elucidation of structure of organic compounds. Among all available spectrometric methods, NMR is the only technique which offers a complete analysis and interpretation of the entire spectrum. Due to improved experimental technology and novel approaches, over the last decade nuclear magnetic resonance (NMR) has shown a tremendous progress. Generally, NMR spectroscopy makes use of three approaches; those are one dimension (1D), two dimensions (2D) and three dimensions (3D). Usually, the first approach of 1D-NMR (1H DEPT, 13C, 15N, 19F, 31P, etc.) generates good information about the structure of simple organic compounds, but in case of larger molecules the 1D-NMR spectra are generally overcrowded. Hence, the second approach of 2D-NMR (COSY, DQFCOSY, MQFCOSY, HETCOR, HSQC, HMQC, HMBC, TOCSY, NOESY, EXSY, etc.) is used for the further larger molecules, but 2D-NMR spectra also becomes complex and overlapping when used for further very large molecules like proteins. Hence, so as to achieve high resolution and reduced overlapping in spectra of very large molecules, Multi Dimensional-NMR (Homonuclear and Heteronuclear) are generally used. This paper supports interpretation of structure of different organic compounds by different NMR techniques.
Keywords
NMR; COSY; 1D; 2D; Multi dimensional
Introduction
NMR spectroscopy was discovered after the second world war and was developed from experiments performed to accurately measure the nuclear magnetogyric ratio about seventy years ago [1]. Purcell et al. at Harvard and Bloch et al. at Stanford in 1945 reported the first observation of nuclear magnetic resonance in bulk matter for which they were jointly awarded with Nobel Prize for physics in 1952. Since then NMR applications to chemistry have been expanding continuously. The importance of NMR spectroscopy is paramount in the fields of organic, inorganic and analytical chemistry for the investigation of molecular structure and dynamics [2]. In the recent years, the applications of NMR have been extended to biology and medicine, so they have also become an integral part of life sciences. As the objective of life sciences is to understand the mechanisms of life at molecular level, so, it has inspired the investigators to study the interaction between and among biomolecules, also between biomolecules and ligands through NMR spectroscopy. NMR facilitates three-dimensional (3D) structure determination of biomolecules in high resolution and also provides information on their dynamics at an atomic level. In last two decades the tremendous technological and methodological advancements in NMR spectroscopy has proved it to be a powerful tool in structural biology [3].
The technical advancement in NMR is attributed to availability of large magnetic field strengths and increasingly refined probes, which resulted in increased sensitivity, resolution, reduction in amount of sample for data collection and development of procedures for isotope labeling and structure determination of proteins. The investigation of size of biomolecules through NMR in solution is steadily growing method. NMR spectroscopy has contributed immensely to structural genomics initiatives world-wide, which aim at exploring the protein ‘fold space’ and making available at least one experimental structure for each family of protein sequence homologues [3]. NMR spectroscopy has been a tool of great importance in identification and characterization of organic [4], inorganic and organometallic [5] and natural products [6]. NMR spectrometry is an analytical technique that involves placement of atomic nuclei in an external magnetic field, to cause generation of two spin states of unequal energy. Low energy spin state nuclei absorb energy of radiofrequency range to change their spin orientation with respect to applied magnetic field. Thereby the absorption frequencies peaks are plotted against peak intensities to offer an NMR spectrum [7].
NMR is a powerful technique that provides detailed information on topology, dynamics and 3D structure of molecules, in MRI [7]. Nowadays, NMR probably is the most important technique for structure elucidation, material characterization and studying molecular motion. Continuing efforts have been made to develop different NMR methods so as to obtain more information from NMR measurements, a number of experiments such as 1D-NMR (1H DEPT, 13C, 15N, 19F, 31P, etc.), 2D-NMR (COSY, DQFCOSY, MQFCOSY, HETCOR, HSQC, HMQC, HMBC, TOCSY, NOESY, EXSY, etc.) and Multidimensional-NMR (Homonuclear and Heteronuclear) are developed [7-26]. This paper focuses mainly on interpretation of structure of different organic compounds by different NMR techniques. A few of the strategies of NMR experiments that are used in determination of different compounds are described as follows.
1D-NMR
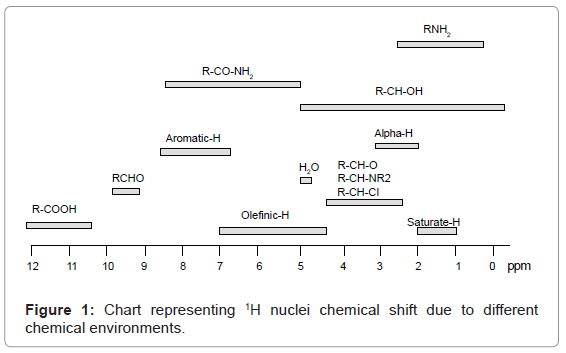
1H-NMR: In 1H-NMR spectroscopy, spin transitions of only hydrogen nuclei are noticed. Interpretation of 1H-NMR spectra can be well understood from data presented in table 1 representing different δ values, couplings, coupling constants and chemical shifts of 1H nuclei processing in different chemical environments. Commonly, δ value scale of 1H-NMR ranges from 0-10 ppm with respect to Tetra methyl Silane (TMS) as internal standard.
| Compound | Type ofHydrogen | d Valuein ppm | Coupling & J value |
|---|---|---|---|
| Alkanes | R-CH3 | 0.75-1.3 | 3J = 7-8 Hz |
| R-CH2-R | 1.2-1.5 | 3J = 7-8 Hz | |
| R3-CH | 1.5-2.0 | 3J = 7-8 Hz | |
| Alkenes | HC=C-H (trans) | 4.5-6.5 | 3J = 11-18 Hz |
| HC=C-H (Cis) | 4.5-6.5 | 3J = 6-15 Hz | |
| HC=C-C-H | 1.6-2.5 | 4J = 0-3 Hz | |
| HC=CH2 (gem) | 4.5-6.5 | 2J= 0-3 Hz | |
| Alkynes | C≡CH | 1.7-2.7 | - - |
| HC≡C-CH | 1.6-2.5 | 4J = 2-3 Hz | |
| Aromatic | Ortho'H' Coupling | 6-8 | 3J = 7-10 Hz |
| Meta 'H' Coupling | 6-8 | 4J = 2-3 Hz | |
| Para 'H' Coupling | 6-8 | 5J = 0-1 Hz | |
| Aldehydes | R-C(=O)-H | 9-10 | - - |
| αCH-C(=O)-H | 2-2.5 | 3J = 1-3 Hz | |
| Ketones | -C(=O)-CH | 2-2.5 | - - |
| Carboxylic acids | C(=O)-OH | 11-12 | - - |
| HOOC-CHα | 2-2.5 | - - | |
| Esters | -CO-O-CHα | 3.5-5 | - - |
| CHα-CO-O- | 2-2.5 | - - | |
| Amides | -CO-NH-CH | 2-3 | 3J = 0-7 Hz |
| CH-CO-N- | 2-2.5 | - - | |
| -CO-NH | 5-9 | 1J = 50 Hz | |
| Amines | -N-CH | 2-3 | - - |
| -C-NH | 0.5-5 | 1J = 50 Hz | |
| Ar-NH | 3-5 | 1J = 50 Hz | |
| Halogens | HC- I | 2.4 | - - |
| HC-Br | 2.7-4.1 | - - | |
| HC-Cl | 3-4.1 | - - | |
| HC-F | 4.2-5 | 2J = 50 Hz | |
| HC-C-F | 4.2-5 | 3J = 20 Hz |
Table 1: ∂ Values, couplings and coupling constants of different 1H nuclei10.
The chemical shift range of 1H nuclei can also be understood from a chart given in figure 1.
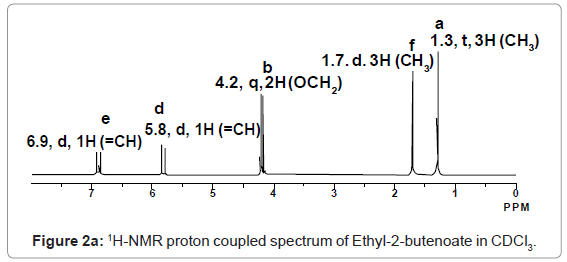
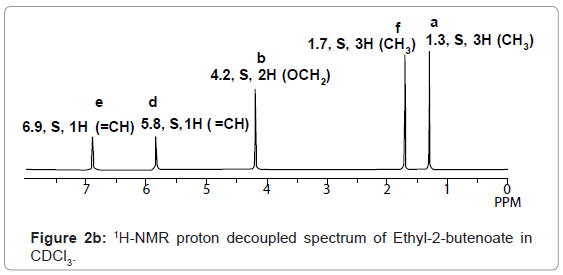
For example 1H-NMR spectrum of Ethyl-2-butenoate in CDCl3 given in figure 2a, represents five different signals at 1.3, 1.7, 4.2, 5.8, and 6.9 ppm respectively corresponding to a, f, b, d and e hydrogen’s respectively.
The multiplicity of peaks of 1H-NMR spectrum of Ethyl-2- butenoate in CDCl3 is confirmed by observing its decoupled peaks in 1H-NMR decoupled spectrum given in figure 2b. Similarly, 1H-NMR spectra of other compounds can be determined.
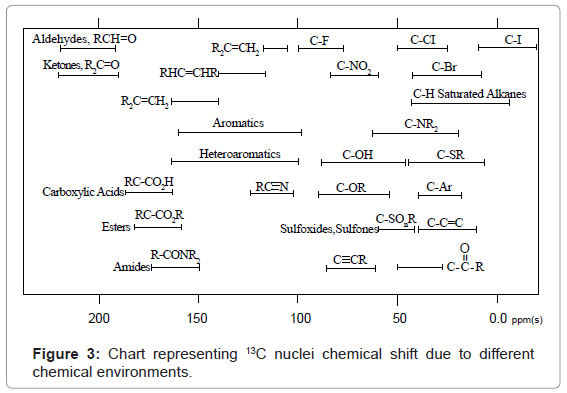
13C-NMR: In 13C-NMR spectroscopy also transitions of only 13C nuclei are noticed. 13C-NMR spectral interpretation can be best understood from chart given in figure 3, representing different δ values (in ppm), couplings, coupling constants (in Hz) and chemical shifts of 13C nuclei processing in different chemical environments. Usually, δ value scale of 13C-NMR ranges from 0-220 ppm with respect to TMS as internal standard.
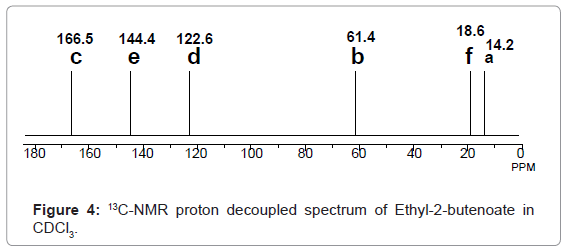
For example 13C-NMR spectrum of Ethyl-2-butenoate in CDCl3, given in figure 4, represents six different signals at 14.2, 18.6, 61.4, 122.6, and 144.4 and 166.5 ppm, corresponding to a, f, b, d, e and c carbons respectively.
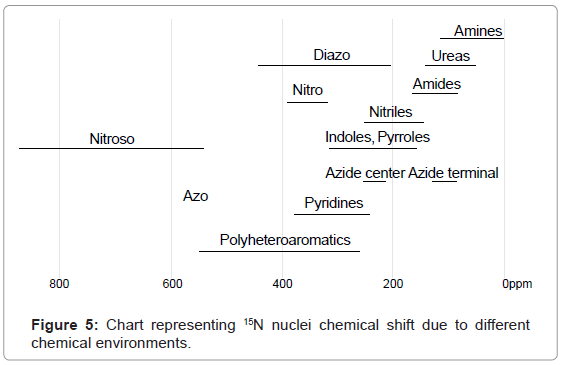
15N-NMR: In case of 15N-NMR spectroscopy transitions of 15N nuclei are noticed. 15N-NMR spectral interpretation can be best understood from chart given in figure 5, representing different δ values (in ppm), couplings, coupling constants (in Hz) and chemical shifts of 15N nuclei processing in different chemical environments. In practice, δ value scale of 15N-NMR ranges from 0-850 ppm using liquid ammonia as standard.
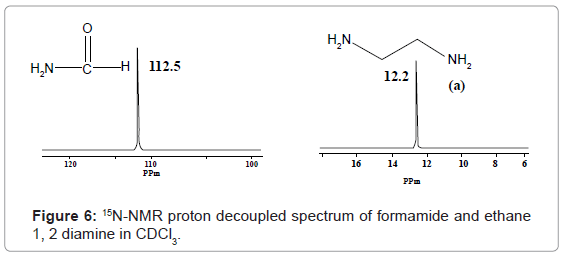
For example 15N-NMR spectrum of formamide in CDCl3 exhibits a signal for nitrogen nuclei at 112.5 ppm. Whereas ethane 1,2 diamine in CDCl3 exhibits signal for nitrogen nuclei at 12.2 ppm (Figure 6).
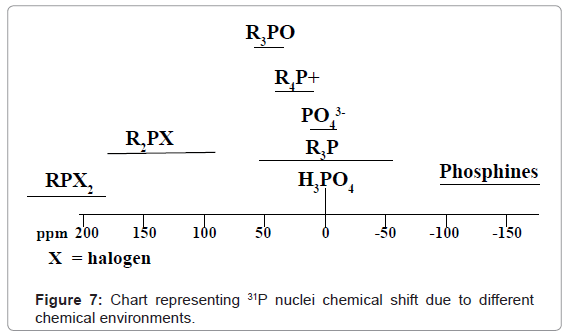
31P-NMR: In 31p-nmr spectroscopy only 31p nuclei are observed. 31P -nmr spectral interpretation can be best understood from chart given in figure 7, representing different δ values, couplings, coupling constants and chemical shifts of 31P nuclei processing in different chemical environments. Usually, δ value scale of 31P-nmr ranges from -140-250 ppm with respect to 85% phosphoric acid as internal standard.
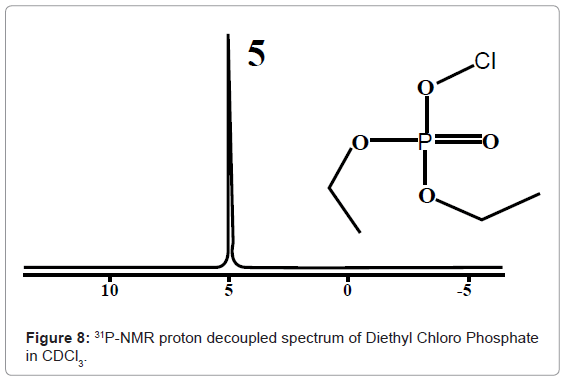
For example 31P-NMR spectrum of Diethyl Chloro Phosphate in CDCl3 given in figure 8, shows a signal at 5 for 31P nuclei.
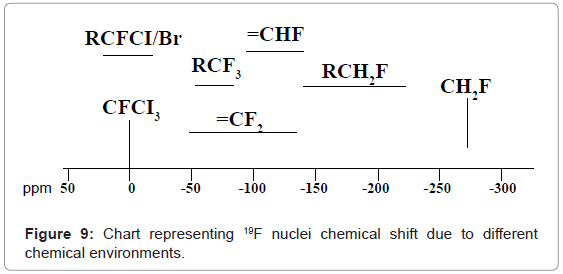
19F-NMR: In 19F-NMR spectroscopy also transitions of only 19F nuclei are noticed. 19F-NMR spectral interpretation can be best understood from chart given in figure 9, representing different δ values, couplings, coupling constants and chemical shifts of 19F nuclei processing in different chemical environments.
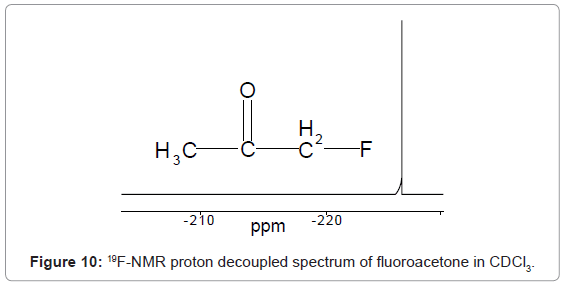
Usually, δ value scale of 19F-NMR ranges from -300-50 ppm with respect to CFCl3 (Tri Fluoro Methane) as standard. For example 19F-NMR spectrum of fluoroacetone in CDCl3 given in figure 10, shows a signal at -226 ppm for 19F nuclei.
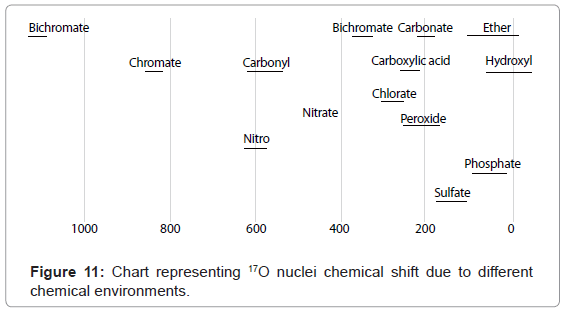
17O-NMR: In 17O-NMR spectroscopy involves transitions of only 17O nuclei. 17O-NMR spectral interpretation can be best understood from chart given in figure 11, representing different δ values, couplings, coupling constants and chemical shifts of 19F nuclei processing in different chemical environments. Commonly, δ value scale of 17O-NMR ranges from 0-1200 ppm using water or dioxane as internal standards.
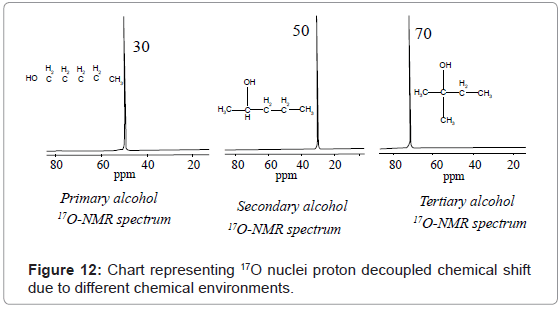
For example 17O-NMR spectrum of primary, secondary and tertiary alcohol given in figure 12, shows a signal at 30, 50 and 70 ppm for 17O nuclei.
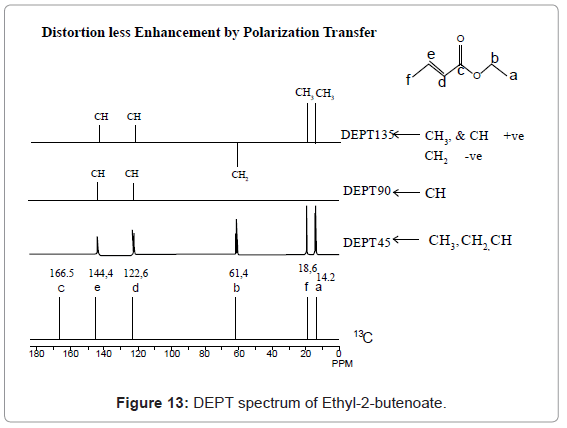
DEPT: DEPT is an advance technique to determine the number of hydrogens attached to a given carbon atom. DEPT employs introduction of a complex sequence of pulses in both 1H and 13C channel. In DEPT experiment pulses are selected on the basis of their flip angle such as (π/2)z with flip angle of 45°, (π/2)y with 90°, (π/2)x with 135° and also their delay time. In DEPT- 45 - carbon that possesses hydrogen (number 1 or 2 or 3) shows peak. Where as carbon that doesn’t possess hydrogens does not show any peak. In DEPT-90 -carbon that possesses only one hydrogen, exhibits peak in spectrum, whereas carbon with two or three hydrogen does not show any peak. In DEPT-135-carbon with one and three hydrogens shows positive peaks, whereas, carbon with two hydrogens shows negative peak. So, carbons with different number of hydrogens behave differently with different DEPT experiments. This variation indicates presence of number of hydrogen on each carbon. DEPT requires a Fourier transformed pulse spectrometer with a computer interface. The DEPT interpretation can be very well understood from DEPT spectrum of Ethyl-2-butenoate given in figure 13, which represents conventional spectrum at bottom. DEPT 45 exhibits shows coupled peaks for only those carbons that possess hydrogens, whereas nuclei like ‘c’ carbon does not exhibit any signal as it do not possess any hydrogen. The DEPT 90 exhibits peaks only for those carbon nuclei which possess only one hydrogen. The DEPT 135 spectrum shows two types of signals. One of the types is carbon having two hydrogens that exhibits signal downside. Another type is for carbon having one hydrogen or three hydrogens that exhibits signal upside [7-13].
2D NMR
COSY: COSY is a homonuclear 2D NMR correlation spectroscopy. COSY correlates chemical shift of two hydrogen nuclei located on two different carbons that are separated by a single bond via J coupling. Thereby detects the chemical shift for hydrogen’s on both F1 and F2 axis. COSY experiment is categorized as follows:
• Simple COSY
• DQF COSY
• TQF COSY
• MQF COSY
Simple COSY
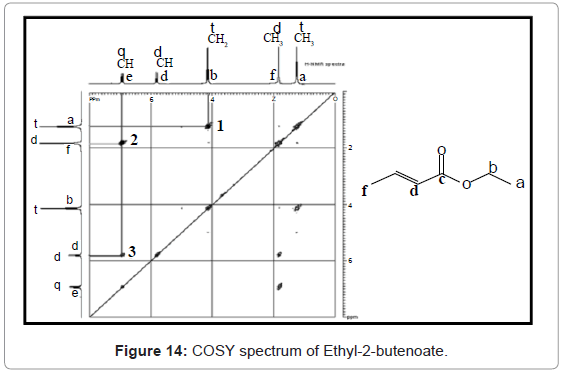
Simple COSY technique involves simple pulse sequence in which firstly a (π/2)x pulse is introduced in 1H channel to create an evolution phase. There after some time a second (π/2)y pulse is introduced to create an acquisition phase. In 1H-1H COSY pulse sequence contains variable relaxation delay time (t1) and acquisition time (t2). Experiment is repeated with different values of t1 and t2. So that value of t1 is increased at regular intervals, to generate a series of different FID data during t2. COSY offers three bond coupling (3JH-H). The COSY interpretation can be best understood from COSY spectrum of Ethyl-2-butenoate given in figure 14. The off diagonal peaks at point 1, 2, and 3 represents coupling of protons of hydrogens on ‘a’ with ‘b’, ‘e’ with ‘f ’, and ‘e’ with ‘d’ protons of molecule of Ethyl-2-butenoate. There is no cross peak for c because it does not possess any hydrogens.
DQFCOSY
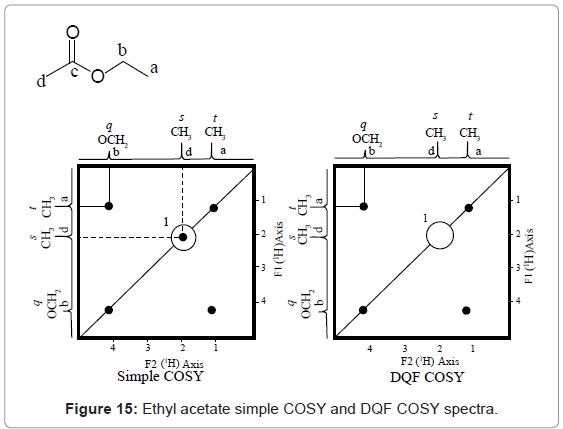
1H-1H DQF COSY is a modified technique of COSY that incorporates a typical pulse sequence, in which firstly a (π/2)x pulse is introduced in 1H channel. Nextly, after first pulse a second (π/2)y pulse with just immediate third (π/2)z pulse is introduced to eliminate singlet peaks. This simplifies the complex COSY spectrum. The DQF COSY interpretation can be best understood from Ethyl acetate (liquid) in CDCl3, simple COSY and DQF COSY spectra given in figure 15. In simple COSY spectrum of ethyl acetate the isolated ‘d’ hydrogen produces a singlet cross peak at spot ‘1’. But in case of 1H-1H DQF COSY spectrum of ethyl acetate spot ‘1’ is removed and the spectra is simplified.
TQF COSY
1H-1H TQF COSY employs further typical pulse sequence, in which initially a (π/2)x pulse is introduced in 1H channel. Which is followed by introduction of a second (π/2)y pulse along with just immediate third (π/2)z and fourth (π/2)z1 pulse. This eliminates singlet and doublet peaks.
MQF COSY
1H-1H MQF COSY employs a pulse sequence, in which firstly a (π/2)x pulse is introduced in 1H channel. This initial pulse is followed by introduction of a second (π/2)y pulse along with a just immediate multiple number of (π/2)zm pulse (as desired). This eliminates triplets or any unwanted multiple peaks and simplifies complex COSY spectrum.
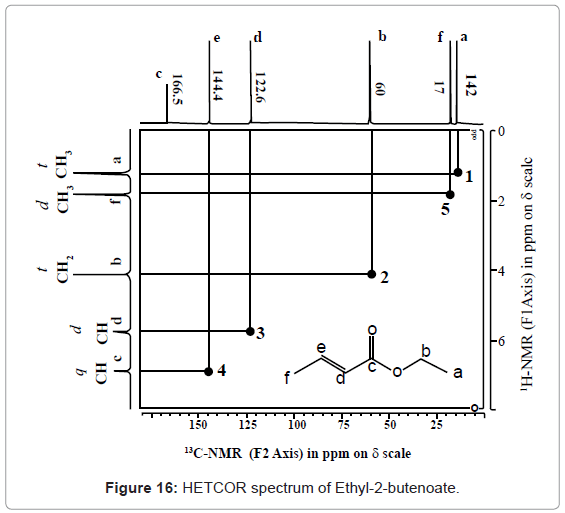
HETCOR: HETCOR is a heteronuclear 2D NMR correlation experiment, which correlates two nuclei e.g. 13C or 15N with hydrogens separated by single bond. This detects chemical shift for hydrogen’s on F1 axis and hetero nucleus on F2 axis. No cross peak signifies no hydrogen present over carbon. One cross peak indicates there can be one, two or three hydrogens. Two cross peaks indicates presence of diastereotype carbon (hydrogen). Interpretation of HETCOR spectra can be understood from HETCOR spectrum of ethyl-2-butenoate given in figure 16.
Peaks at point 1, 2, 3, 4 and 5 accounts for a, b, d, e and f carbons and attached hydrogens couplings. No cross peak for ‘c’ as does not contain any hydrogen so no coupling. Hence, with HETCOR, one can easily determine the single bonded hetero nuclear correlation.
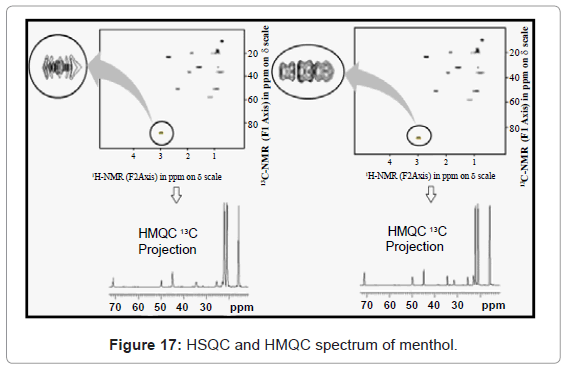
HMQC and HSQC: HSQC is better than HMQC. This can be best supported from HSQC and HMQC spectrum of menthol given in figure 17. So, when high 13C resolution is required, then pulses should be calibrated on a well tuned and matched probe and HSQC should be run. But when high 13C resolution is not an essential requirement then HMQC can be run.
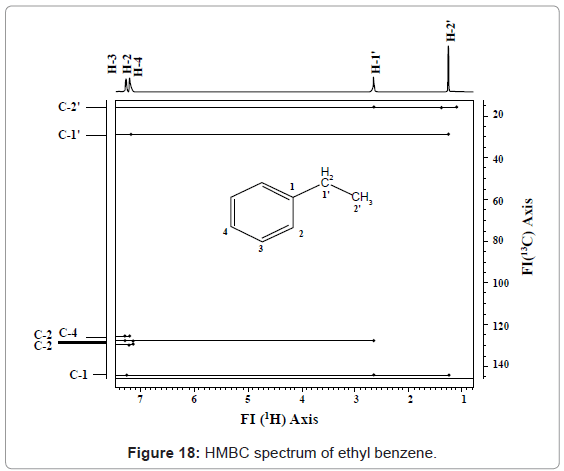
HMBC: HMBC is a heteronuclear 2D-NMR correlation spectroscopy. This technique correlates chemical shift of hetero nuclei e.g. 13C or 15N with hydrogens, through a multiple bond. So, detects chemical shift for hydrogen’s nuclei on F2 axis and hetero nuclei on F1 axis. Interpretation of HMBC can be understood from HMBC spectrum given in figure 18.
Line drawn from 16.2 (C-2’) ppm, parallel to 1H axis, intersects three cross peaks of H-1’, which correlates C-2’ with two H attached on C-1’. Other cross peaks doesn’t show correlation. The line drawn from C-1’ at 29 ppm, intersects one cross peak correlates C-1’ to hydrogens present on C-2’. Similarly, C-1 correlated with hydrogens of C-1’, C-2’ and C-3; C-2 with hydrogens of C-3, C-4, and C-of 1’; C-4 with hydrogens of C-3 and C-2; C-3 with hydrogens of C-2 and C-4; C-4 with hydrogens of C-3 and C-2.
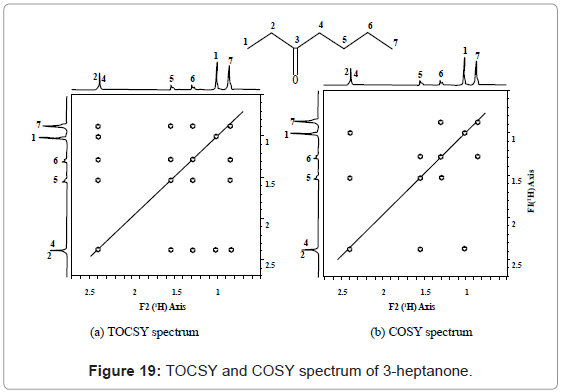
TOCSY: 2D TOCSY (Total Correlation Spectroscopy) is a homonuclear experiment which produces a COSY-like plot. TOCSY possesses two dimensions or axis of 1H-NMR. A 2D-TOCSY, gives correlations between all protons in a given spin system. Interpretation of TOCSY spectrum can be best learnt from the TOCSY and COSY spectrum of 3-heptanone given in figure 19. TOCSY and COSY spectrum of 3-heptanone can be easily distinguished on the basis of correlation, such as COSY correlations occurs among hydrogens 4-5, 5-6 and 6-7, but not between 4-7 and 5-7. TOCSY correlation occurs between hydrogens 4-7 and 5-7 also. Similarly, other correlations can also be easily distinguished between two spectra of TOCSY and COSY for any given compound.
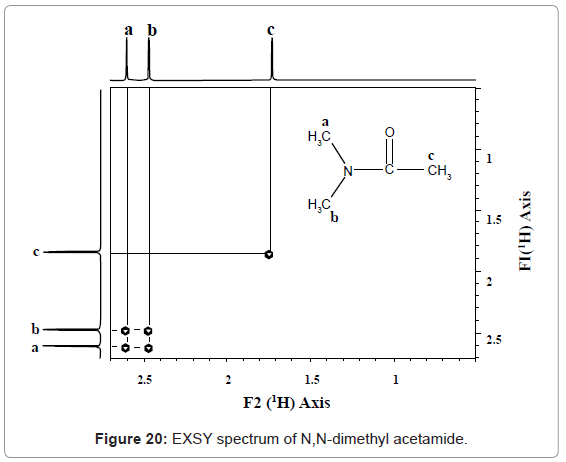
EXSY: This is a homonuclear correlation spectroscopy that correlates between nuclei which are physically close to each other regardless of whether there is a bond between them exists or not. Interpretation of EXSY spectrum can be understood from figure 20.
1H EXSY spectrum of N, N-dimethyl acetamide is recorded at room temperature. At this temperature, the molecule exhibits slow rotation about the (CH3)2N-C bond such that both methyl groups represented as ‘a’ and ‘b’ exchange with one another rotationally yet are distinct in the spectrum. This is evident by the cross peaks in the spectrum between the two methyl groups on the nitrogen.
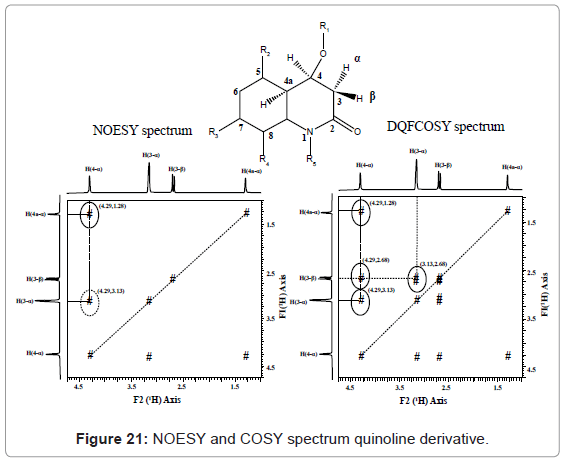
NOESY: NOESY is a homonuclear correlation spectroscopy that correlates between the nuclei which are physically close to each other regardless of whether there is a bond between them exists or not. The interpretation can be understood from NOESY and COSY spectrum of a quinoline derivative given in figure 21. The two experiments differentiates on the diastereotopic protons of the CH2 group. NOESY spectrum, shows two NOE correlations at (4.29, 1.28) and (4.29, 3.13) ppm. There are no NOE’s to the proton signal at 2.68 ppm. The DQFCOSY below shows 2J and 3J correlations at (4.29,3.13), (4.29,1.28) and (3.13, 2.68) ppm. There are no four-bond correlations present as the 4J coupling constants are close to zero. [7-14].
Multi dimensional NMR
As 1D-NMR spectroscopy possess one frequency axis with one intensity axis, which usually generates a very crowded and complex spectrum for larger molecules like proteins due to peak overlapping. Hence to overcome such problems of 1D NMR, a one more dimension is applied so called 2D NMR spectroscopy for assignment of peaks. If we see the case of 2D-NMR spectroscopy this possesses two frequency axes with one intensity axis and this also generates a very crowded and complex spectrum for larger molecules like proteins. Hence to further avoid and remove overlapping of peaks a third dimension is applied so called 3D NMR spectroscopy that possess three frequency axis and one intensity axis [15-21].
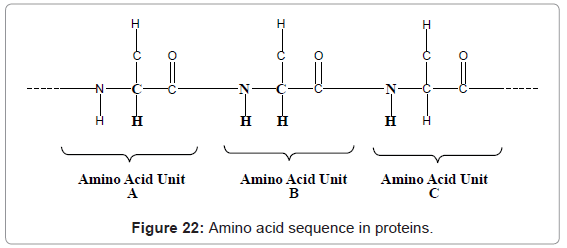
Introduction of third dimension provides much better resolution and reduces the overlapping of peaks. Similarly introduction of further higher number of frequency axis generates other multi dimensional NMR experiments such as 4D, 5D and 6D NMR. For example combination of 2D NOESY and 2D TOCSY offers a new 3D NMR i.e. NOESY-TOCSY spectroscopy. Protons of NH group of amino acid unit ‘B’ can be correlated with protons of NH group of amino acid unit ‘C’ and CHα of amino acid unit ‘A’ (figure 22). Other experiments like 2D HSQC-TOCSY, 2DNOESY-HSQC, 1H-15N ROESY-HMQC, 1H-13C ROESY-HMQC, 1H-15N HMQC-NOESY-HMQC can also be used. 5D NMR commonly makes use of four types of NMR pulse sequences such as sequence of HACA(N)CONH, HNCOCACB, (HACA)CON(CA) CONH and (H)NCO(NCA)CONH). Whereas for 6D NMR make use of a pulse sequences such as (H)NCO(N)CACONH. Usually, it takes several minutes to measure resonance in 2D NMR, several hours in 3DNMR, several days in 4DNMR, and several weeks in 5D and 6D NMR with conventional FTNMR methods. This is because of number of free inductions decays, that are number of data points sampled in the indirect dimensions, increases exponentially with increase in the number of dimensions. Such that to scan more than 15 complex points in each indirect dimension, when it takes one second per FID, then it takes about 30 minutes for 3DNMR, and 12 days for 5D NMR of measurement time. The time required for data collection is a rate limiting step for structural characterization or resonance measurements. In order to make the NMR measurements fast, following are the strategies that can be used such as [22-25]:
a. Ultrafast (single-scan) NMR Slice-selective excitation.
b. Non-linear sampling-Restricted time-domain sampling in the indirect dimension by omission of increments randomly or in a selective manner followed by spectral reconstruction.
i. Maximum Entropy Reconstruction
ii. Frequency Diagonalization Method
iii. Three-way decomposition (Multiway decomposition)
c. Time-shared approach (Simultaneous Data Acquisition) -Parallel execution of two or more magnetization transfer pathways in the RF pulse sequence.
d. Projection NMR spectroscopy-Phase sensitive or non-phase sensitive joint sampling of two or more chemical shifts in the indirect dimension(s).
i. RD-NMR (Relaxation Dispersion NMR)
ii. GFT NMR (G-Matrix Fourier Transform)
iii. GFT-based data collection followed by spectral re-construction
e. Hadamard NMR spectroscopy- elective excitation and encoding of phases of signals using Hadamard matrix.
f. Fast pulsing methods-Reduction of relaxation delay period between scans.
i. L-optimization
ii. SO-FAST NMR (Selective Optimized Flip-Angle Short-Transient NMR)
iii. Variable relaxation delay
g. DNP-Dynamic nuclear polarization [26].
A drawback of NMR is the low sensitivity attributed to small magnetic moment of the nuclei (1H, 13C, 15N etc.) having small polarization and small signal intensity. So, requires extensive signal averaging to have a high signal-to-noise ratio. Whereas at same magnetic field and temperature, the polarization of electron spin reservoir (e.g. free, stable paramagnetic polarizing agent) is significantly larger due to the much higher magnetic moment of the electron spin. With Dynamic Nuclear Polarization (DNP) it is possible to transfer the large Boltzman polarization of electron spin reservoir to the nuclear spin reservoir, which causes enhancement in NMR signal intensities by several orders of magnitude; ultimately signal intensity and data acquisition rate are increased by DNPNMR.
Conclusion
None of the analytical technique is good or bad. All the other analytical techniques of NMR play an equally important role in the structural elucidation individually or in combination.
References
- Gerothanassis IP, Troganis A, Exarchou V, Barbarossou K (2002) Nuclear magnetic resonance (NMR) spectroscopy: basic principles and phenomena, and their applications to chemistry, biology and medicine. Chem Educ Res Pract 3: 229-252.
- Shaoxiong W (2011) 1D and 2D NMR experiment methods. NMR Research Centre, Emory University, Etlanta, GA.
- Atreya HS (2010) NMR methods for fast data acquisition. J Ind Inst Sci 90: 87-104.
- Simpson J(2011) Organic structure determination using 2D-NMR spectroscopy. (2ndedn), Elsevier, Academic Press, USA.
- Pregosin PS (2008) Applications of NMR to inorganic and Organometallic chemistry. Volumes 221-222, Elsevier.
- BretonRC,Reynolds WF (2013) Using NMR to identify and characterize natural products. Nat Prod Rep.
- Fuloria NK, Fuloria S (2013) Spectroscopy: fundamentals and data interpretation. (1stedn), Studium Press, India.
- PaviaDL (2009) Introduction to spectroscopy. Cengage Learning, U.S.A.
- Kalsi PS (2007) Spectroscopy of organic compounds. (6thedn), New Age International, New Delhi, India.
- Silverstein RM, Webster FX, Kiemle DJ (2005) Spectrometric identification of organic compounds. (7thedn), John Wiley & Sons.
- Berger S,Braun S (2004) 200 and More NMR experiment- a practical course. Wiley-VCH.
- Lambert JB,Rittner R (1987) Recent advances in organic NMR spectroscopy. Norell Press, Landisville, NJ.
- Gottlieb HE, Kotlyar V, Nudelman A (1997) NMR chemical shifts of common laboratory solvents as trace impurities.J Org Chem62: 7512-7515.
- Ernst RR, Bodenhausen G, Wokaun A (1987) Principles of nuclear magnetic resonance in one and two dimensions. J Nucl Med 29: 579.
- Zawadzka-Kazimierczuk A, Kozminski W, Sanderová H, Krásný L (2012) High dimensional and high resolution pulse sequences for backbone resonance assignment of intrinsically disordered proteins. J Biomol NMR 52: 329-337.
- Clore GM, Gronenborn AM (1991) Applications of three- and four-dimensional heteronuclear NMR spectroscopy to protein structure determination. Progress in NMR Spectroscopy 23: 43-92.
- Cavanagh J, Fairbrother WJ, Palmer AG, Rance M, Skelton NJ (1996) Protein NMR spectroscopy. Academic Press, San Diego.
- Montelione GT, Zheng D, Huang YJ, Gunsalus KC, Szyperski T (2000) Protein NMR spectroscopy in structural genomics. Nat Struct Biol 7: 982-985.
- Lian L, Roberts G (eds.) (2011) Protein NMR spectroscopy: principal techniques and applications. ChemBiochem 13: 904-905.
- Sarkar SK (ed.) (1996) NMR Spectroscopy and its application to biomedical research. Elsevier, Amsterdam, The Netherlands.
- Yee A, Gutmanas A, Arrowsmith CH (2006) Solution NMR in structural genomics. Curr Opin Struct Biol 16: 611-617.
- Atreya HS, Szyperski T (2005) Rapid NMR data collection. Methods Enzymol 394: 78-108.
- Schanda P (2009) Fast-pulsing longitudinal relaxation optimized techniques: enriching the toolbox of fast biomolecular NMR spectroscopy. Prog Nucl Magn Reson Spectrosc 55: 238-265.
- Felli IC, Brutscher B (2009) Recent advances in solution NMR: fast methods and heteronuclear direct detection. Chemphyschem 10: 1356-1368.
- Freeman R, Kupce E (2003) New methods for fast multidimensional NMR. J Biomol NMR 27: 101-113.
- Abragam A, Goldman M (1976) Principles of dynamic nuclear polarisation.Rep Prog Phys41: 395-467.
Relevant Topics
Recommended Journals
Article Tools
Article Usage
- Total views: 40377
- [From(publication date):
November-2013 - Oct 08, 2025] - Breakdown by view type
- HTML page views : 33968
- PDF downloads : 6409

