Research Article Open Access
A Global Assessment of Gold, Titanium, Strontium and Barium Pollution Using Sperm Whales (Physeter Macrocephalus) As an Indicator Species
John Pierce Wise. Sr.1,2,3,4*, W. Douglas Thompson2,3, Sandra S. Wise1,2,3,4, Carolyne LaCerte1,2,3,4, James Wise1,2,4, Christy Gianios Jr.1,2,3,4, Christopher Perkins5, Tongzhang Zheng2,6, Lucille Benedict2,7, Michael D. Mason2,8, Roger Payne2,4 and Iain Kerr2,4
1Wise Laboratory of Environmental and Genetic Toxicology
2Maine Center for Toxicology and Environmental Health,
3Department of Applied Medical Sciences, University of Southern Maine, Portland, ME. 04104
4Ocean Alliance, 191 Weston Rd., Lincoln, MA 01773
5Center for Environmental Sciences and Engineering, University of Connecticut, Storrs, CT
6Division of Environmental Health Sciences, Department of Epidemiology and Public Health, Yale University School of Medicine, New Haven, CT
7Department of Chemistry, University of Southern Maine, Portland, ME. 04104
8Institute for Molecular Biophysics, Department of Chemical and Biological Engineering, University of Maine, Orono, Maine 04469
- *Corresponding Author:
- Dr. John Pierce Wise
Sr. 96 Falmouth St. PO Box 9300
Portland, ME 04104-9300
Tel: (207) 228-8050
Fax: (207) 228-8518
E-mail: John.Wise@maine.edu
Received March 25, 2011; Accepted April 07, 2011; Published April 11, 2011
Citation:Wise JP, Thompson WD, Wise SS, LaCerte C, Wise J, et al. (2011) A Global Assessment of Gold, Titanium, Strontium and Barium Pollution Using Sperm Whales (Physeter Macrocephalus) As an Indicator Species. J Ecosys Ecograph 1:101. doi:10.4172/2157-7625.1000101
Copyright: © 2011 Wise JP, et al. This is an open-access article distributed under the terms of the Creative Commons Attribution License, which permits unrestricted use, distribution, and reproduction in any medium, provided the original author and source are credited.
Visit for more related articles at Journal of Ecosystem & Ecography
Abstract
This study provides a global baseline for barium, gold, titanium and strontium as marine pollutants using the sperm whale (Physeter macrocephalus) as an indicator species. Barium, gold, titanium and strontium are metals that are little studied in marine environments. However, their recent emergence as nanomaterials will likely increase their presence in the marine environment. Moreover, nanosized particles are likely to exhibit toxic outcomes not seen in macrosized particles. Biopsies from free ranging sperm whales were collected from around the globe. Total barium levels were measured in 275 of 298 sperm whales tested for barium and collected from 16 regions around the globe. The global mean for barium was 0.93 +/- 0.2ug/g with a detectable range from 0.1 to 27.9ug. Total strontium levels were measurable in all 298 sperm whales producing a global mean level of 2.2 +/- 0.1ug/g and a range from 0.2 to 11.5ug/g. Total titanium levels were also measured in all 298 sperm whales producing a global mean level of 4.5 +/- 0.25ug/g with a range from 0.1 to 29.8ug/g. Total gold levels were detected in 50 of the 194 sperm whales collected from 16 regions around the globe. Detectable levels ranged from 0.1 to 2.3ug/g tissue with a global mean level equal to 0.2 +/- 0.02ug/g. Previous reports of these metals were much lower than the mean levels reported here. The likely explanation is location differences and consistent with this explanation, we found statistically significant variation among regions. These data provide an important global baseline for barium, gold, titanium and strontium pollution and will allow for important comparisons to be made over time to assess the impact of nanomaterials on whales and the marine environment.
Keywords
Gold; Titanium; Strontium; Barium; Sperm whales; Pollutants; Atlantic ocean; Indian ocean; Pacific ocean; Biopsy sampling
Introduction
Barium, gold, titanium and strontium are metals that are infrequently studied in marine environments, in part because their toxicity is generally considered to be low. However, recent advances in nanoscience have discovered that these materials behave differently on the nanoscale. For example, large bulk metallic gold particles were considered to be almost completely inert, and as such historically not been investigated for commercial uses as a chemical reactant. However, gold nanoparticles can behave as strong catalysts for a broad range of commercially and industrially viable chemistries [1,2]. Consequently, a whole new industry is emerging for gold nanoparticles with vastly significant new products and markets.
Nanoparticles are defined as having at least one dimension with a size less than 100nm. They exist in the quantum scale, which means that they don't follow the known laws of solids, liquids or gases [3]. Instead, their properties are defined by quantum mechanics, which gives them their commercial value. However, the same properties that make these particles exciting in technology and consumer markets will also alter their toxicity. For example, historically, larger size gold materials have been used because it is very inert, and thus potentially safe for biomedical use (e.g. gold fillings). However, at the nanosize level, gold changes from being very nearly inert to having significant cytotoxicity [4]. Thus, nano sized metals have the potential to significantly affect the health of the marine environment.
Nanoparticles are now extensively used in consumer products and it is only a matter of time before they reach the marine environment with uncertain consequences. For example, gold nanomaterials have very real and significant potential for catalytic conversion (pollution control), low-temperature chemical conversion (used to make industrial chemicals cheaply) of wide variety and in biomedical imaging [1,2]. These sectors will require substantial amounts of gold nanomaterials on a scale of kilograms for each reactor and grams for every catalytic converter in every new car [5]. Similarly, titanium nanoparticles are now used in sunscreens and household cleaning materials [6]. Barium, strontium and titanium are showing promise in the cell phone and computer industries as high dielectric materials that are required for dynamic random access memory [7]. Thus, it is likely as use increases in these materials they will reach the marine environment, but currently there are very few baseline data to show the impact this industry might have on the oceans. Such a baseline would be useful in the coming years to be able to assess the potential impact of gold, titanium, strontium and barium nanomaterials in the marine environment.
Between 2000 and 2005, the research vessel Odyssey collected biopsies from Pacific, Indian, and Atlantic Ocean and Mediterranean Sea sperm whales. Sperm whales have a global distribution and feed high on oceanic food chains. Because these samples were collected prior to extensive use of nanotechnology in consumer products, these biopsies provide a rare opportunity to establish a global baseline prior to the introduction of this new class of chemicals. Accordingly, we assessed gold, titanium, strontium and barium in this sample collection and established a global baseline for these understudied metals.
Materials and Methods
We measured titanium, strontium and barium levels in 298 sperm whales collected from 16 regions around the globe. We considered 193 adult females and 105 male sperm whales (51 adult and 54 subadult males). Table 1 shows the distribution of these whales by region. Gold was added to the study later and, consequently, levels were measured in 194 sperm whales collected from 16 regions around the globe. For Au, we considered 90 adult females and 104 male sperm whales (50 adult and 54 subadult males). Table 2 shows the distribution of these whales by region.
| Female | Male | Total Number | |||
|---|---|---|---|---|---|
| Ocean/Sea | Region | Adult | Adult | Subadult | All |
| Pacific | Sea of Cortez | 13 | 12 | 0 | 25 |
| Galapagos | 0 | 2 | 5 | 7 | |
| Pacific Crossing | 16 | 6 | 0 | 22 | |
| Kiribati | 1 | 0 | 0 | 1 | |
| Papua New Guinea | 13 | 5 | 5 | 23 | |
| Indian | Australia | 8 | 0 | 8 | 16 |
| Cocos | 18 | 0 | 0 | 18 | |
| Indian Ocean Crossing | 0 | 4 | 0 | 4 | |
| Chagos | 0 | 0 | 12 | 12 | |
| Seychelles | 25 | 5 | 6 | 36 | |
| Maldives | 26 | 4 | 5 | 35 | |
| Sri Lanka | 23 | 1 | 0 | 24 | |
| Mauritius | 26 | 2 | 1 | 29 | |
| Mediterranean | Mediterranean | 7 | 8 | 8 | 23 |
| Atlantic | Canaries | 17 | 2 | 4 | 23 |
Table 1: Distribution of the sperm whales sampled across study regions for barium, strontium and titanium.
| Female | Male | Total Number | |||
|---|---|---|---|---|---|
| Ocean/Sea | Region | Adult | Adult | Subadult | All |
| Pacific | Sea of Cortez | 2 | 11 | 0 | 13 |
| Galapagos | 0 | 1 | 5 | 6 | |
| Pacific Crossing | 11 | 6 | 0 | 17 | |
| Kiribati | 0 | 0 | 0 | 0 | |
| Papua New Guinea | 2 | 5 | 5 | 12 | |
| Indian | Australia | 0 | 0 | 8 | 8 |
| Cocos | 8 | 0 | 0 | 8 | |
| Indian Ocean Crossing | 0 | 4 | 0 | 4 | |
| Chagos | 0 | 0 | 12 | 12 | |
| Seychelles | 15 | 6 | 6 | 27 | |
| Maldives | 16 | 4 | 5 | 25 | |
| Sri Lanka | 13 | 1 | 0 | 14 | |
| Mauritius | 16 | 2 | 1 | 19 | |
| Mediterranean | Mediterranean | 0 | 8 | 8 | 16 |
| Atlantic | Canaries | 7 | 2 | 4 | 13 |
Table 2: Distribution of the sperm whales sampled across study regions for gold.
Whales were not evenly distributed by region as only female whales were found in the waters around Kiribati and the Cocos islands. Similarly, only male whales were found in waters around the Chagos archipelago, the Galapagos Islands and during the Indian Ocean crossing. All other regions had a mix of males and females at the times the Odyssey was present and collecting samples.
Biopsies
During the voyage of the research vessel Odyssey biopsies were collected from free ranging sperm whales using standard methods [8]. Sampling was carried out simultaneously with photo-identifications of individual whales to minimize duplication. The behaviors of all whales sampled appeared to be healthy. Samples were taken from the whale's flank, a location that has been shown to elicit the fewest reactions [8]. We used a 50mm stainless steel cylindrical biopsy dart. Samples were removed from the biopsy dart and divided into two pieces at the interface between skin and blubber. These two pieces were stored separately for later genetic and metal analysis. All tissue samples were frozen at -20ºC within a few minutes of collection. The samples were also shipped frozen to the University of Southern Maine.
Genotyping
Gender was determined by genotyping based on published methods [9]. DNA was extracted from a piece of whale skin using standard methods [10]. Gender was determined by PCR amplification reactions in which the SRY (male determining factor) gene was amplified according to published methods [9]. The keratin gene was used as an amplification control for all samples. Male samples showed both the keratin band (~311bp) and SRY (male) band at ~152bp. Female samples showed only the keratin band at ~311bp. Primer sequences were the following:
SryPMF: 5’CATTGTGTGTGGTCTCGTGATC
Sry PMR: 5’AGTCTCTGTGCCTCCTCGAA
KF: 5’AGATCAGGGGTTCATGTTTCTTTGC
KR: 5’TTTACAGAGGTACCCAAGCCTAAG
Inductively coupled plasma mass spectroscopy
Whale skin samples were analyzed for total titanium (Ti), total strontium (Sr), total barium (Ba) and total gold (Au) using inductively coupled plasma mass spectrometry (ICPMS) according to our published methods using a Perkin Elmer/ Sciex ELAN ICPMS [11]. Interference check solutions were analyzed with all sample runs to compensate for any matrix effects which might be interfering with sample analysis. Standard quality assurance procedures were employed (Table 3). Instrument response was evaluated initially, after every 10 samples, as well as at the end of each analytical run using a calibration verification standard and blank. All data are presented asug total Ti/g tissue wet weight, total Sr/g tissue wet weight, total Ba/g tissue wet weight or total Au/g tissue wet weight.
| Element | LODa (ppm) | Blank (ppm) | Duplicate (RPD) (%) | LCS Recovery (%) | Spike Recovery (%) | SRMb Recovery (%) DORM-2 |
|---|---|---|---|---|---|---|
| Ba | 0.08 | BDLc | * | 97.1 | 99.5 | N/Ad |
| Sr | 0.08 | BDLc | 12.7 | 98.6 | 101.3 | N/A |
| Ti | 0.16 | BDLc | 6.0 | 107.2 | 105.9 | N/A |
| Au | 0.17 | BDLc | 7.0 | 80.4 | 86.8 | N/A |
aLOD= Limit of detection; bSRM= Standard reference material; cBDL= Below detection limit; dthere is no standard reference material value, either certified or guidance for each of these four elements.
Table 3: Mean quality assurance and quality control data for Ba, Sr, Ti and Au analysis.
Statistics
Mean values were compared using analysis of variance. Differences for individual pairs of means were assessed via t-tests, with the Bonferroni correction for multiple comparisons. When a metal was not detected in a specimen, a value of one-half the detection limit was used in the analysis. Statistical testing was performed on log-transformed data due to the skew of the distributions of the untransformed data. The statistical analyses were all conducted in SAS [12].
Results
Barium level comparisons by region
Barium was present in 275 of the 298 sperm whales measured (Table 4). Detectable levels ranged from 0.1 to 27.9ug Ba/g tissue with a global mean level equal to 0.93 +/- 0.2ug/g. Considering each region, the highest mean barium levels were found in whales sampled in the waters near the Maldives in the Indian Ocean (1.64 +/- 0.81ug/g). The lowest mean levels were seen in whales off of the coast of the Canary Islands in the Atlantic Ocean (0.20 +/- 0.02ug/g). The variation among regions was statistically significant (F(14,283) = 2.41; p = 0.003). Pairwise t-tests showing regions that differed (p<0.05) include: the Canary Island compared to Papua New Guinea or the Sea of Cortez; and Mauritius compared to the Sea of Cortez.
| Region2 | N3 | Minimum4 | Maximum | Mean | Standard Error |
|---|---|---|---|---|---|
| Sea of Cortez | 25 (23) | 0.1 | 12.2 | 1.6 | 0.5 |
| Galapagos | 7 (6) | 0.2 | 6.2 | 1.2 | 0.8 |
| Pacific Crossing | 22 (20) | 0.1 | 4.2 | 0.7 | 0.2 |
| Kiribati | 1 (1) | 0.6 | 0.6 | 0.6 | - |
| Papua New Guinea | 23 (21) | 0.1 | 13.6 | 1.5 | 0.6 |
| Australia | 16 (15) | 0.1 | 2.0 | 0.6 | 0.1 |
| Cocos | 18 (17) | 0.1 | 2.4 | 0.7 | 0.1 |
| Indian Ocean Crossing | 4 (4) | 0.2 | 0.6 | 0.4 | 0.1 |
| Chagos | 12 (12) | 0.1 | 3.4 | 0.9 | 0.3 |
| Seychelles | 36 (36) | 0.1 | 2.3 | 0.5 | 0.1 |
| Maldives | 35 (31) | 0.1 | 26.8 | 1.6 | 0.8 |
| Sri Lanka | 24 (22) | 0.1 | 7.0 | 0.7 | 0.5 |
| Mauritius | 29 (26) | 0.1 | 27.9 | 1.2 | 1.0 |
| Mediterranean | 23 (18) | 0.1 | 2.3 | 0.5 | 0.1 |
| Canary Islands | 23 (23) | 0.1 | 0.4 | 0.2 | 0.0 |
1193 adult female sperm whales and 105 male sperm whales were sampled; 2Specific regions are named for the nearest land body or ocean region; 3Whales with detectable levels in parentheses; 4All data are presented in ug total Ba/g tissue wet weight. Regions that differ: Canary Islands with Papua New Guinea and Sea of Cortez; and Mauritius with Sea of Cortez.
Table 4: Global Distribution of Barium Levels in Sperm Whales.1
| Region2 | N3 | Minimum4 | Maximum | Mean | Standard Error |
|---|---|---|---|---|---|
| Sea of Cortez | 25 | 1.1 | 8.8 | 3.4 | 0.3 |
| Galapagos | 7 | 1.1 | 11.5 | 3.8 | 1.4 |
| Pacific Crossing | 22 | 0.8 | 8.9 | 2.7 | 0.4 |
| Kiribati | 1 | 2.2 | 2.2 | 2.2 | - |
| Papua New Guinea | 23 | 0.6 | 7.8 | 1.9 | 0.3 |
| Australia | 16 | 0.7 | 6.6 | 2.5 | 0.5 |
| Cocos | 18 | 0.2 | 3.6 | 1.6 | 0.2 |
| Indian Ocean Crossing | 4 | 1.0 | 1.7 | 1.3 | 0.1 |
| Chagos | 12 | 0.7 | 3.4 | 1.5 | 0.2 |
| Seychelles | 36 | 0.7 | 9.1 | 3.1 | 0.4 |
| Maldives | 35 | 0.8 | 7.7 | 2.5 | 0.3 |
| Sri Lanka | 24 | 0.6 | 3.7 | 1.3 | 0.2 |
| Mauritius | 29 | 0.5 | 4.2 | 1.5 | 0.2 |
| Mediterranean | 23 | 0.5 | 9.2 | 2.1 | 0.4 |
| Canary Islands | 23 | 0.5 | 2.0 | 1.1 | 0.1 |
1193 adult female sperm whales and 105 male sperm whales were sampled, 2Specific regions are named for the nearest land body or ocean region; 3All whales had detectable levels; 4All data are presented in ug total Sr/g tissue wet weight. Regions that differ: Sea of Cortez with Chagos, Cocos, Mauritius, Mediterranean, Papua New Guinea, Canary Islands and Sri Lanka; Canary Islands with Galapagos, Maldives, Pacific Crossing, Sea of Cortez and Seychelles; and Seychelles with Sri Lanka, Sea of Cortez and Canary Islands.
Table 5: Global Distribution of Strontium Levels in Sperm Whales.1
Barium level comparisons by gender
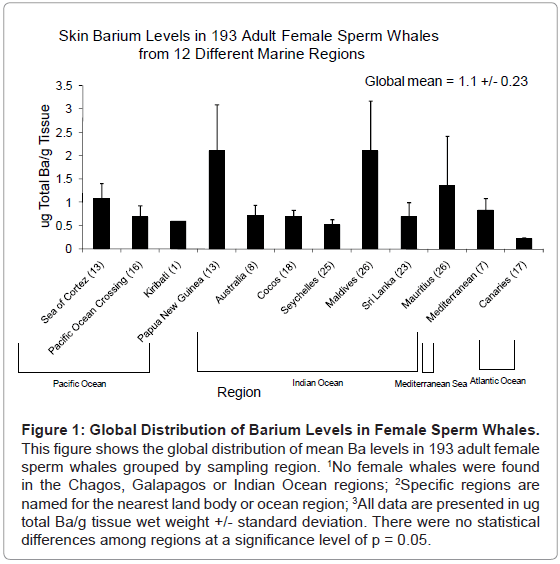
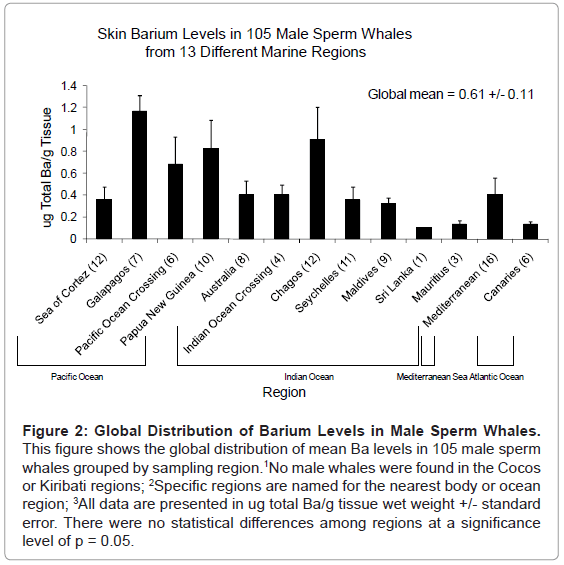
We also considered the whale barium levels by gender (Figures 1 and 2). Measurable levels in female whales with detectable levels of barium ranged from 0.1-27.9ug/g (15 female whales had undetectable levels of barium). The global mean for all female whales was 1.1 ± 0.23ug/g. 97 male whales had detectable levels (8 nondetects) with a range of 0.1-6.2ug/g and a global mean of 0.6 ± 0.1ug/g. Overall, the mean level for males was significantly lower than in females (F(1, 282) = 7.67; p = 0.006). We found no conclusive evidence that increased size and age gave higher contaminant burdens, in fact, the mean levels for the much larger and older adult males (0.6 +/- 0.1) was very similar compared to levels in subadult males (0.6 +/- 0.1) (F(1,103) = 0.02, p = 0.90).
Figure 1: Global Distribution of Barium Levels in Female Sperm Whales. This figure shows the global distribution of mean Ba levels in 193 adult female sperm whales grouped by sampling region. 1No female whales were found in the Chagos, Galapagos or Indian Ocean regions; 2Specific regions are named for the nearest land body or ocean region; 3All data are presented in ug total Ba/g tissue wet weight +/- standard deviation. There were no statistical differences among regions at a significance level of p = 0.05.
Figure 2: Global Distribution of Barium Levels in Male Sperm Whales. This figure shows the global distribution of mean Ba levels in 105 male sperm whales grouped by sampling region. 1No male whales were found in the Cocos or Kiribati regions; 2Specific regions are named for the nearest body or ocean region; 3All data are presented in ug total Ba/g tissue wet weight +/- standard error. There were no statistical differences among regions at a significance level of p = 0.05.
Considering region by gender, the highest mean barium levels for females were found in whales sampled in the waters near Papua New Guinea (range of 0.1-13.6, mean = 2.1 +/- 1.0ug/g) and the Maldives (range of 0.1-26.8, mean = 2.1 +/- 1.1ug/g). The lowest mean levels were seen in whales near the Canary Islands (range of 0.1-0.4, mean = 0.22 +/- 0.3ug/g). The variation among regions was statistically significant (F(11,181) = 2.09; p = 0.02). Pair-wise t-tests, however, could not identify specific regions that differ for females at a significance level of p < 0.05 based on the Bonferroni criterion.
The highest mean barium levels in male sperm whales were found in whales sampled in the waters near the Galapagos (range of 0.2-6.2; mean = 1.16 +/- 0.8ug/g). The lowest mean levels were seen in whales near Sri Lanka (mean = 0.1ug/g based on 1 whale). The lowest mean levels based on a group of whales were seen in whales near the Canary Islands (range of 0.1-0.2, mean = 0.13 +/- 0.02ug/g) and around Mauritius (range of 0.1-0.2, mean = 0.133 +/- 0.033ug/g). There was no statistical differences among samples from male whales that were collected from the different regions (F(12,92) = 1.87; p = 0.05). There was no statistically significant variation across regions among either adult (F(10,40) = 1.23; p = 0.30) or subadult males (F(8,45) = 1.48; p = 0.19).
Strontium level comparisons by region
Strontium was present in all 298 sperm whales measured (Table 4). Detectable levels ranged from 0.2 to 11.5ug Sr/g tissue with a global mean level equal to 2.2 +/- 0.1ug/g. Considering each region, the highest mean strontium levels were found in whales sampled in the waters near the Galapagos in the Pacific Ocean (range of 1.1-11.5, mean = 3.82 +/- 1.40ug/g). The lowest mean levels were seen in whales off of the coast of the Canary Islands in the Atlantic Ocean (1.15 +/- 0.08ug/g). The variation among regions was statistically significant (F(14,283) = 6.07; p < 0.0001). Pair-wise t-tests showing regions that differed (p < 0.05) include: The Sea of Cortez compared to Chagos, Cocos, Mauritius, the Mediterranean, Papua New Guinea, the Canary Islands and Sri Lanka; the Canary Islands compared to Galapagos, Maldives, Pacific Crossing, the Sea of Cortez and the Seychelles; and the Seychelles compared to Sri Lanka, Sea of Cortez and the Canary Islands.
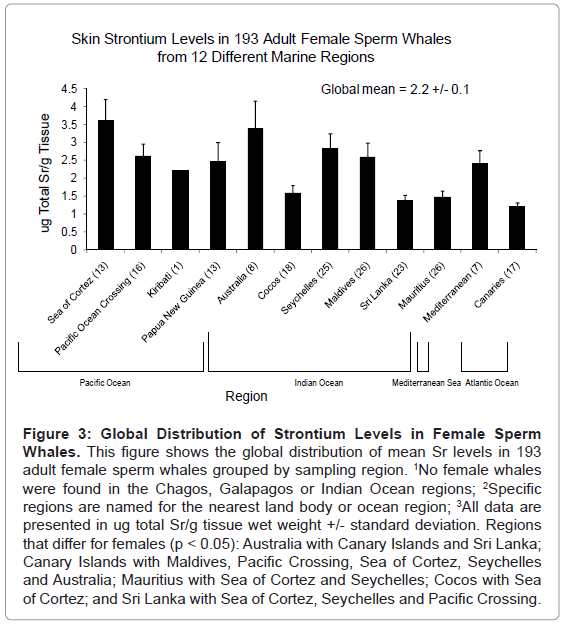
Figure 3: Global Distribution of Strontium Levels in Female Sperm Whales. This figure shows the global distribution of mean Sr levels in 193 adult female sperm whales grouped by sampling region. 1No female whales were found in the Chagos, Galapagos or Indian Ocean regions; 2Specific regions are named for the nearest land body or ocean region; 3All data are presented in ug total Sr/g tissue wet weight +/- standard deviation. Regions that differ for females (p < 0.05): Australia with Canary Islands and Sri Lanka; Canary Islands with Maldives, Pacific Crossing, Sea of Cortez, Seychelles and Australia; Mauritius with Sea of Cortez and Seychelles; Cocos with Sea of Cortez; and Sri Lanka with Sea of Cortez, Seychelles and Pacific Crossing.
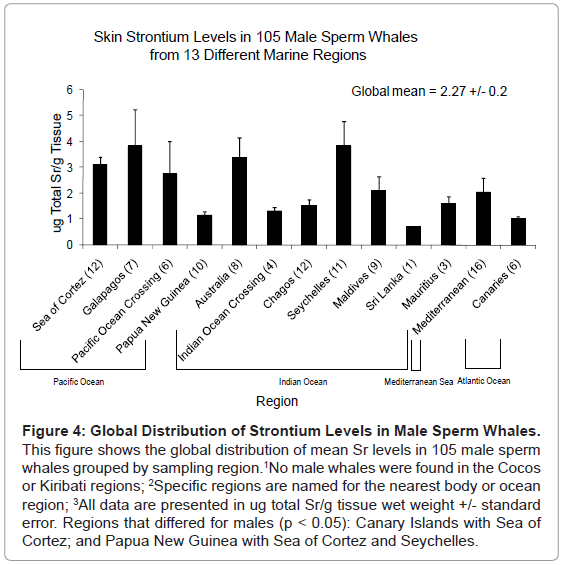
Figure 4: Global Distribution of Strontium Levels in Male Sperm Whales. This figure shows the global distribution of mean Sr levels in 105 male sperm whales grouped by sampling region. 1No male whales were found in the Cocos or Kiribati regions; 2Specific regions are named for the nearest body or ocean region; 3All data are presented in ug total Sr/g tissue wet weight +/- standard error. Regions that differed for males (p < 0.05): Canary Islands with Sea of Cortez; and Papua New Guinea with Sea of Cortez and Seychelles.
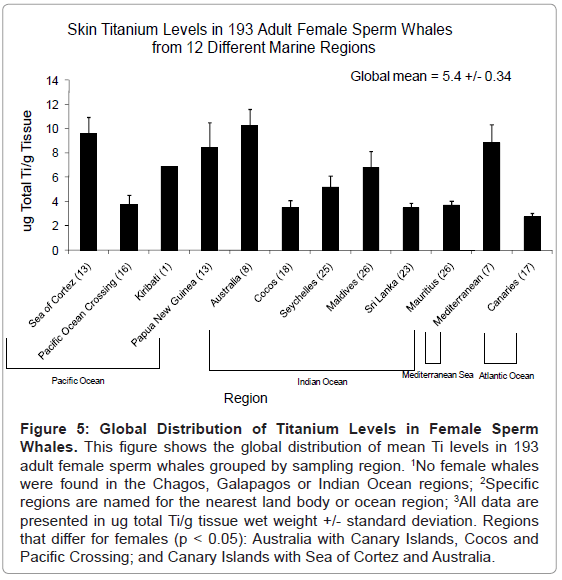
Figure 5: Global Distribution of Titanium Levels in Female Sperm Whales. This figure shows the global distribution of mean Ti levels in 193 adult female sperm whales grouped by sampling region. 1No female whales were found in the Chagos, Galapagos or Indian Ocean regions; 2Specific regions are named for the nearest land body or ocean region; 3All data are presented in ug total Ti/g tissue wet weight +/- standard deviation. Regions that differ for females (p < 0.05): Australia with Canary Islands, Cocos and Pacific Crossing; and Canary Islands with Sea of Cortez and Australia.
Strontium level comparisons by gender
We also considered the whale strontium levels by gender (Figures 2 and 3). Strontium levels in female whales ranged from 0.2 to 9.1ug/g (all female whales had detectable levels of strontium). The global mean for all female whales was 2.2 +/- 0.1ug/g. Strontium levels in male whales ranged from 0.5-11.5ug/g with a global mean of 2.3 +/- 0.2ug/g (all male whales had detectable levels of strontium). Overall, the mean levels for males and females were very similar, indicating that gender did not confound the overall pattern of regional variation. We found no conclusive evidence that increased size and age gave higher contaminant burdens, in fact, similar mean levels occurred in the much larger and older adult males (2.3 +/- 0.3ug/g) and the smaller and younger subadult males (2.2 +/- 0.3ug/g) (F(1,103) = 0.14, p = 0.71).
Considering region by gender, the highest mean strontium levels for females were found in whales sampled in the Sea of Cortez in the Pacific (range of 1.1-8.8; mean = 3.6 +/- 0.59ug/g). The lowest mean levels were seen in whales near the Canary Islands (range of 0.5-2.0; mean = 1.2 +/- 0.11ug/g). The variation among regions was statistically significant (F(11,181) = 5.82; p < 0.0001). Pair-wise t-tests showed regions that differ for females (p < 0.05) were: Australia compared to the Canary Islands and Sri Lanka; the Canary Islands compared to Maldives, our Pacific Crossing, the Sea of Cortez, the Seychelles and Australia; Mauritius compared to the Sea of Cortez and the Seychelles; Cocos compared to the Sea of Cortez; and Sri Lanka compared to the Sea of Cortez, the Seychelles and our Pacific Crossing.
The highest mean strontium levels in male sperm whales were found in whales sampled in the waters near Galapagos in the Pacific Ocean (range of 1.1-11.5; mean = 3.83 +/- 1.41ug/g) and the Seychelles in the Indian Ocean (range of 0.7-9.0; mean = 3.83 +/- 0.94ug/g). The lowest mean levels were seen in male whales near Sri Lanka (mean = 0.7ug/g based on 1 whale). The lowest mean levels based on a group of whales were seen in whales near the Canary Islands (range of 0.7- 1.3, mean = 1.0 +/- 0.09ug/g). There were also statistical differences among samples from male whales that were collected from the different regions (F(12,92) = 3.27; p = 0.0006). Pair-wise t-tests showed regions that differ for males (p < 0.05) were: The Canary Islands compared to the Sea of Cortez; and Papua New Guinea compared to the Sea of Cortez and the Seychelles.
Titanium level comparisons by region
Titanium was present in all 298 sperm whales measured (Table 6). Levels ranged from 0.1 to 29.8ug Ti/g tissue with a global mean level equal to 4.5 +/- 0.25ug/g. Considering each region, the highest mean titanium levels were found in whales sampled in waters near the Islands of Kiribati in the Pacific (6.9ug/g based on one specimen). The highest mean based on a group of specimens was found for Australia, with a value of 6.4 +/- 1.2 and a range of 0.9 to 16.3. The lowest mean levels were seen in whales from our Indian Ocean Crossing (1.68 +/- 0.18ug/g). The variation among regions was statistically significant (F(14,282) = 2.40; p = 0.004). Pair-wise t-tests showed the only regions that differed (p < 0.05) were the Canary Islands compared to Maldives.
| Region2 | N3 | Minimum4 | Maximum | Mean | Standard Error |
|---|---|---|---|---|---|
| Sea of Cortez | 25 | 0.3 | 15.8 | 6.2 | 1.0 |
| Galapagos | 7 | 0.0 | 5.9 | 2.4 | 0.8 |
| Pacific Crossing | 22 | 0.1 | 11.2 | 3.9 | 0.7 |
| Kiribati | 1 | 6.9 | 6.9 | 6.9 | - |
| Papua New Guinea | 23 | 0.1 | 28.6 | 5.7 | 1.3 |
| Australia | 16 | 0.9 | 16.3 | 6.4 | 1.2 |
| Cocos | 18 | 0.5 | 8.0 | 3.5 | 0.6 |
| Indian Ocean Crossing | 4 | 1.1 | 2.0 | 1.7 | 0.2 |
| Chagos | 12 | 1.0 | 4.8 | 2.0 | 0.3 |
| Seychelles | 36 | 0.7 | 17.1 | 4.5 | 0.7 |
| Maldives | 35 | 1.3 | 29.8 | 6.1 | 1.0 |
| Sri Lanka | 24 | 1.3 | 8.8 | 3.4 | 0.4 |
| Mauritius | 29 | 1.0 | 7.9 | 3.6 | 0.3 |
| Mediterranean | 23 | 0.8 | 18.4 | 6.2 | 1.1 |
| Canary Islands | 23 | 1.0 | 5.0 | 9.3 | 0.3 |
1193 adult female sperm whales and 105 male sperm whales were sampled; 2Specific regions are named for the nearest land body or ocean region; 3All whales had detectable levels; 4All data are presented in ug total Ti/g tissue wet weight. Regions that differ: Canary Islands with to Maldives.
Table 6: Global Distribution of Titanium Levels in Sperm Whales.1
Titanium level comparisons by gender
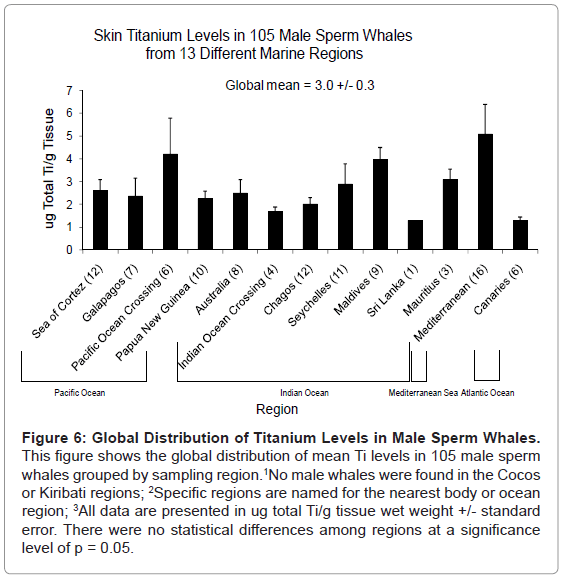
We also considered the whale titanium levels by gender (Figures 6 and 7). Titanium levels in female whales ranged from 0.1 to 29.8ug/g (all female whales had detectable levels of titanium). The global mean for all female whales was 5.4 +/- 0.34ug/g. Titanium levels in male whales ranged from 0.3 to 18.4ug/g with a global mean of 3.0 +/- 0.3ug/g (all male whales had detectable levels of titanium). Thus, titanium levels in females were 1.8-fold higher than males and this difference was significantly different (F(1, 295) = 25.70; p < 0.0001). We found no conclusive evidence that increased size and age gave higher contaminant burdens, in fact, similar mean levels occurred in the much larger and older adult males (3.1 +/- 0.4ug/g) and the smaller and younger subadult males (2.9 +/- 0.4ug/g). The small difference in means was not statistically significant (F(1,102) = 0.05; p = 0.82).
Figure 6: Global Distribution of Titanium Levels in Male Sperm Whales. This figure shows the global distribution of mean Ti levels in 105 male sperm whales grouped by sampling region. 1No male whales were found in the Cocos or Kiribati regions; 2Specific regions are named for the nearest body or ocean region; 3All data are presented in ug total Ti/g tissue wet weight +/- standard error. There were no statistical differences among regions at a significance level of p = 0.05.
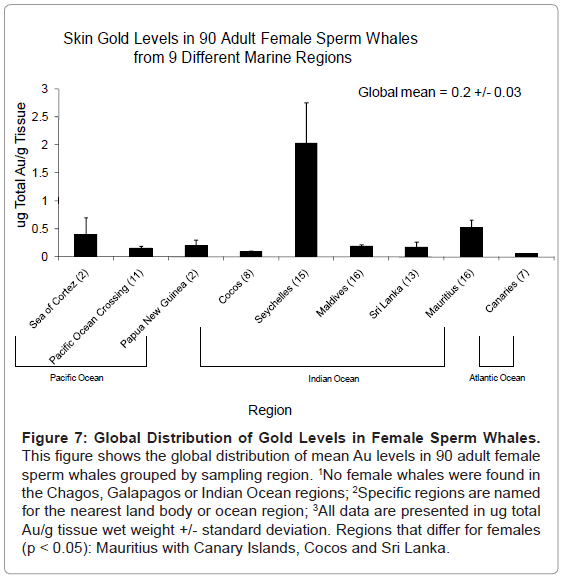
Figure 7: Global Distribution of Gold Levels in Female Sperm Whales. This figure shows the global distribution of mean Au levels in 90 adult female sperm whales grouped by sampling region. 1No female whales were found in the Chagos, Galapagos or Indian Ocean regions; 2Specific regions are named for the nearest land body or ocean region; 3All data are presented in ug total Au/g tissue wet weight +/- standard deviation. Regions that differ for females (p < 0.05): Mauritius with Canary Islands, Cocos and Sri Lanka.
Considering region by gender, the highest mean titanium levels for females were found in whales sampled in the waters near Australia in the Pacific Ocean (range of 5.1-16.3, mean = 10.2 +/- 1.4ug/g). The lowest mean levels were seen in whales near the Canary Islands (range of 1.0-5.0, mean = 2.71 +/- 0.32ug/g). The variation among regions was statistically significant (F(11,181) = 4.04; p < 0.0001). Pair-wise t-tests showed regions that differ for females (p < 0.05) were: Australia compared to Canary Islands, Cocos and our Pacific Crossing; and the Canary Islands compared to the Sea of Cortez.
The highest mean titanium levels in male sperm whales were found in whales sampled in the Mediterranean Sea (range of 0.8-18.4; mean = 5.1 +/- 1.3ug/g). The lowest mean levels were seen in whales near the Canary Islands (range of 1-1.9; mean = 1.3 +/- 0.13ug/g) and off the coast of Sri Lanka (1.3ug/g for the one whale sampled). There were no statistical differences among samples from male whales that were collected from the different regions (F(12,91) = 1.87; p = 0.05).
Gold level comparisons by region
Gold was added to the analysis later in the study so not all whales were able to be considered. Gold was present in 50 of the 194 sperm whales measured (Table 7). Detectable levels ranged from 0.1 to 2.3ug Au/g tissue with a global mean level equal to 0.2 +/- 0.02ug/g. Considering each region, the highest mean gold levels were found in sperm whales sampled in waters near Mauritius in the Indian Ocean (0.53 +/- 0.13ug/g). The lowest levels were found in sperm whales sampled during our Atlantic Crossing region and in the waters of Kiribati in the Pacific Ocean, where all of the whales sampled had undetectable gold levels (detection limit = 0.17ug/g). The variation among regions was statistically significant (F(13,180) = 6.30; p< 0.0001). Pair-wise t-tests showed regions that differed (p < 0.05) include: Mauritius compared to Australia, the Canary Islands, Chagos, Cocos, Galapagos, our Indian Ocean Crossing, our Pacific Ocean Crossing, Papua New Guinea and Sri Lanka; The Canary Islands compared to Maldives, Mauritius, the Mediterranean, and the Sea of Cortez; and Chagos compared to Mauritius, the Mediterranean, and the Sea of Cortez.
| Region2 | N3 | Minimum4 | Maximum | Mean | Standard Error |
|---|---|---|---|---|---|
| Sea of Cortez | 13 (6) | 0.2 | 1.0 | 0.3 | 0.1 |
| Galapagos | 6 (0) | ND | ND | 0.1 | 0.0 |
| Pacific Crossing | 17 (4) | 0.2 | 0.5 | 0.1 | 0.0 |
| Kiribati | 0 | NA | NA | NA | 0.0 |
| Papua New Guinea | 12 (1) | 0.3 | 0.3 | 0.1 | 0.0 |
| Australia | 8 (1) | 0.3 | 0.3 | 0.1 | 0.0 |
| Cocos | 8 (1) | 0.2 | 0.2 | 0.1 | 0.0 |
| Indian Ocean Crossing | 4 (0) | ND | ND | 0.1 | 0.0 |
| Chagos | 12 (0) | ND | ND | 0.1 | 0.0 |
| Seychelles | 27 (7) | 0.2 | 0.9 | 0.2 | 0.0 |
| Maldives | 25 (7) | 0.1 | 0.6 | 0.2 | 0.0 |
| Sri Lanka | 14 (3) | 0.2 | 1.2 | 0.2 | 0.1 |
| Mauritius | 19 (14) | 0.2 | 2.3 | 0.5 | 0.1 |
| Mediterranean | 16 (6) | 0.3 | 0.9 | 0.3 | 0.1 |
| Canary Islands | 13 (0) | ND | ND | 0.1 | 0.0 |
190 adult female sperm whales and 104 male sperm whales were sampled; 2Specific regions are named for the nearest land body or ocean region; 3Whales with detectable levels in parentheses; 4All data are presented in ug total Au/g tissue wet weight. Regions that differ: Mauritius with Australia, Canary Islands, Chagos, Cocos, Galapagos, Indian Ocean Crossing, Pacific Ocean Crossing, Papua New Guinea and Sri Lanka; Canary Islands with Maldives, Mauritius, Mediterranean, and Sea of Cortez; and Chagos with Mauritius, Mediterranean and Sea of Cortez..
Table 7: Global Distribution of Gold Levels in Sperm Whales.1
Gold level comparisons by gender
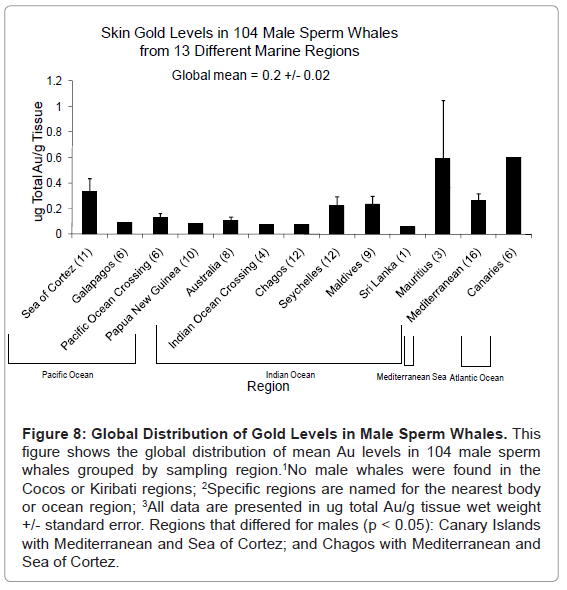
We also considered the whale gold levels by gender (Figures 7 and 8). Measurable levels in female whales with detectable levels of gold ranged from 0.1-2.3ug/g (60 of 90 female whales had undetectable levels of gold). The global mean for all female whales was 0.2 +/- 0.03ug/g. Gold levels in male whales ranged from 0.2-1.5ug/g and a global mean 0.2 +/- 0.02ug/g (84 of 104 male whales had undetectable levels of gold). Overall, the mean level for males was the same as females, indicating that gender was not a confounding factor of the overall regional pattern seen for the genders combined. We found no conclusive evidence that increased size and age gave higher contaminant burdens, in fact, the mean levels were the same in the much larger and older adult males (0.2 +/- 0.0ug/g) compared to levels in subadult males (0.2 +/- 0.0ug/g) (F(1,102) = 1.35, p = 0.25).
Figure 8: Global Distribution of Gold Levels in Male Sperm Whales. This figure shows the global distribution of mean Au levels in 104 male sperm whales grouped by sampling region. 1No male whales were found in the Cocos or Kiribati regions; 2Specific regions are named for the nearest body or ocean region; 3All data are presented in ug total Au/g tissue wet weight +/- standard error. Regions that differed for males (p < 0.05): Canary Islands with Mediterranean and Sea of Cortez; and Chagos with Mediterranean and Sea of Cortez.
Considering regions by gender, the highest mean gold levels for females were found in whales sampled in the waters near Mauritius in the Indian Ocean (range of 0.2-2.3; mean = 0.52 +/- 0.14ug/g). The lowest mean levels were seen in whales near the Canary Islands (with all whales having nondetectable levels) and off of the coast of Cocos Islands (range of 0.06-0.2; mean = 0.09 +/- 0.02ug/g). The variation among regions was statistically significant (F (8,81) = 4.15; p = 0.0003). Pair-wise t-tests showed regions that differ for females (p < 0.05) were: Mauritius compared to the Canary Islands, Cocos and Sri Lanka.
The highest mean gold levels in male sperm whales were also found in whales sampled in the waters near Mauritius (range of 0.2- 1.5, mean = 0.59 +/- 0.46ug/g). The lowest mean levels were seen in whales near Papua New Guinea, Galapagos, Canary Islands, Chagos, Sri Lanka and in the Indian Crossing where all male whales sampled had nondetectable levels. The lowest mean levels for male whales with detectable levels were seen in whales near Australia (range of 0.06-0.3; mean = 0.1+/- 0.03ug/g) and in the Pacific Crossing (range of 0.06-0.3; mean = 0.13 +/- 0.03ug/g). There were also statistical differences among samples from male whales that were collected from the different regions (F(12,91) = 4.14; p < 0.0001). Regions that differed include: The Canary Islands from the Mediterranean and the Sea of Cortez; and Chagos from the Mediterranean and the Sea of Cortez.
Discussion
Barium, gold, titanium and strontium may pose marine concerns because of their increasing use as nanomaterials. This study reports the global distribution of barium, gold, titanium and strontium in sperm whales, a marine predator near the top of the food chain. It is the first global study of the distribution of these metals and it was conducted in apparently healthy free ranging whales. Using sperm whales as an indicator species, we find that total barium, gold, titanium and strontium levels are generally low. These samples were collected between 2000 and 2005. Thus, the data provide a rare pre-new industry baseline as they reflect levels prior to the extensive use of these metals as nanomaterials. This report builds on our previous study of chromium levels, which were generally high in whales from these regions [11] and extend our knowledge to include barium, gold, titanium and strontium.
Our data appear to be the first to measure barium, gold, and strontium levels in sperm whales. We determined our global baseline in free-ranging, healthy whales, which limits the options for available tissue to skin and blubber from biopsies. Metals accumulate more in skin than blubber so we focused on skin levels. There is one report of titanium in a previous study of seven sperm whales from the North Sea [13]. Six of the whales in that study stranded alive and all of the samples were taken within 24 h of death. That study reported detectable titanium levels in 2 whales. One had detectable levels in kidney and liver of 0.3 and 0.2ug/g dry weight. The other whale had detectable levels in kidney and muscle of 1.3 and 1.2ug/g dry weight. Our samples were measured with wet weight. If we assume a 75% moisture level, and convert the dry weight values to wet weight, the titanium levels in the previous study convert to 0.05-0.33ug/g. Unfortunately, the study did not consider skin levels so direct organ comparisons are not possible, however, these levels are at the low end of our range of 0.1 to 29.8ug/g titanium wet weight. The explanation for these differences is uncertain. It may reflect that titanium accumulates more in skin than liver, muscle or kidney. It may reflect the fact that the previous study only considered seven animals. We were unable to locate experimental animal studies of the tissue distribution of titanium that included skin tissue.
Our data also appear to be the first to measure gold levels in a cetacean species. In addition, aside from the sperm whale titanium report discussed above, we found no additional reports of titanium levels in cetaceans. We did find two reports of cetacean barium skin levels [14,15]. One study considered barium skin levels in Antarctic minke whales reporting a mean barium skin level of 0.04ug/g (converted from dry weight) in both 120 males and 39 females [14]. The second study reported a mean barium skin level of 0.03ug/g (converted from dry weight) in 44 bottlenose dolphins (Tursiops truncatus) from South Carolina and 0.01ug/g (converted from dry weight) in 57 bottlenose dolphins from Florida [15]. The mean level in these two reports are much lower than our mean barium level of 0.93ug/g. We also found males had significantly less barium than female whales, which was not observed in these studies. The explanation for these differences is uncertain, but most likely reflects regional differences as none of our samples came from Florida, South Carolina or Antarctica. We did observe statistically significant variation among regions for barium levels.
We also found three reports that investigated strontium skin levels in cetaceans [14,16,17]. One study considered strontium skin levels in Antarctic minke whales reporting a mean strontium skin level of 0.61ug/g (converted from dry weight) in 120 males and 0.66ug/g in 39 females [14]. The second study reported a mean strontium skin level of 0.7ug/g (converted from dry weight) in 44 common dolphins (Delphinus delphis) and 1.15ug/g (converted from dry weight) in 2 bottlenose dolphins all from Portugal [16]. The third study reported a level of 0.56ug/g in a single Dall's porpoise from the coast of Japan [17]. Each of these mean levels are lower than our global mean strontium skin level of 2.2ug/g. However, they are consistent with the lower end of our strontium range of 0.2 to 11.5ug/g and our observations of little difference between males and females. The common dolphin level is very similar to our global mean. It is exactly the same as our mean level from the Canary Islands (1.15ug/g), which is relatively near Portugal suggesting the differences are likely due to regional differences. We did find statistically significant variation among regions for strontium.
In summary, we have established a global baseline for four metals that are being used more extensively as nanomaterials using sperm whales as an indicator species. The use of these materials is likely to increase exposure levels and potentially change toxicity. The data indicate that sperm whales are indeed exposed to barium, gold, titanium and strontium and that these exposures have reached even remote ocean regions. Overall, the data indicate that barium, gold, titanium and strontium levels are generally low giving us an important and useful baseline to eventually determine if nanomaterials made of these metals are impacting the marine environment. Additional work is needed to understand the toxicity of nanosized barium, gold, titanium and strontium to whales and how it transports through the environment to reach remote regions.
Acknowledgements
Our thanks go to the crew of the RV Odyssey who collected the samples and the staff at Ocean Alliance who managed this global expedition. We thank Drs. Gregory Buzard and Hong Xie for technical assistance. We thank the many supporters of the Ocean Alliance and the Maine Center for Toxicology and Environmental Health for financial support. Work was conducted under NMFS permit #1008-1637-00 (J. Wise, PI) and permit #751-1614 (I. Kerr, PI).
References
- Haruta M (2005) Gold Rush. Nature 437: 1098-1099.
- Hughes MD, Xu YJ, Jenkins P, McMorn P, Landon P, et al. (2005) Tunable gold catalysts for selective hydrocarbon oxidation under mild conditions. Nature 437: 1132-1135.
- Hood E (2004) Nanotechnology: Diving into the unknown. Environ Health Perspect 112: A747-A749.
- Goodman CM, McCusker CD, Yilmaz T, Rotello VM (2004) Toxicity of gold nanoparticles functionalized with cationic and anionic side chains. Bioconjug Chem 15: 897-900.
- Corti CW, Holliday RJ (2005) Increasing gold demand: new industrial applications. Appl Earth Sci (IMM B) 114: 15-21.
- Aitken RJ, Chaudhry MQ, Boxall ABA, Hull M (2006) Manufacture and use of nanomaterials: current status in the UK and global trends. Occup Med 56: 300- 306.
- Tanasea T, Kobayashia Y, Miwab T, Konnoa M (2005) Fabrication and dielectric properties of barium strontium titanate nano-particles/amorphous lead zirconate titanate composite thin film. Thin Solid Films 485: 22-26.
- Brown MW, Kraus SD, Gaskin DE (1991) Reaction of right whales (Eubalaena glacialis) to skin biopsy sampling for genetic and pollutant analysis. Rep Int Whal Commn (special issue) 13: 81-89.
- Richard KR, McCarry SW, Wrighy LM (1994) DNA sequence from the SRY gene of the sperm whale (Physeter macrocephalus) for use in molecular sexing. Can J Zool 72: 873-877.
- Alijanabi SM, Martinez I (1997) Universal and rapid salt-extraction of high quality genomic DNA for PCR-based techniques. Nucleic Acids Res 25: 4692- 4693.
- Wise JP Sr, Payne R, Wise SS, LaCerte C, Wise J, et al. (2009) A global assessment of chromium pollution using sperm whales (Physeter macrocephalus) as an indicator species. Chemosphere 75: 1461-1467.
- SAS Institute Inc. (2004) SAS/STAT 9.1 User's Guide. SAS Institute Inc., Cary, NC.
- Holsbeek L, Joiris CR, Debacker V, Ali IB, Roose P, et al. (1999) Heavy metals, organochlorines and polycyclic aromatic hydrocarbons in sperm whales stranded in the Southern North Sea during 1994/1995 winter. Mar Pollut Bull 38: 304-313.
- Kunito T, Watanabe I, Yasunaga G, Fujise Y, Tanabe S (2002) Using trace elements in skin to discriminate the populations of minke whales in southern hemisphere. Mar Environ Res 53: 175-197.
- Stavros HC, Bossart GD, Hulsey TC, Fair PA (2007) National Oceanic and Trace element concentrations in skin of free-ranging bottlenose dolphins (Tursiops truncatus) from the southeast Atlantic coast. Sci Tot Environ 388: 300-315.
- Carvalho ML, Pereira RA, Brito J (2002) Heavy metals in soft tissues of Tursiops truncatus and Delphinus delphis from west Atlantic Ocean by X-ray spectrometry. Sci Tot Environ 292: 247-254.
- Yang J, Miyazaki N, Kunito T, Tanabe S (2006) Trace elements and butyltins in a Dall's porpoise (Phocoenoides dalli) from the Sanriku coast of Japan. Chemosphere 63: 449-457.
Relevant Topics
- Aquatic Ecosystems
- Biodiversity
- Conservation Biology
- Coral Reef Ecology
- Distribution Aggregation
- Ecology and Migration of Animal
- Ecosystem Service
- Ecosystem-Level Measuring
- Endangered Species
- Environmental Tourism
- Forest Biome
- Lake Circulation
- Leaf Morphology
- Marine Conservation
- Marine Ecosystems
- Phytoplankton Abundance
- Population Dyanamics
- Semiarid Ecosystem Soil Properties
- Spatial Distribution
- Species Composition
- Species Rarity
- Sustainability Dynamics
- Sustainable Forest Management
- Tropical Aquaculture
- Tropical Ecosystems
Recommended Journals
Article Tools
Article Usage
- Total views: 14044
- [From(publication date):
March-2011 - Sep 24, 2024] - Breakdown by view type
- HTML page views : 9634
- PDF downloads : 4410

