Research Article Open Access
A Multiscale Variation Partitioning Procedure for Assessing the Influence of Dispersal Limitation on Species Rarity and Distribution Aggregation in the 50-Ha Tree Plots of Barro Colorado Island, Panama
Youhua Chen*Department of Zoology, University of British Columbia, Vancouver, Canada
- *Corresponding Author:
- Youhua Chen
Department of Renewable Resources
University of Alberta
Edmonton, T6G 2H1, Canada
E-mail: yhchen@zoology.ubc.ca
Received date: July 01, 2013; Accepted date: August 26, 2013; Published date: August 28, 2013
Citation: Chen Y (2013) A Multiscale Variation Partitioning Procedure for Assessing the Influence of Dispersal Limitation on Species Rarity and Distribution Aggregation in the 50-Ha Tree Plots of Barro Colorado Island, Panama. J Ecosys Ecograph 3:134. doi:10.4172/2157-7625.1000134
Copyright: © 2013 Chen Y. This is an open-access article distributed under the terms of the Creative Commons Attribution License, which permits unrestricted use, distribution, and reproduction in any medium, provided the original author and and source are credited.
Visit for more related articles at Journal of Ecosystem & Ecography
Abstract
Spatial autocorrelation is one of the most important ecological processes discussed in current ecological literature. The present study represents an attempt to quantify the effect of dispersal limitation on community structure under a local environmental condition using a multiscale approach. Moreover, I assess the relationships between explained variation accounted for by space, rarity, and the distributional aggregation of species in the community. My results showed that spatial autocorrelation would have increasing influences on community composition when the spatial resolutions were increased for the 50-ha tree plots of Barro Colorado Island (BCI), Panama Canal. Also, when spatial resolutions were increasing, the rarity of species tended to decrease as measured as an intrinsic characteristic of the species regarding its distribution (monotonically), while the aggregation of species tended to increase (not monotonically). Overall, it might be of some values to perform such multiscale analyses for analyzing the relative contribution of space and environment on shaping community structure and species distribution dynamically.
Keywords
Aggregation of distribution; Rarity versus commonness; Variation partitioning; Negative binomial distribution; Barro Colorado Island (BCI)
Introduction
Partitioning variation for identifying relative importance of different ecological processes are ubiquitous in current ecological literature. Especially in the discipline of community ecology, variation partitioning has been widely applied to reveal the influences of dispersal limitation and environmental filtering.
One common assumption in analyzing ecological communities is that scale of the data is fixed without change. This might lead to problems as different species might respond differently to the spatial resolutions due to various dispersal abilities or niche processes operating at different scales. Thus, it might be misleading to apply a fixed spatial resolution to evaluate the influences of environment and space on species distribution or community structure. As stated by Karst et al. [1], “the balance of stochastic and deterministic factors influencing plant distributions depends on spatial resolution”. Therefore, ignorance of spatial resolution transformation inherent in the raw data may pose risks of misunderstanding on the various effects of ecological processes.
To explicitly resolve the spatial invariance issue, in the present study I am trying to quantify the effects of dispersal limitation on compositional variation of the community using a multiscale procedure. Since the multiscale method is highly flexible and compatible with traditional fixed-scale methods, this procedure might allow more information to be extracted regarding the effects of dispersal limitation and environmental filtering.
Rare species have unique roles contributing to community diversity [2]. They are also important to identify conservation priorities [3], evaluate extinction risks and serve as flagship species in the local communities [4].
However, it is still unclear how rarity would influence resulting variation contributed by spatial autocorrelation. The common hypothesis should be that rare species typically has limited distributional range and thus should be determined by space or limited habitats. Thus, if there are a lot of rare species in the community, I would predict that the proportion of total variation (indicated by adjusted R2 ) explained by space should be remarkably large.
Aggregation of species distributions is ubiquitous in ecological data [5-8]. Many studies have attempted to estimate the degree of aggregation and evaluate the consequences of aggregation on the species-area relationship [9,10] and abundance estimation [11].
To date, no study has dealt with the impacts of species aggregations on the explained variations contributed by space. One hypothesis for linking species aggregation and variation partitioning for space could be that increasing spatial aggregation would lead to a higher percentage of explained variation attributed to space because aggregated species should be spatially limited in their distributional ranges (Of course, increasing spatial aggregation may lead to higher percentage of explained variation attributed to environment when the environment or habitats are spatially structured, in this case, the role of space and environment cannot be distinguished because environment interplays with space). Typically, when the spatial resolutions are increasing, the species’ distribution should appear more aggregated (because distribution points at adjacent cells are merged gradually). Thus, I predict that explained variation contributed by space should increase when spatial resolutions are increasing for the community.
In the present study, I have three research objectives for better understanding the contributions of space and environment on structuring ecological communities: (1) the shifting pattern of explained variation attributed to spatial autocorrelation caused by the rescaling of the data; (2) the relationship between explained variation and the rarity of species in the community; and (3) the relationship between explained variation and the aggregation of species in the community.
Materials and Methods
Multiscale procedure
The multiscale technique is nothing new, but simply to modify the areal size (merge or split different local quadrates to form new quadrates with new areal sizes and spatial scales) and spatial coordinates (recalculation of the geographic coordinate centroids of these newly formed quadrates) of the sampling quadrates according to different spatial scales. The generated new quadrates in each step of the rescaling procedure are then operated using Redundancy Analysis (RDA) and/or Canonical Correspondence Analysis (CCA) to evaluate the explained variation contributed by space. The calculation of explained variation contributed by space follows the previous studies using variation partitioning technique [12-15]. In a simple sense, the method is to implement a multivariate regression analysis on the species community matrix (quadrate-species matrix) using the geographic coordinate centroids of the quadrates as the explanatory variables.
In the present study, the rescaled procedure is run in a manner from high to low spatial resolutions. Specifically, the original data set is considered to have the highest spatial resolution, in which the whole studied region is divided into regular quadrates, and the areal size of the smallest spatial unit is calculated (Scale 1 subplot in Figure 1). The selection of regular quadrates is for satisfying the requirement that all the studied quadrates could cover the distributional points of at least one species.

Figure 1: The multiscale procedure for analyzing the community structure of Barro Colorado Island (BCI) tree community (40 sampling quadrates).
Then, I merge every two adjacent quadrates from the original grid cell system to form new sampling quadrates with a lower spatial resolution (Scales 2, 4 and 8 subplots in Figure 1), in which the abundance of the species is summed and the environmental data are averaged. The outcome of this rescaling step is that the size of smallest spatial unit of the data becomes twofold larger than the previous unscaled data. The procedure continues until the size of the smallest unit of the distribution data becomes 1/5 of the total area size (Figure 1).
Extraction of spatial variables
consider two methods to quantify and extract spatial information contained in the data so as to use them as explanatory variables when performing RDA (or CCA) analyses. The first method is called as principal coordinates of neighbor matrices [16], while the second one is a cubic regression model, written as
 [
[where X and Y denote the latitude and longitude respectively of the geographic coordinate centroids of a newly formed quadrate.
Assessment of the rarity of species
When the spatial resolutions vary, I am able to quantify the role of species rarity on resultant explained variations contributed by space and environment, respectively. To quantify the rarity of species in the community, I consider that the percentages of species which occur (their presence information) in less than 10%, 30% and 50% of the total quadrates (R10, R30, R50).
Assessment of the aggregation of species
To measure the aggregation of species across the distributional ranges, instead of using the negative binomial distribution [7,8,18,19], I consider the finite version of negative binomial distribution, which has been recommended recently for its merits of handling range-narrow species [5].
The finite negative binomial probability of species distribution reads,
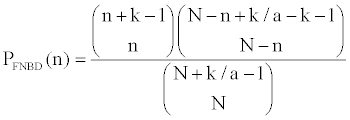 (1)
(1)
Estimation of aggregation parameter k follows the previous work [5]:
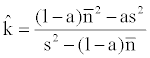 (2)
(2)
 (3)
(3)
 (4)
(4)
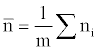
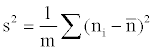
Where m is the number of quadrates, a is the ratio between smallest spatial unit size and the whole range,  is the abundance vector in a set of sampled quadrates.
I take the average of the aggregation parameter k for all the species to represent the community aggregation status when analyzing the relationship between aggregation and rarity of the species community.
Example
Distribution of 225 tree species in 40 Barro Colorado Island (BCI) sampling plots
The distribution of the tree abundances across the BCI sampling plots is derived from a previous study [20]. Originally there are 100 sampling sites, but I only consider sampling plots with standard square design (as those presented in Figure 1). Therefore, the resulting matrix is the one with a dimension of 225 × 40, in which there are 40 sampling sites and 225 tree species.
Spatial variables used for the analysis include the geographic coordinates (latitude and longitude) of the sampling plots. Environmental variables, including precipitation and elevation, age of the plot and the geology, are basically identical across the 40 sampling plots, thus indicating an environmentally homogeneous landscape [21-23]. Thus, these 40 plots allow the contribution of space on influencing community structure of trees to be tested, while ignoring environmental variability.
All the analyses are done using R software [24].
Results
Explained variation accounting for space as the function of varying spatial resolutions
Since the results from RDA and CCA are basically the same, and the explained variation for space using PCNM method, cubic regression model and original geographic coordinates are highly similar, thus only the results for RDA with raw coordinates as input are discussed hereafter.
As shown in Table 1, increasing the smallest spatial unit for BCI data would lead to increasing explained variation attributed to space. Thus, when the spatial resolutions are larger, typically the spatial distributional range of species is larger.
| Scales | R10 | R30 | R50 | k(FNBD) | Effective Species Number | RDA |
|---|---|---|---|---|---|---|
| 1 | 25.90% | 45.90% | 64.10% | 4.5 | 149 | 22.54% |
| 2 | 19.50% | 34.10% | 48.20% | 7.28 | 150 | 33.82% |
| 4 | 13.20% | 26.40% | 35.00% | 5.5 | 150 | 47.42% |
| 8 | 0.00% | 14.10% | 23.60% | 11.6 | 150 | 58.87% |
Table 1: Patterns of rarity (R10, R30, R50) and aggregation ( k ) of species in Barro Colorado Island (BCI) tree community and explained variation for space using RDA when the spatial resolutions rise up (area size of smallest sampling quadrate is increasing with the scale parameter). Effective species number indicated the species with distributions that can be used for estimating aggregation parameter k .
Relationship between explained variation accounted for space and percentages of rarity of species in the community (R10, R30, R50)
Increasing the smallest spatial unit for BCI data would lead to a decreasing rarity of species in the community, as indicated by R10, R30, and R50 indices (Table 1).
The relationship between explained variation from RDA and the R10, R30, R50 is present in Table 1. The results show that there is a strong negative relationship between community rarity and explained variation for space. This result suggests that when spatial resolutions are increasing, the rarity of species has a decreasing trend, while the space could explain more percentage of variation within the community composition.
Relationship between explained variation accounting for space and the aggregation patterns of species in the community
Estimation of the aggregation parameter for rare species still encounters fitting difficulties here (no convergence), in contrast to previous work [5]. I also attempted to fit the aggregation parameter for negative binomial distribution, and the results are basically identical. Thus, only the result for finite negative binomial distribution is presented (Table 1). Basically, the aggregation of species has an increasing trend when the smallest grid cell size is increased.
The relationship between explained variation from RDA and the aggregation parameter k is presented in Table 1. The results show that when the aggregation of species in the community has an increasing trend, the space could explain more percentage of variation within the community composition.
Interestingly, results highlight that the effective species number (those species can generate reasonable k >0) is not changed under multiscaling process. The number is fixed at 150 as shown in Table 1. Thus, in the increasing scaling procedure, aggregation patterns for some species seem invariant. Typically these species should be the ones with the associated aggregation parameter k that is difficult to estimate. When checking the distribution of each species, most species without reasonable estimation of k are the ones with singular distributions in the BCI quadrates.
Discussion
Aggregation and rarity patterns of species under varying spatial resolutions
Contrary to the prediction mentioned above, increasing spatial resolutions does not increase rarity of species. Instead, many species become more common when spatial resolutions are increased. A very reason for this result might be due to the reduced quadrate number, thereby reducing the rarity of species.
Reducing rarity of the species in a community could better reveal spatial or environmental gradients [25]. Thus, it is not surprising in my study that the explained variation for space would increase when the community rarity is reduced.
Relationships between explained variations accounted for space and environment and percentages of rarity of species in the community (R10, R30, R50)
Community rarity thus might be an indicator to assess the role of spatial autocorrelation. As shown in Table 1, increasing spatial resolutions would decrease community rarity indices (R10, R30, R50), meanwhile the explained variation attributed to spatial autocorrelation is decreased remarkably. There is a tight negative association between rarity of species in the community and the explained variation for space. Thus, it is rational to use rarity of the community to predict the relationship between explained variation for space and the compositional variation of the community [26].
Relationships between explained variation accounted for space and the aggregation patterns of species in the community
Interestingly, it is found that increasing aggregation of species distribution could increase the explained variation caused by space. This observation is congruent with my primary prediction. The aggregation status of species might reflect the spatial clustering patterns of the species in the area. Thus, a higher aggregation of species should have a higher clustering probability, leading to a stronger effect of spatial autocorrelation. By this manner, the explained variation caused by space should increase consequently.
Limitations of the present study
First, the robustness of the analysis may be challenging because of limited data size. In the present study, only 5 quadrates are available as the response variable at the largest scale, while only 10 quadrates are available at the second largest scale. These small data sizes confine the reliability of the corresponding findings.
Second, rarity and aggregation may not be changed independently of spatial resolution. The consequence is that the results are not reliably interpreted. This issue should be possible, as indicated by the results presented in Table 1: the correlation between these two quantities is strong over various spatial resolutions. However, prior knowledge did not assume any relationships between rarity and aggregation when spatial resolution is changing. Therefore, their non-independent change when spatial resolution is varying can be one of the causes but not the only cause. In the present study, it is not possible to remove the nonindependent change of both quantities.
Finally, the empirical study system (BCI tree plots) utilized in the present study may be too specific to address the topic on a general level. It is situated in a local area, the results may not be generalized and applicable to the data of field plots in other regions. This limited sampling issue can be avoided if one can explore and compare the empirical data in other global permanent forest plots.
Acknowledgements
The author appreciates the associate editor Charles W. Martin and three anonymous reviewers for their critical comments on helping improve the quality of previous versions of the manuscript. Smithsonian Tropical Research Institute is acknowledged as well for making the BCI data sets available to the public.
References
- Karst J, Gilbert B, Lechowicz M (2005) Fern community assembly: the roles of chance and the environment at local and intermediate scales. Ecology 86: 2473-2486.
- Mi X, Swenson NG, Valencia R, Kress WJ, Erickson DL, et al (2012) The Contribution of Rare Species to Community Phylogenetic Diversity across a Global Network of Forest Plots. Am Nat 180: E17-30.
- Williams P, Gibbons D, Margules C, Rebelo A, Humphries C, et al (1996) A comparison of richness hotspots, rarity hotspots, and complementary areas for conserving diversity of British birds. Conservation Biology 10: 155-174.
- Chen Y, Bi J (2007) Biogeography and hotspots of amphibian species of China: implications to reserve selection and conservation. Current Science 92: 480-489.
- Zillio T, He F (2010) Modeling spatial aggregation of finite populations. Ecology 91: 3698-3706.
- He F, Gaston KJ (2000) Estimating species abundance form occurrence. Am Nat 156: 553-559.
- Pielou EC (1977) Mathematical Ecology. John Wiley & Sons, New York, USA.
- Taylor LR, Woiwod IP, Perry JN (1978) The density dependence of spatial behaviour and the rarity of randomness. J Animal Ecology 47: 383-406.
- Green JL, Ostling A (2003) Endemics-area relationships: the influence of species dominance and spatial aggregation. Ecology 84: 3090-3097.
- Plotkin JB, Potts MD, Leslie N, Manokaran N, Lafrankie J, et al (2000) Species-area curves, spatial aggregation, and habitat specialization in tropical forests. J Theor Biol 207: 81-99.
- Hui C, Boonzaaier C, Boyero L (2012) Estimating changes in species abundance from occupancy and aggregation. Basic and Applied Ecology 13: 169-177.
- Legendre P (2007) Studying beta diversity: ecological variation partitioning by multiple regression and canonical analysis. J Plant Ecol 1: 3-8.
- Legendre P, Legendre LFJ (1998) Numerical ecology. Elsevier Science BV, Amsterdam, Netherlands.
- Borcard D, Legendre P, Drapeau P (1992) Partialling out the Spatial Component of Ecological Variation. Ecology 73: 1045-1055.
- Meot A, Legendre P, Borcard D (1998) Partialling out the spatial component of ecological variation: questions and propositions in the linear modelling framework. Environ Ecol Stat 5: 1-27.
- Dray S, Legendre P, Peres-Neto PR (2006) Spatial modelling: a comprehensive framework for principal coordinate analysis of neighbour matrices (PCNM). Ecol Model 196: 483-493.
- Gilbert B, Lechowicz MJ (2004) Neutrality, niches, and dispersal in a temperate forest understory. PNAS 101: 7651-7656.
- Perry JN, Taylor LR (1985) Ades: new ecological families of species-specific frequency distributions that describe repreated spatial samples with an intrinsic power-law variance-mean property. J Animal Ecology 54: 931-953
- Boswell MT, Patil GP (1970) Chance mechanisms generating the negative binomial distribution. In: Patil G (ed) Random counts in models and structures. Pennsylvania State University Press, University Park, Pennsylvania, USA 3-22.
- Condit R, Pitman N, Leigh EG, Chave J, Terborgh J, et al (2002) Beta-diversity in tropical forest trees. Science 295: 666-669.
- Harms KE, Condit R, Hubbell SP, Foster RB (2001) Habitat associations of trees and shrubs in a 50 ha neotropical forest plot. J Ecology 89: 947-959.
- John R, Dalling JW, Harms KE, Yavitt JB, Stallard RF, et al (2007) Soil nutrients influence spatial distribution of tropical tree species. PNAS 104: 864-869.
- Morlon H, Chuyong G, Condit R, Hubbell S, Kenfack D, et al (2008) A general framework for the distance-decay of similarity in ecological communities. Ecol Lett 11: 904-917.
- R Development Core Team (2011) R: A Language and Environment for Statistical Computing, Vienna, Austria.
- Lengyel A, Csiky J, Botta-Dukat Z (2012) How do locally infrequent species influence numerical classication? a simulation study. Community Ecology 13: 64-71.
- Legendre P, Borcard D, Peres-Neto PR (2005) Analyzing beta diversity: Partitioning the spatial variation of community composition data. Ecological Monographs 75: 435-450.
Relevant Topics
- Aquatic Ecosystems
- Biodiversity
- Conservation Biology
- Coral Reef Ecology
- Distribution Aggregation
- Ecology and Migration of Animal
- Ecosystem Service
- Ecosystem-Level Measuring
- Endangered Species
- Environmental Tourism
- Forest Biome
- Lake Circulation
- Leaf Morphology
- Marine Conservation
- Marine Ecosystems
- Phytoplankton Abundance
- Population Dyanamics
- Semiarid Ecosystem Soil Properties
- Spatial Distribution
- Species Composition
- Species Rarity
- Sustainability Dynamics
- Sustainable Forest Management
- Tropical Aquaculture
- Tropical Ecosystems
Recommended Journals
Article Tools
Article Usage
- Total views: 13763
- [From(publication date):
December-2013 - Sep 20, 2024] - Breakdown by view type
- HTML page views : 9379
- PDF downloads : 4384