Research Article Open Access
Leaves of Vallisneria Finds Source to Anti Dermatitis: Enriching Wetland Ecosystem
Nabanita Chakraborty1, Basudev Mandal2* and Archan Kanti Das3
1ICAR- Central Inland Fisheries Research Institute (CIFRI) Monirampore, Barrackpore-700120, India
2Aquaculture Management and Technology, Vidyasagar University, Midnapore-721102, India
3Reservoir and Wetland Fisheries Division, ICAR- Central Inland Fisheries Research Institute (CIFRI) Monirampore, Barrackpore-700120, India
- *Corresponding Author:
- Basudev Mandal
Aquaculture Management and Technology
Vidyasagar University
Midnapore-721102, India
Tel: +9434185409
E-mail: bmandalamtvu@gmail.com
Received Date: September 16, 2015 Accepted Date: September 20, 2015 Published Date: October 10, 2015
Citation: Chakraborty N, Mandal B, Das AK (2015) Leaves of Vallisneria Finds Source to Anti Dermatitis: Enriching Wetland Ecosystem. J Ecosys Ecograph 5:169. doi:10.4172/2157-7625.1000169
Copyright: © 2015 Chakraborty N, et al. This is an open-access article distributed under the terms of the Creative Commons Attribution License, which permits unrestricted use, distribution, and reproduction in any medium, provided the original author and source are credited.
Visit for more related articles at Journal of Ecosystem & Ecography
Abstract
The renaissances of phyto-medicines lead to a resolute search of potential medicinal plants worldwide. In this perspective, predominantly, terrestrial allelochemistry has been an imperative tool to evaluate the drug potentiality of a plant. However, in aquatic ecosphere, the pharmaceutical evaluation of the aquatic macrophytes is an emerging aspect. Our study seeks to explore the curative traits of the exotic macrophyte, Vallisneria spiralis L. (Hydrocharitaceae), a perennial stoloniferous species and a key ecological community in freshwater wetland ecosystem. It is commonly used as aquarium plant and inhabits both in lentic and lotic environment of tropical and sub-tropical regions worldwide. Being rapid colonizers of aquatic ecosystem, literature study states the leaves of the macrophyte can excrete special function groups that can absorb, filter and precipitate chemical compound of water and through the auxiliary function of the microorganism. Considering these significances, we have extracted the leaf leachates of Vallisneria in 80% ethanol which had been purified by solid-liquid extraction process and further crystallized and subjected to biochemical analysis viz; phenols, flavonoids and tannins followed by antioxidant scavenging and microbial screening. Further the isolated compound was subjected to Mass and Fourier Infra-red Spectrometry. Comprehensively, all the experimental assays infer that Vallisneria leaves contain bioactive compound with mol wt. m/z 359 structured with microbial growth inhibiting functional groups which were found fungicidal against Malassezia globosa - the dandruff causing dermatitis fungus.
Keywords
Vallisneria spiralis; Wetlands; Malassezia globosa ; Fungicidal
Abbreviations
MIC: Minimum Inhibitory Concentration; MFC: Minimum Fungicidal Concentration; GAE: Gallic Acid Equivalents; QE: Quercetin Equivalent; TAE: Tannic Acid Equivalent; DPPH: 2, 2- diphenyl-1-Picrylhydrazyl; DMSO: Dimethyl Sulphoxide; FT-IR: Fourier Infra-red
Introduction
An integrative ecosystem demands biological interactions which accords for survival values amongst life. The competition between different photoautotroph [1-3] for resources in water body changes the succession of species which is otherwise an outcome of interactive secondary metabolites in progressive plant populations. Virtually, various theoretical and experimental citations have been stated decades back on the role of these metabolites not only for synthetic innovations as drug adjuvant [4,5] but also on natural ecospheres including aquatic macrophyte and their indulged impact on algal bloom and phytoplankton [6,7]. Field evidences and literature studies confer that all primary producing organisms (cyanobacteria, microand macroalgae as well as angiosperms) are capable of producing and releasing these active compounds [8]. However, utilizing there in situ exudations in outward pharmaceutical implications is a fascinating aspect and a fetch for ayurvedic sciences [9] Some Indigenous technical knowledge (ITK) and a few chemical perceptions through experimentation lead to various knowledge outsourcing to insight into the medicinal traits of many plants.
Vallisneria spiralis L. is a common submerged rooted macrophyte found in many wetlands, shallow ponds, lakes, marshes and streams of West Bengal. It is an extensively wide stretched colonizer [10-12] and the dispersal of the species can take place both through human and natural means via wind or water. Literature cites its role as appetizer, refrigerant, demulcent and women complaint (leucorrhoea) and used for stomach ache [13,14]. The plant is also found to bio remediate the tannery effluents [15]. The fact that the species is also capable of changing the pore water chemistry towards a more oxidized state [16] reveals its microbial static traits. This study aims to use the leaf leachates of Vallisneria against the most troubleshoot dermatitis fungi Malassezia globosa. The experiment was initiated with four different fractions with 0%, 40%, 80% and 100% ethanol in water but only the 80% ethanol fraction was found to show activity and in accordance to that this paper demonstrates only the data relevant to this fraction.
Materials and Methods
Collection and preparation of plant sample
The plant samples were collected from wetland water bodies of Nadia district of West Bengal, India, where the growth was intense. The plants after uprooting were washed in tap water and carried to the laboratory in sterile polypropylene and rewashed thoroughly with double distilled water, air dried and weighed in sterile bags and processed within 24 hrs of collection [17].
Extraction of bioactive compounds
Following the preparative steps, the plant leaves (7 kg fresh weight/ set; excised of roots) were completely immersed in glass jars with perforated lids in increasing ratios from 0%, 20%, 40% and 80% ethanol using milipore water. The amount of solvent added was in the ratio of 10:1 with respect to the fresh weight of the plants in each jar. The jars were kept in room temperature with sufficient sunlight initially for a span of not more than three days to prevent auto toxicity resulting into decolouration and foul odour. Around 3 sets were required to obtain desirable amount. The crude extracts of the four fractions were collected and concentrated to dryness by rota vap and subjected to the following biochemical analysis.
Biochemical assay
Phenols
The total phenolic content was determined following Folin- Ciocalteu method [16] using 0.1 ml of the extract with a concentration range of 0.05-0.3 mg/ml of the leaf leachate. The extracts were mixed with Folin-Ciocalteu reagent and Sodium carbonate (Na2CO3) following incubation for 30 mins at room temperature. The change of colour was measured in spectrophotometer with absorbance reading at 765 nm. Gallic acid in the same concentration as the sample was used as positive control. The total phenolic content was expressed as GAE in milligram per gram of dry material using the calibration curve, where X was the absorbance and Y was GAE (mg/g).
Flavonoids
Flavonoid estimation was carried out following the method of Jia et al. [18]. The preferred concentration range for the leaf leachates were 0.2-1.2 mg/ml with 0.1 ml of the extract. Later the extract was added with 1.2 ml distilled water, 0.12 ml of 5% Sodium nitrite (NaNO2) with uniform intermixing. Following incubation for 5 mins at 25°C temperatures, 0.12 ml of 10% AlCl3 solution was added and mixed thoroughly. Then the tubes were further incubated at room temperature for 5 minutes and added with 0.8 ml of 1 mM Sodium hydroxide (NaOH) solution and 1.16 ml of distilled water. The absorbance was measured at 510 nm. Methodically, quercetin in the same concentration as the sample was used as positive control. Total flavonoids content as calculated as Quercetin (mg/g) using the calibration curve, where X was the absorbance and Y was QE (mg/g).
Tannins
European Commission [19] reference method was used to determine the total tannins content using tannic acid as standard curve. Briefly, 200 μL of extracts of 0.05 – 0.3 mg/ml was mixed with 200 μL of ferric ammonium citrate (0.35%) prepared freshly and 200 μL of ammoniac (0.8%). The absorbance of the mixture was measured at 525 nm. The results were expressed as TAE mg of per gram of extracts or fractions.
Antioxidant assay
DPPH radical scavenging activity: The free radical scavenging activity of extracts and fractions for the radical DPPH was measured as described [20,21]. Freshly prepared DPPH solution (25 mg/L) in methanol was prepared and 3.9 ml of this solution was mixed with 0.1 ml of extract in methanol containing different concentration range (0.05-0.3 mg/ml conc.) of the extract. 30 minutes later, the absorbance was measured at 517 nm using Spectrophotometer. Butylated Hydroxy Toluene (BHT) in the same concentration as the sample was used as positive control. The capability to scavenge the DPPH radical was calculated using the following equation:
DPPH radical scavenging activity (%) = {Ac-At/Ac} × 100
Where Ac is the absorbance of the blank reaction and At is the absorbance in presence of the sample of the extracts.
IC50 which defines the concentration of the plant extract that’s needed to scavenge 50% of the radical present was calculated by the following equation:
IC50 = {Percentage Inhibition/Concentration of the sample} × 50
Microbiological screening
Antimicrobial activities of different extracts were evaluated by the agar well diffusion method Mayser et al. [22] modified by Murray [23] and Minimum inhibitory concentration [24-26].
Sample and Media preparation
The crude plant extracts were concentrated to dryness and resuspended in 20% DMSO [27]. A dilution range of 1000 μg/ml to 1 μg/ml was prepared with DMSO as a control. For agar well diffusion method, the fungal sample was collected from human and cultured in sabouraud agar. The minimum inhibitory concentration (MIC) and minimum fungicidal concentration (MFC) values were determined by serial broth dilution assay using sabouraud dextrose broth. All the media prepared was sterilized by autoclaving the media at (121°C) for 20 min.
Agar well diffusion method
The well diffusion method was used to determine the antifungal activity. The plates were swabbed (sterile cotton swabs) with the overnight fungal culture from sabouraud dextrose broth. Single well was in a punched in a petri plate using sterile cork borer. 100 μl of each concentrations of plant extracts were added into the wells and allowed to diffuse at room temperature for 3 hrs along with the control plates. The plates were incubated at 28°C for 36-48 hrs.
Minimal Inhibitory Concentration (MIC) and Minimal Fungal Concentration (MFC)
Broth dilution method was preferred to perform the MIC assay. The dilutions were chosen depending on the results of the well diffusion assay. The inoculum was loop transferred to 0.85% saline solution and the turbidity adjusted to 0.5 McFarland to ensure 5 × 10⁵ CFU/ml after addition to the dilution tubes. 20 μl of the inoculums was transferred from saline solution to Sabouraud dextrose broth. 5 μl of the inoculums was transferred to all the experimental tubes within fifteen minutes after transferring in the broth. The tubes were incubated in 28°C for 18 hrs and the lowest concentrations without visible growth were the MIC. The higher concentrations above to MIC were plated in sabouraud agar and incubated in 28°C for 48 hrs; the lowest concentration without any visible growth was conferred as the MFC indicating 99.5% killing of the original inoculums [28].
Purification and Instrumental Analysis
The compound was isolated by chromatographic technique and deposited for Mass and FT-IR spectrometry to confer the molecular weight and functional groups.
Results
Biochemical analysis
The results of the biochemical assay for the four different fractions are tabulated in Table 1. Since fraction 4 was found to contain considerable amount of antioxidants, phenols and flavonoids [29], further work was carried out only with fraction 4 as well the data description for fraction 4 is stated below.
| Fractions | Bio-Chemical Assay | Concentration (mg/ml) | |||||
|---|---|---|---|---|---|---|---|
| 0.05/0.2 | 0.10/0.4 | 0.15/0.6 | 0.20/0.8 | 0.25/1.0 | 0.30/1.2 | ||
| 0% ethanol | A | 0.16 | 3.24 | 7.59 | 6.01 | 11.88 | 15.43 |
| B | 0.43 | 0.68 | 1.92 | 1.28 | 2.6 | 3.77 | |
| C | 0.11 | 0.19 | 0.36 | 0.85 | 1.03 | 1.21 | |
| D | 2.53 | 6.47 | 12.58 | 10.01 | 16.01 | 20.22 | |
| 20% ethanol | A | 0.12 | 2.18 | 5.37 | 2.61 | 6.77 | 8.4 |
| B | 0.18 | 0.32 | 0.69 | 1.34 | 2.18 | 4.82 | |
| C | 0.1 | 0.39 | 0.33 | 0.46 | 0.89 | 1.06 | |
| D | 2.68 | 5.37 | 7.98 | 9.56 | 21.32 | 26.49 | |
| 40% ethanol | A | 0.18 | 3.73 | 4.51 | 4.98 | 9.85 | 15.61 |
| B | 0.1 | 0.32 | 0.38 | 0.08 | 1.06 | 3.49 | |
| C | 0.28 | 0.25 | 0.32 | 0.37 | 1.06 | 1.59 | |
| D | 1.65 | 5.29 | 9 | 9.82 | 22.91 | 25.66 | |
| 80% ethanol | A | 0.38 | 5.29 | 8.64 | 6.78 | 13.56 | 19.23 |
| B | 0.68 | 0.76 | 2.64 | 3.53 | 3.58 | 6.91 | |
| C | 0.56 | 0.58 | 0.64 | 0.49 | 1.27 | 1.88 | |
| D | 5.2 | 9.56 | 15.46 | 11.28 | 21.01 | 28.97 | |
Biochemical analysis of the four different fractions extracted from the leaves of Vallisneriaspiralis L. A- Phenols; B-Flavonoids; C-Tannins and D-Antioxidant activity. The concentrations 0.5mg/ml-3.0mg/ml are for phenols, Tannins and Antioxidant activity and 0.2mg/ml-1.2mg/ml is specific for Flavonoid assay.
Table 1: Biochemical Analysis.
Phenols
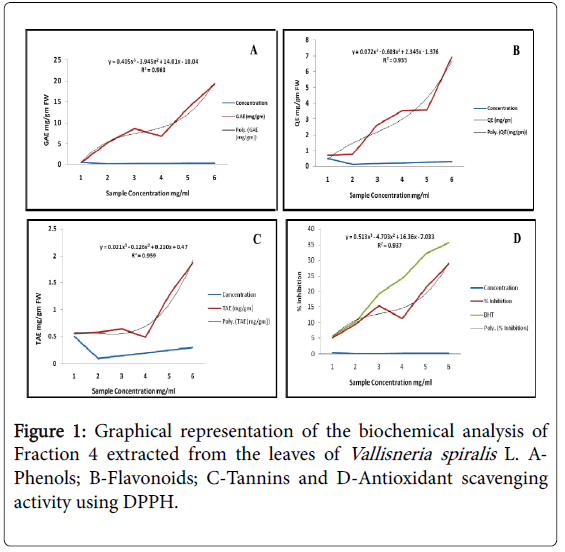
The Total Phenol Content was expressed as Gallic acid equivalents (GAE) in mg/g fresh weight. The experimental data exhibits (Figure 1A) a proportionate increase along the concentration gradient although a sudden fall at 0.2 mg/ml with 6.78 GAE mg/g and highest noted at 0.3 mg/ml with 19.23 GAE mg/g of (0.05 – 0.3 mg/ml) extracts concentration The result is validated with the coefficient of determination (R2=0.963) which reads the data as best fit along the regression line.
Flavonoids
The Total Flavonoid Content was expressed as Quercetin equivalents (QE) in mg/g fresh weight. The flavonoid content showed a consistent data (Figure 1B) evenly throughout the concentration range. It increased thoroughly with raise in concentration and 1.2 mg/ml extract had the highest flavonoid content with 6.91 mg/gm QE. Presence of flavonoid may result as alkaloids and glycosides in the plant extract. The R2 value 0.935 was found to be significant and defines the goodness of fit of the data along the regression line.
Tannins
The Tannin Content was expressed as Tannic acid equivalents (TAE) in mg/g fresh weight. The progress of the data for tannin and flavonoid was found to be quite similar by way of steady increase with concentration of the leaf extract. The highest tannin content was recorded at 0.3 mg/ml of the leaf extract with 1.88 mg/gm TAE (Figure 1C). The strength of the response variables and the model was found to be significant with R2 = 0.959.
Antioxidant assay
To determine the free radical scavenging as an index of antioxidant ability of the investigated plant extracts, DPPH assay was performed. The data followed that of the Total phenol content with a fall at 0.2 mg/ml of the extract with percent inhibition of 11.28. The highest percent inhibition of 28.97 was found for 0.3 mg/ml concentration. The co-linearity of the data trend (Figure 1D) for phenols and antioxidants reveals the fact that the active phenolics present in the plant extract are the antioxidants. The positive control BHT recorded the highest percent inhibition as 35.6 at 0.3 mg/ml concentration.
Microbial screening
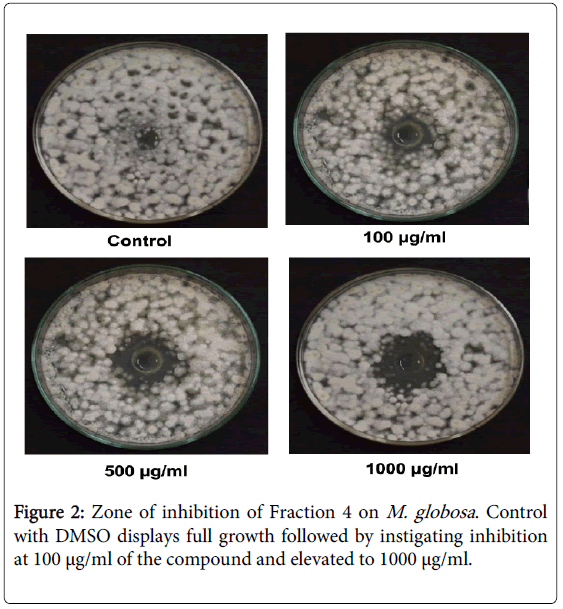
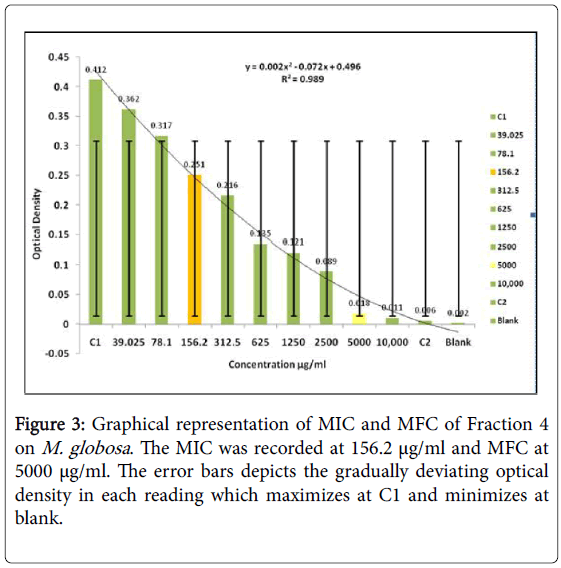
The zone of inhibition was found to initiate at 100 μg/ml but the clear zone could be seen at 500 μg/ml and 1000 μg/ml (Figure 2). No anti-fungal activity was noticed in the other four concentrations. Hence forth, eleven tubes ranging from 10000 μg/ml to 39.0625 μg/ml of the extract and two controls one without inoculum and the other without extract was maintained for experimental assurance along with 1 ml of broth in each of the tube for MIC and MFC. The optical density at 600 nm was taken for all the samples. The data tabulated below shows MIC 156.25 μg/ml (Figure 3). All the six concentrations beyond that were streaked and kept in incubator at 370°C for 24 hrs/48 hrs and the MFC was found at 5000 μg/ml.
Purification and Structure activity relationship by Mass and FT-IR spectroscopy
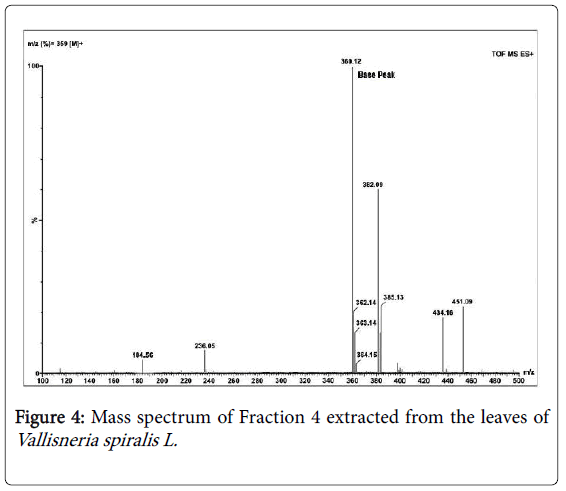
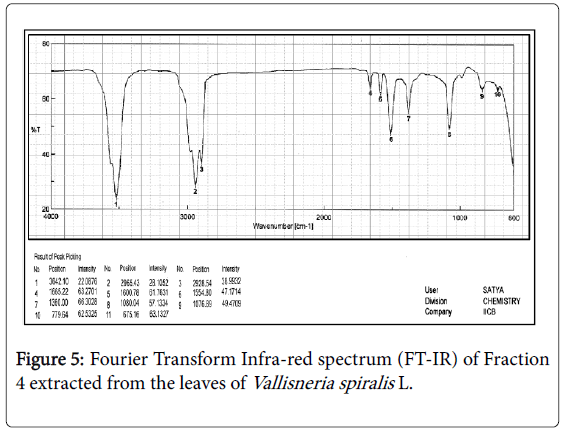
The compound was ideally isolated using solvent system of 1% methanol in ethyl acetate by column chromatography using silica gel 100-230 mesh size and obtained as crystals with chloroform: methanol washes and finally flushed with toluene. Mass spectrum [30] with Time of Flight analyzer (TOF) shows the (Figure 4) molecular weight of the isolated compound to be m/z (%) = 359 [M]+ with the base peak at 360 [M+H]+. Infra-red spectrum (Figure 5) analysis helped to sort the functional group of the active compound which is tabulated (Table 2). The absorption spectrum of the 80% ethanol fraction shows ten major bands; the band at 3642.10 cm-1 corresponds to hydroxyl group usually free hydroxyls. The other dominating bands at 1665.22 cm-1 and 1554.80 cm-1 are those of carbonyls and aromatic compounds. The presence of aromatic compound is further confirmed at 779.64 cm-1 with C-H stretching which if in case of flavonoids, corresponds to the first aromatic ring. The S=O bond usually includes compounds [31,32] which shows radical trapping antioxidant property and act as antimicrobial, antiparasitic and antitumor agents, a common example of this compound is contained in Allium sps . [33,34].
| SL No. | Peak value (cm-1) | Stretching | Inference |
|---|---|---|---|
| 1 | 3642.1 | O-H stretching | Alcohols/Phenols |
| 2 | 2965.4 | C-H stretching | Alkanes |
| 3 | 2928.5 | C-H stretching | Alkanes |
| 4 | 1665.2 | C=O stretching | C-O NH |
| 5 | 1600.8 | C=C stretching | Alkenes |
| 6 | 1554.8 | C=C stretching of aromatic ring | Aromatic Compounds |
| 7 | 1360 | S=O, sym | Sulphoxide |
| 8 | 1080 | C-O | Ethers |
| 9 | 1076.9 | C-O | Ethers |
| 10 | 779.64 | C-H stretching | Aromatics |
Structure activity relationship of the different functional groups present in the bioactive compound extracted by 80% ethanol from leaves of Vallisneriaspiralis L. by FT-IR Spectroscopy.
Table 2: FT-IR Peaks Interpretation.
Discussion
Plants have been serving us as versatile sources of our basic needs [35,36]. The art of utilising the plant associated aspects including various metabolites is intriguing and holds a great prospect in pharmaceuticals and drug crafty [37] mostly due to its nearly nullified negative impacts [38-41] However, the ecosystem that harbours the plant is a vital factor for its outsourcing to nature. Science have much studied the terrestrial ecosystem which orients soil as a resource variable and quiet easy to monitor and modify, but water being a diluting variable needs advanced techniques and resources, hence comparatively much less explored. In this paper, we have screened a rapid wetland colonizer, Vallisneria spiralis L. for antifungal traits against dandruff dermitis following its uses as refrigent and skin lesions. The fourth fraction (80% ethanol) was assayed for possible biochemical evaluation and interestingly displayed a co-linearity in peaks for phenol and antioxidants which confirms that the antioxidant compound is phenolic in nature [42]. Further it was found to be antifungal against M. globosa initiating at 100 μg/ml and showed highly remarkable zone of inhibition at 1000 μg/ml and the minimum fungicidal concentration was observed at 5000 μg/ml. The compound was crystalline in nature with molecular weight m/z (%) = 359 [M]+. The FT-IR Spectrum depicts phenols, carbonyls, aromatics, sulphoxides and alcohols as major functional groups [43,44] of the structure which are antifungal [45,46] or mostly antimicrobial [47] and shows prospective research in herbal drug analysis. The structure contains a polyphenolic group. Most antioxidants isolated from medicinal plants are polyphenols [48-50] which show biological activities include anti-bacterial, anti-inflammatory, anti-obesity, antiviral, anti-carcinogenic and immune stimulating effect. Additively, the S=O group of the compound is one of the major antioxidant imparting factor [51,52] and lysis of microbial cell wall integrity.
The concise attempt to utilize the aquatic macrophyte as an antidandruff source provides a platform for research with wetland colonizers in an innovative aspect. Further research with NMR spectroscopy is required for demonstration the chemical structure of the compound.
Acknowledgement
I am awfully thankful to the Department of Science and Technology (DST) Women Scientist Scheme (WOS-A), Govt. of India, for the complete funding of the research work. My heartiest acknowledgement to ICAR-Central Inland Fisheries Research Institute (CIFRI) and Department of Aquaculture Management and Technology (AMT), Vidyasagar University, for guidance and laboratory facilities. I would also like to thank Indian Institute of Chemical Biology (IICB) for instrumental analysis and finally Prosanta Chakraborty, Netaji Nagar Day College, Regent Estate, Kolkata who helped me in elucidating the spectrum datas.
References
- Rahman AHMM, Rafiul Islam AKM, Naderuzzaman AKM, Hossain MD, Rowshatul A (2007) Studies on the aquatic angiosperms of the Rajshahi University campus. Res J Agri and BiolSci 3: 474-480.
- Dewanji A (1993) Aminoacid composition of leaf proteins extracted from some aquatic weeds. J Agric Food Chem 41:1232-1236.
- Mendoza, VB (1980) Katurai: a plant of many uses. Canopy International 12-13.
- Ayethan WM, Sein MM, Maybwin M (1996) The effects of some medicinal plants on smooth muscle. ”, AB Abstract 1970-1979.
- Thakare VM, Chaudhari RY, Patil VR (2011) Promotion of cutaneous wound healing by herbal formulation containing Azadirachtaindica and Cynodondactalon extract in wistar rats. Int J Pharm Res Dev 34: 80 – 86.
- Lundholm N, Hansen PJ, Kotaki Y (2005) Lack of allelopathic effects of the domoic acid-producing marine diatom Pseudo-nitzschiamultiseries. Mar EcolProgSer 288: 21-33.
- Wium-Andersen S, Anthoni U, ChristophersenHouen G (1982) Allelopathic effects on phytoplankton by substances isolated from aquatic macrophytes (Charales). Oikos 39: 187–190.
- Elisabeth MG (2003) Allelopathy of Aquatic Autotrophs. Critical Reviews in Plant Sciences 22: 313-339.
- Anjaria J, Parabia M, Dwivedi S (2002) Ethnoveterinary heritage Indian ethnoveterinary medicine-an overview, Ahmedabad, India:Pathik enterprise 223.
- Wichitnithad W, Jongaroonngamsang N, Pummangura S, Rojsitthisak P (2009) A simple isocratic HPLC method for the simultaneous determination of curcuminoids in commercial turmeric extracts. Phytochem Anal 20: 314-319.
- Bowmer KH, Jacobs SWL, Sainty GR (1995) Identification, biology and management of Elodea canadensis, Hydrocharitaceae. Journal of Aquatic Plant Management 33: 13-19.
- Champion PD, Clayton JS (2000) Border control for potential aquatic weeds. Stage 1 - weed risk model.
- Chopra RN, Nayar SI, Chopra IC (1986) Glossary of Indian Medicinal plants.
- Vajpayee P1, Rai UN, Ali MB, Tripathi RD, Yadav V, et al. (2001) Chromium-induced physiologic changes in Vallisneriaspiralis L. and its role in phytoremediation of tannery effluent. Bull Environ ContamToxicol 67: 246-256.
- Collas FPL, Beringen R, Koopman KR, Matthews J, Odé B, et al., (2012) Knowledge document for risk analysis of the non-native Tapegrass (Vallisneriaspiralis) in the Netherlands. Series of Reports on Environmental Science.
- Singleton VL, Rossi JA (1965) Colorimetry of total phenolics with phosphomolybdic-phosphotungstic acid reagents. Am J EnolViticul 16: 144-158.
- Antony MB (2003) Indigenous Medicinal Plants: their extracts and isolates as a value added export product. Journal Agro bios 1:39-41.
- Jia ZS, Tang MC, Wu JM (1999) The determination of flavonoid contents in mulberry and their scavenging effects on superoxide radicals. Food Chem 64: 555-559.
- Européenne Commission (2000) Procédures de prises en charge de cereals par les organismesd’interventionainsique les methodesd’analyses pour la determination de la qualité. J. OfficielCommunautésEur 824: 20.
- Blois MS (1958) Antioxidant determinations by the use of a stable free radical. Nature 26: 1199-1200.
- Schofield JJ (1989) Discovering wild plants, Alaska, Western Canada, the Northwest, Alaska Northwest Books, G.T Discovery Publications, Inc., 22023 20th Ave. S.E.Bothell, WA98021: 22.
- Boekhout T, Guého-Kellermann E, Mayser P, Velegrak A (2010) Malassezia and the Skin: Science and Clinical Practice, Springer Science andBusiness Media, Medical - 319.
- Murray PR, Baron EJ, Pfaller MA, Tenover FC, Yolken HR (1995) Manual of Clinical Microbiology, (6thedn), ASM Press, Washington DC 15-18.
- Olurinola PF (1996) A laboratory manual of pharmaceutical microbiology, Idu, Abuja, Nigeria 69-105.
- Chea A, Jonville MC, Bun SS, Laget M, Elias R, et al. (2007) In vitro antimicrobial activity of plants used in Cambodian traditional medicine. Am J Chin Med 35: 867-873.
- Khare CP (2007) Indian medicinal plants: an Illustrated dictionary, Berlin, Heidelberg:Springer 667 .
- Akinyemi KO, Oladapo O, Okwara CE, Ibe CC, Fasure KA (2005) Screening of crude extracts of six medicinal plants used in South-West Nigerian unorthodox medicine for anti-methicillin resistant Staphylococcus aureus activity. BMC Complement Altern Med 5: 6.
- Coulidiati TH, Millogo-Kone H, Lamien-Meda A, Yougbare-Ziebrou M, Millogo-Rasolodimby, et al. (2011) Antioxidant and Antibacterial Activities of Two Combretum Species from Burkina Faso. Research Journal of Medicinal Plant 5: 42-53.
- Peret-Almeida L, Cherubino, Alves RJ (2005) Separation and determination of the physico-chemical characteristics of curcumin, demethoxycurcumin, bisdemethoxycurcumin. Food Research International 38: 1039-1044.
- Vulfson NS, Zaikin VG (1976) Mass spectrometry of quinolizidine alkaloids. Russ Chem Rev 45:959.
- Lynett PT, Butts K, Vaidya V, Garrett GE, Pratt DA (2011) The mechanism of radical-trapping antioxidant activity of plant-derived thiosulfinates. Org BiomolChem 9: 3320-3330.
- Kim S, Kubec R, Musah RA (2006) Antibacterial and antifungal activity of sulfur-containing compounds from Petiveriaalliacea L. J Ethnopharmacol 104: 188-192.
- Akujobi C O, Anyanwu BN, Onyeze GC, Ibekwe VI (2004) Antibacterial activities and preliminary Phytochemical screening of four medicinal plants. Journal of Applied Sciences 7: 2328 4338.
- Anon (2005) The use of Euphorbia hirta in the treatment of sores, boils, and wounds.
- Kumar A, Rani NS, Sagwal S (2012) An Absolute Review on Oxalis corniculata Linn. International Journal of Research in Pharmaceutical and Biomedical Science 3:1173-1188.
- Ray S, Nagaiah K, Khan FN (2011) NSHM Journal of Pharmacy and Healthcare Management 02: 83-88.
- Simeón S, Ríos JL, Villar A (1990) Antimicrobial activity of Annonacherimolia stem bark alkaloids. Pharmazie 45: 442-443.
- Chika CO, Jide NO, Beatrice NA (2007) Effect of ethanolic and boiling water extracts of barks and leaves of Uvariachamae on some hospital isolate. American Journal of Sciences 3 : 68-73.
- Duke JA, Ayensu ES(1985). Medicinal plants of China, Reference Publications, Inc., ISBN 0-917256-20-4.
- Salgueiro LR Pinto E, Gonçalves MJ, Pina-Vaz C, Cavaleiro C, et al. (2004) Chemical composition and antifungal activity of the essential oil of Thymbracapitata. Planta Med 70: 572-575.
- Husain A (1992) Dictionary of Indian Medicinal Plants, Central Institute of Medicinal and Aromatic Plants.
- Brader G, Bacher M, Hofer O, Greger H (1997) Prenylatedphenylpropenes from Coleonemapulchellum with antimicrobial activity. Phytochemistry 45: 1207-1212.
- Hili P, Evans CS, Veness RG (1997) Antimicrobial action of essential oils: the effect of dimethylsulphoxide on the activity of cinnamon oil. LettApplMicrobiol 24: 269-275.
- Hosni K, Msaâda K, Ben TM, Ouchikh O, Kallel M, Marzouk B (2008) Essential oil composition of Hypericumperfoliatum L. and Hypericumtomentosum L. growing wild in Tunisia. Industrial Crops and Products 27(3):308-314.
- Bandara BM, Hewage CM, Karunaratne V, Wannigama CP,Adikaram NK (1992). An antifungal chromene from Eupatorium riparium, Phytochemistry 31: 1983–1985.
- Bautista SL, Barrera NL, Bravo LK,Bermúdez T (2002). Antifungal activity of leaf and stem extracts from various plant species on the incidente of Colletotrichumgloeosporioides of papaya and mango fruits after storage, Rev. Mex. Fitopatol 20: 8-12.
- Baumgartner B, Erdelmeier CA, Wright AD, Ralli T, Sticher O (1990) An antimicrobial alkaloid from Ficusseptica. Phytochemistry 29: 3327-3330.
- Schultz TP, Boldin WD, Fisher TH, Nicholas DD, Murtrey KD, Pobanz K (1992) Structure– fungicidal properties of some 3- and 4-hydroxylated stilbenes and bibenzyl analogues. Phytochemestry 31: 3801-3806.
- Sepúlveda JG, Porta DH, Rocha SM (2003) La participación de los metabolitossecundarios en la defensa de lasplantas, Rev. Mex. Fitopatol 21: 355-363.
- Mandal S, Nayak A, Kar M, Banerjee SK, Das A, et al. (2010) Antidiarrhoeal activity of carbazole alkaloids from MurrayakoenigiiSpreng (Rutaceae) seeds. Fitoterapia 81: 72-74.
- Matsui T, Tanaka T, Amura S, Toshima A, Miyata Y, et al. (2007) α-glucosidase inhibitory profile of catechins and theaflavins. Journal of Agricultural and Food Chemistry 55: 99-105.
- Burits M, Bucar F (2000) Antioxidant activity of Nigella sativa essential oil. Phytother Res 14: 323-328.
Relevant Topics
- Aquatic Ecosystems
- Biodiversity
- Conservation Biology
- Coral Reef Ecology
- Distribution Aggregation
- Ecology and Migration of Animal
- Ecosystem Service
- Ecosystem-Level Measuring
- Endangered Species
- Environmental Tourism
- Forest Biome
- Lake Circulation
- Leaf Morphology
- Marine Conservation
- Marine Ecosystems
- Phytoplankton Abundance
- Population Dyanamics
- Semiarid Ecosystem Soil Properties
- Spatial Distribution
- Species Composition
- Species Rarity
- Sustainability Dynamics
- Sustainable Forest Management
- Tropical Aquaculture
- Tropical Ecosystems
Recommended Journals
Article Tools
Article Usage
- Total views: 11829
- [From(publication date):
December-2015 - Sep 25, 2024] - Breakdown by view type
- HTML page views : 11088
- PDF downloads : 741

