Application of Isotopic Signature of Atmospheric Vapor for Identifying the Source of Air Moisture-An Example from Roorkee, Uttarakhand, India
Received: 01-Oct-2012 / Accepted Date: 19-Nov-2012 / Published Date: 22-Nov-2012 DOI: 10.4172/2157-7617.1000126
Abstract
In the present study, the isotopic signature of atmospheric vapor/precipitation is used to identify the source of air moisture at Roorkee, Uttarakhand, India. The interpretation of the isotope data of atmospheric vapor for the years 2008-09 indicates that the seasonality effect divides the entire data spectrum into three sub-units as: monsoon water vapor (δ18O<-25, δD<-126) of Bay of Bengal (BoB)/oceanic origin are the most depleted; the most enriched vapors (δ18O>-5, δD>-6) of local origin and the vapors originating due to Western Disturbances (WD) have values (δ18O ~-15, δD~-53) between these two sources. The monsoon showers are isotopically the most depleted with the highest slope (7.78) of its characteristic line followed by winter rains which are marginally enriched. The pre-monsoon showers are the most enriched rains in the year. With these systematic it can be easily differentiated between premonsoon and monsoon rains and in identifying the true monsoon rains or onset of monsoon.
Keywords: Hydrology; Water cycle; Atmospheric vapour; Stable isotopes; Arabian Sea; Bay of Bengal; Mediterranean Sea
8786Introduction
Stable isotope hydrology received a big boost with the identification of the co-variance of hydrogen and oxygen isotopes in precipitation first by Friedman, 1953 [1] and later in the form of GMWL by Craig, 1961 [2]. A continental effect from as large as 45‰ per 100 km in δD on North coast of California to as little as 2‰ across the Great Basin in Northern Nevada was observed [3]. Values of elevation effect have been reported to be approximately 40‰ in δD per 1000m increase on the west slope of the Sierra Nevada [4]. Dansgaard, 1964 [5] reported a good world-wide correlation for coastal and polar stations between mean δD and δ18O values of precipitation and the mean annual air temperature (MAAT) with an average decrease of >5.6‰ for δD and 0.7‰ for δ18O per degree Celsius. These observed variations are consistent with temperature dependence of equilibrium fractionation factor again indicating that condensation is an equilibrium process. The precipitation progressively decrease from 18O values between -2 ‰ to -4 ‰ [6].
The monsoon is a large scale wind circulation phenomenon that brings large amount of moisture on the Indian sub-continent during the period mid June to September. Earlier studies on monsoon dynamics mainly dealt with deviation of total precipitation from the normal, spatial variability in precipitation, extreme events and timing of onset of monsoon [7-9]. Most of these studies relied on conventional meteorological parameters such as temperature (Continental and sea surface), relative humidity, wind speed, wind direction, cloud pattern etc. However, sufficient accuracy in onset of monsoon, its dynamics on the continent and the timing of its withdrawal is not well understood. The complexity of the phenomenon is due to link between mixing of sub-regional moisture with continental scale moisture arising directly from Arabian Sea and/or Bay of Bengal and/or Indian Ocean. Using the isotopic signatures of water molecules, it is possible to track the movement of air moisture. This is due to fact that with the onward movement of the air moisture heavy isotopes get systematically depleted and the recycling of moisture due to condensation and subsequent evaporation cause a difference in relative enrichment in deuterium and oxygen isotopic composition.
In India, the Southwest (SW) monsoon begins from Lakshadweep, Minicoy and Kerala [10,11] and it enters North India from Arabian Sea and Bay of Bengal. During the winter and springs, Northeast (NE) monsoon is prevalent in the Southeast (SE) parts of India, while the north and Northwest (NW) part of the country receives rains due to the Western Disturbances [10-14]. Thus the sources of precipitation/atmospheric vapor in India are mainly Arabian Sea and Bay of Bengal in Monsoon season. But during non-monsoon seasons the sources of precipitation/atmospheric vapor are local/regional derived vapors.
The stable isotopes of oxygen and hydrogen (18O and 2H) can be used for tracking the sources of atmospheric vapor/precipitation due to the systematic mass-dependant partitioning of the three isotopomers 1H1H16O, 1H2H16O and 1H1H18O among solid, liquid and gaseous phases as water passes through the hydrological cycle.
The studies [15-21] were carried out in different parts of the World on the isotope data of surface vapor have a limited data and is not sufficient to adequately explain the isotopic composition of atmospheric water vapor. No attempt has been made so far to identify the source of atmospheric vapor/precipitation at Roorkee, Uttarakhand, India using isotopic signature.
Therefore, the present study is carried out for identifying the sources of atmospheric vapor/precipitation at Roorkee using the isotopic signatures and the isotopic data has also been correlated with the wind trajectory and satellite data obtained from India Meteorological Department, New Delhi to establish the similarities among these.
Study area
The studies were carried out in the National Institute of Hydrology, Roorkee (Uttarakhand), India. The study area falls under latitude 29°52’, longitude 77°53’ and altitude 268 m. The meteorological parameters of Roorkee are: normal rainfall is 1156.4 mm per annum; the monthly average maximum temperature is 28.8°C; monthly average minimum temperature is 15.5°C; average relative humidity is 78%.
Materials and Methods
Air moisture sample collection
The condensed atmospheric vapour/ground level vapour (GLV) samples for isotopic analysis are collected (2008-09) daily from 9.30 am to 11.00 am at Roorkee, Uttarakhand, India by condensation method. The parts used in this methods are shown in Figure 1 [22-23].
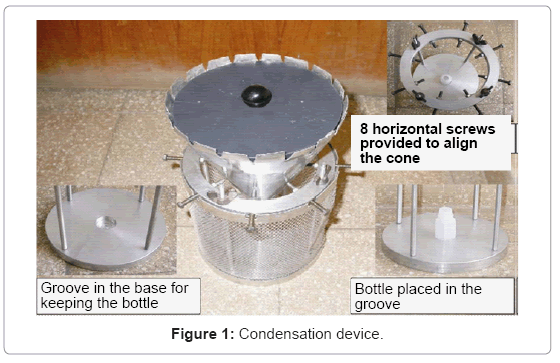
Figure 1: Condensation device.
Rain sample collection
For rainwater a specially designed sampling system developed by the International Atomic Energy Agency (IAEA) is used to collect rain water samples on event basis. The system ensures amount weighing and negligible post-precipitation evaporation of the collected sample during the interval between rainfall and collection. The date and time, and temperature and relative humidity are recorded [24].
Sample analysis
The isotopes in GLV were analyzed using GV-Isoprime Dual Inlet Isotope Ratio Mass Spectrometer (Figure 2) [25].
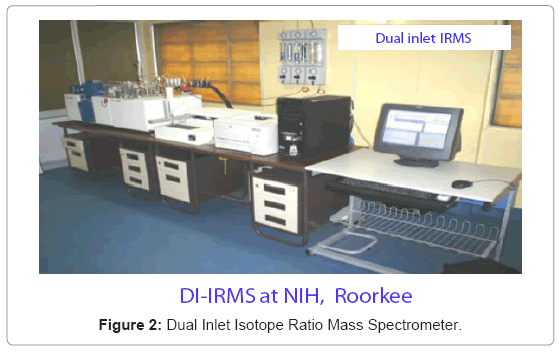
Figure 2: Dual Inlet Isotope Ratio Mass Spectrometer.
Results and Discussion
Identifying dominant sources of seasonal vapour influx to India is vital to improve understanding of (i) continental-scale hydrological circulation and (ii) land- ocean-atmosphere interaction as Indian monsoon is an important component of global atmosphere circulation and source of all important water resources in India.
Isotope characterization of source of GLV
The interpretation of the isotope data of GLV for the years 2008- 09 indicates that the seasonality effect divides the entire data spectrum into three sub-units as: monsoon water vapour (δ18O<-25, δD<-126) of Bay of Bengal (BoB)/oceanic origin are the most depleted; the most enriched vapours (δ18O>-5, δD>-6) of local origin and the vapours originating due to Western Disturbances (WD) have values (δ18O~- 15, δD~-53) between these two sources. The minor depletion in the isotopic composition of water vapour in the February-May period is due to insurgent of moist air as a result of Western Disturbances [10]. However, this disappears after May, with the arrival and masking by strong monsoon winds from BoB. Between July to September, the atmosphere is pre-dominantly occupied by the monsoon vapours. After September, with the departure of monsoon, the isotopic composition of atmosphere gradually regains its local moisture source value (δ18O>-5, δD>-6). The cycle then repeats again for the next year. The depletion in the isotopic composition of air moisture provides date of onset of monsoon. Any time during this cycle, the relative proportion of local moisture to regional inflow moisture can be estimated from the relative contribution from the end member source composition (Monsoonal: (δ18O~-25, δD~-126); Local (δ18O~-5, δD~-6). The isotopic characteristic of end member sources and the general isotopic characteristic due to admixture of these two sources are shown in the Figure 3.
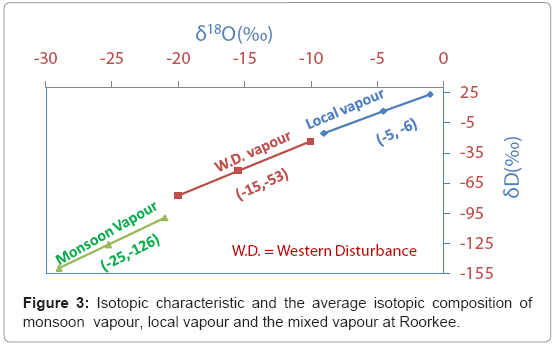
Figure 3: Isotopic characteristic and the average isotopic composition of monsoon vapour, local vapour and the mixed vapour at Roorkee.
Monsoon vapour: δD=6.29δ18O+32.80; R2=0.88
Local vapour: δD=4.83δ18O+28.17; R2=0.80
W.D. vapour: δD=5.38δ18O+30.38; R2=0.73
Isotope characterization of precipitation
Uttarakhand receives 81% of its rain from the SW monsoon, spread over the period from mid of June to mid of October. Of the total 19% remaining, about 15% is received in almost equal distribution in the months January, February, March and May and remaining 4% as occasional rains during December and April. The premonsoon rains (March to 1st week of June) are considered to be due to Western Disturbances. Depending on the source of moisture and the meteorological parameters it is expected that these rains may differ in their isotopic characteristic. In order to evaluate this, the isotopic data on rainfall collected over the period 2008-2009 are divided and separated into three periods as; monsoon (mid of June to mid of October, Winter rains (December to February) and pre-monsoon showers (March to 1st Week of May). The isotopic data spread over these three periods and their systematics is shown in the Figure 4.
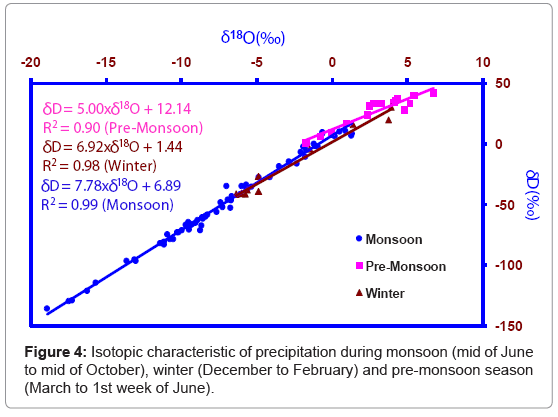
Figure 4: Isotopic characteristic of precipitation during monsoon (mid of June to mid of October), winter (December to February) and pre-monsoon season (March to 1st week of June).
From the Figure 4, it can be seen that the monsoon showers are isotopically the most depleted with the highest slope (7.78) of its characteristic line followed by winter rains which are marginally enriched (Table 1). The pre-monsoon showers are the most enriched rains in the year. With these systematic it can be easily differentiated between pre-monsoon and monsoon rains and in identifying the true monsoon rains or onset of monsoon. The isotopic results on the atmospheric moisture and rains also indicate that the delay in monsoon or drought can be observed from the enriched isotopic composition of rain and atmospheric moisture and that the system comes down the depleted levels due to monsoon showers [6].
| Vapor source | Air moisture | Rain |
| Monsoon | δD=6.29δ18O + 32.80; R2=0.88, n=110 | δD=7.78δ18O + 6.89; R2=0.99, n=42 |
| Western Disturbance (WD) | δD=5.38δ18O + 30.38; R2=0.73, n=102 | δD=6.92δ18O + 1.44; R2=0.98, n=12 |
| Local | δD=4.83δ18O + 28.17; R2=0.80, n=105 | δD=5.00δ18O + 12.14; R2=0.90, n=16 |
Table 1: Isotopic characterization of air moisture and rain.
Isotope and wind trajectory
The wind trajectory data can be used for interpreting the isotopic data of the GLV. The wind trajectory was selected on the basis of the highest depletion and the enrichment in the isotopic composition during a time spectrum analysis. Due to the Westerlies wind source (Figures 5a, 5c and 5f), the isotopic data of GLV starts depleting from δ18O= -8.39‰ (Figure 5a) to δ18O=-12.20‰ (Figure 5c) and it further depletes to a maximum of δ18O= -14.71‰ (Figure 5f) from June to September. Similarly, the same trend is observed in the winds coming from the Arabian Sea, where the isotopic valuesof δ18O depletes from -24.67‰ (Figure 5b) to -7.79 ‰ (Figure 5e). This is due to the Seasonal effect [10].
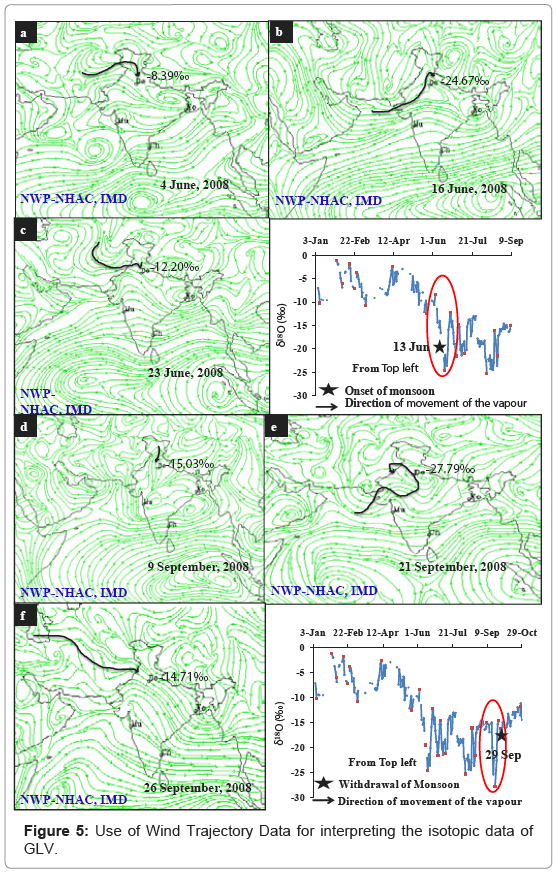
Figure 5: Use of Wind Trajectory Data for interpreting the isotopic data of GLV.
Isotope, wind trajectory and water vapour data
The isotope data was correlated with the wind trajectory and water vapour data (Figure 6). The atmospheric vapour/air moisture from the local/regional source is enriched (δ18O= -11.18‰; Figure 6a) as compared to atmospheric vapour/air moisture originating from Arabian Sea & Bay of Bengal (δ18O= -18.94‰; Figure 6b). This is due to the Continental effect [10].
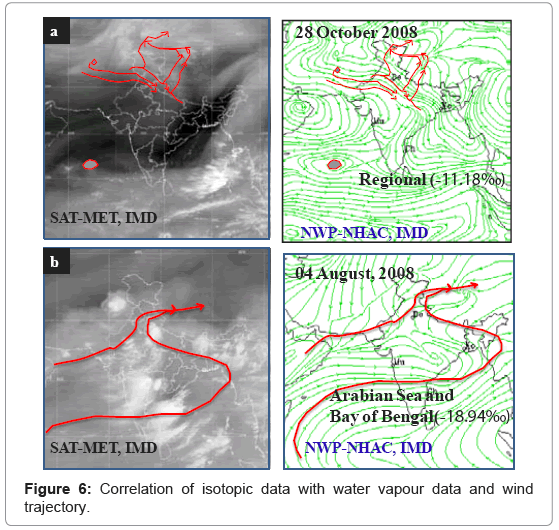
Figure 6: Correlation of isotopic data with water vapour data and wind trajectory.
Summary and Conclusions
The variations in the isotopic values of δ18O of atmospheric air moisture during the different seasons of the year indicate the different sources of atmospheric air moisture. The interpretation of the isotope data of GLV for the years 2008-09 indicates that the seasonality effect divides the entire data spectrum into three sub-units as: monsoon water vapour (δ18O<-25, δD<-126) of Bay of Bengal (BoB)/oceanic origin are the most depleted; the most enriched vapours (δ18O>-5, δD>-6) of local origin and the vapours originating due to Western Disturbances (WD) have values (δ18O~-15, δD~-53) between these two sources. The minor depletion in the isotopic composition of water vapour in the February-May period is due to insurgent of moist air as a result of Western Disturbances. The isotopic results on the atmospheric moisture and rains also indicate that the delay in monsoon or drought can be observed from the enriched isotopic composition of rain and atmospheric moisture and that the system comes down the depleted levels due to monsoon showers. However, the sources of the vapour can be more clearly understood by using the wind trajectory data or the Kalpana satellite water vapour data.
Isotopic signatures of GLV can be used to distinguish the source of atmospheric moisture as well as to estimate the contribution of the monsoonal and local vapours. With further analysis in future, semi-quantitative estimation of air-moisture flux transport can be provided. The proposed isotopic investigations are specially designed to understand such land-ocean-atmosphere interactions a Department of Science and Technology, New Delhi sponsored national programme entitled “National Programme on Isotope Fingerprinting of Waters of India (IWIN)” is being carried out by 14 institutes/organizations including National Institute of Hydrology, Roorkee with the main objectives, to study the components of the local and regional hydrological cycles, their seasonal evolution, interactions between the various components and controls exercised by geographic factors and climatic forcing. This programme is considered vital for predicting the consequences of the impending engineered modification of the hydrological cycle of the country necessitated by increase in population and the need to rapidly develop and exploit the water resources of the country on a massive scale.
While this study will generate considerable new knowledge/ information/data, its importance lies in how best this new data could be advantageously used to facilitate water resource development and management of the country more efficiently particularly for irrigation. The increasing water vapor content of the atmosphere, particularly during non-monsoon months will also affect the hydrological cycle. In this context, the data collected or generated during the study could form a baseline against which it will be possible to monitor the impacts of anthropogenic interventions on local/regional hydrological cycle at later date.
Acknowledgements
The work was carried out under the project “National Programme on Isotope Fingerprinting of Waters of India” and authors are thankful to DST-SERC (Funded by DST vide IR/54/ESF/05-2004 dated July 17, 2007) for sponsoring the study. Authors thank Director, National Institute of Hydrology for constant support and encouragement. Authors are also thankful to the unknown reviewers for their valuable and constructive comments. The wind trajectory data received from NHAC-NWP, IMD-Delhi and satellite data from Satellite Meteorology Department, IMD, New Delhi is also duly acknowledged.
References
- Friedman I (1953) Deuterium Content of Natural Waters and Other Substances. Geochim et Cosmochim Acta4: 89-103.
- Craig H (1961) Isotope Variations in Meteoric Waters. Science133: 1702-1703.
- Ingram NL, Taylor BE (1991) Light stable systematics of large scale hydrologic regimes in California and Navada. Water Resour Res 27: 77-90.
- Friedman I, Smith GI (1970) Deuterium Content of Snow Cores from Sierra Nevada Area. Science 169: 467-470.
- Dansgaard W (1964) Stable Isotopes in Precipitation. Tellus 16: 436-438.
- Gupta SK, Deshpande RD (2003) Synoptic hydrology of India from the data of isotopes in precipitation. Curr Sci 85: 1591-1595.
- AjayaMohan RS, Goswami BN (2003) Potential Predictability of the Asian Summer Monsoon on Monthly and Seasonal Time Scales. Meteorology Atmosphere Physics 84: 83-100.
- Gadgil S, Sajani S (1998) Monsoon precipitation in the AMIP runs. Cli Dyna 14: 659-689.
- Shukla J (1987) Interannual variability of monsoon, in Monsoons, edited by Fein JS and Stephens PL, Wiley and Sons, New York, pp. 399-464.
- Krishan Gopal, Rao MS, Kumar Bhishm (2012) Identification of source of atmospheric vapour using isotopic signature of air moisture at Roorkee, Uttarakhand, India. In: Proceedings of an International conference on “Opportunities and Challenges in Monsoon Prediction in a Changing Climate" (OCHAMP-2012), India, 2012.
- Gupta SK, Deshpande RD (2005) The Need and Potential Applications of a Network for Monitoring of Isotopes in Waters of India.Curr Sci88: 107-118.
- Deshpande RD, Gupta SK (2008) National programme on isotope fingerprinting of waters of India (IWIN). In Glimpses of Geosciences Research in India, the Indian port to IUGS Indian National Science Academy, Singhvi, A. K., Bhattacharya, A, Guha, S. (eds). Indian National Science Academy: New Delhi, 10-16.
- Krishan G, Rao MS, Bhishm K (2012) Study of climatological conditions using isotopic signature of air moisture at Roorkee, Uttarakhand, India. In: Proceedings of an International conference “India Water Week 2012-Water Energy and Food Security: Call for Solutions" (IWW-2012), India.
- Krishan G, Rao MS, Jaiswal RK, Bhishm K (2012) Observation of monsoon dynamics between Roorkee and Sagar using isotopic techniques. In: Proceedings of a National Seminar on “Application of isotopes & radiation technology for societal benefits (AIRTS-2012)â€, India, 2012.
- Tian L, Ma L, Yu W, Liu Z, Yin C, et al. (2008) Seasonal variations of stable isotope in precipitation and moisture transport at Yushu, eastern Tibetan Plateau. Sci China Ser D 51: 1121-1128.
- Angert A, Lee JE, Yakir D (2008) Seasonal variations in the isotopic composition of near-surface water vapor in the eastern Mediterranean. Tellus 60: 674-684.
- Araguas-Araguas L, Froehlich K, Rozanski K (2000) Deuterium and oxygen-18 isotope composition of precipitation and atmospheric moisture. Hydrol Process 14: 1341-1355.
- Gat JR (1996) Oxygen and hydrogen isotopes in the hydrologic cycles. Annu Rev Earth Planet Sci 24: 225-262.
- Gat JR, Klein B, Kushnir Y, Roether W, Wernli H (2003) Isotope composition of air moisture over the Mediterranean Sea: an index of the air-sea interaction pattern. Tellus 55: 953-965.
- Jacob H, Sonntag C (1991) An 8-year record of the seasonal variation of 2H and 18O in atmospheric water vapor and precipitation at Heidelberg, Germany. Tellus 43: 291-300.
- White JWC, Gedzelman SD (1984) The isotope composition of atmospheric water vapor and the concurrent meteorological conditions. J Geophys Res89: 4937-4939
- Krishnan G, Rao MS, Bhishm K (2011) Instruments for measurement of isotopic composition of air moisture. In: Proceedings of NSI-36, India.
- Krishan G, Rao MS, Bhishm K (2011) Instrumentation for measurement of isotopic composition of air moisture. J Instru Soc India 41: 217-220.
- Coplen TB (1996) New guidelines for reporting stable hydrogen, carbon, and oxygen isotope-ratio data. Geochim Cosmochim Acta 60: 3359-3360.
Citation: Krishan G, Rao MS, Kumar B (2012) Application of Isotopic Signature of Atmospheric Vapor for Identifying the Source of Air Moisture-An Example from Roorkee, Uttarakhand, India. J Earth Sci Climate Change 3: 126. DOI: 10.4172/2157-7617.1000126
Copyright: ©2012 Krishan G, et al. This is an open-access article distributed under the terms of the Creative Commons Attribution License, which permits unrestricted use, distribution, and reproduction in any medium, provided the original author and source are credited.
Select your language of interest to view the total content in your interested language
Share This Article
Recommended Journals
Open Access Journals
Article Tools
Article Usage
- Total views: 16324
- [From(publication date): 11-2012 - Dec 20, 2025]
- Breakdown by view type
- HTML page views: 11390
- PDF downloads: 4934