A Flexible Compartment Model for Simulation Specific to COVID-19
Received: 08-Jul-2022 / Manuscript No. JIDT-22-68893 / Editor assigned: 11-Jul-2022 / PreQC No. JIDT-22-68893 (PQ) / Reviewed: 26-Jul-2022 / QC No. JIDT-22-68893 / Revised: 02-Aug-2022 / Manuscript No. JIDT-22-68893 (R) / Published Date: 09-Aug-2022
Abstract
The dynamic relation among ‘Susceptible’, ‘Infected’, ‘Removed (Recovered)’, ‘Death’ and others for COVID-19 disease is a kind of multibody problem. It has been simulated mainly by compartment models, of which the representative is the SIR model. For the SIR model, ‘Infected’ infects ‘Susceptible’ through the recovery period, and ‘Infected’ is removed as ‘Removed’ not only from the disease but also from the community after the recovery period is ended. For COVID-19, however, the infected individuals should be isolated from the community when they become symptomatic after the latent period is ended. Thus, the infected individuals do not infect susceptible individuals in the community after the latent period, even during the recovery period. Additionally, the infection has occurred in the community even during the latent period before the infected individuals are isolated due to being symptomatic. These two facts for COVID-19 suggest that the simulation by the SIR model would be less accurate in calculating the number of infected individuals and that the results might mislead political and medical interventions. For the model proposed here, the infected individuals are isolated from the community when they become symptomatic after the latent period is ended, but the recovered individuals who have medically recovered and have immunity return to the community, and the infection occurs even during the latent period. The model shows remarkably different results from those simulated by the SIR model. The model also provides the processes evaluating the political and social countermeasures against COVID-19.
Keywords: Breakthrough infection; COVID-19; Herd immunity; Infection during latent period; SIR model; Vaccination
Introduction
The dynamic relation among ‘Susceptible’, ‘Infected’, ‘Removed (Recovered)’, ‘Death’ and others for COVID-19 disease is a kind of multibody problem. It has been simulated mainly by the compartment models of which representative are the SIR model consisting of ‘Susceptible’, ‘Infected’ and ‘Removed’. For the SIR model, since the ‘Removed’ is removed not only from the disease but also from the community, the ‘Infected’ contacts only the ‘Susceptible’. However, in the real community, most of the removed individuals return to the community after the recovery period is ended. Thus, the infected individuals contact not only the susceptible individuals but also the recovered individuals, inducing a reduction in the contact rate between the infected individuals and susceptible individuals. Additionally, for the SIR model, the infection is continued through the recovery period. For COVID-19, however, the infected individuals should be isolated from the community when they become symptomatic after the latent period is ended. Thus, infected individuals do not infect susceptible individuals after the latent period, even during the recovery period. The infection indeed has occurred and spread in the community even during the latent period before the infected individuals are isolated due to being symptomatic.
These two facts for COVID-19 suggest that the simulation by the SIR model would be less accurate in calculation for the number of infected individuals and that the results might mislead political and medical interventions. In such circumstances, the concept and method of the SIR model, which is a fundamental compartment model and has been commonly used for simulation predicting the changes in the number of infected individuals, should be re-examined. Considering the characteristics of COVID-19, a new model specific to COVID-19 should be established.
For the model proposed here, since the infected individuals are isolated from the community when they become symptomatic after the latent period is ended, the infected individuals do not infect susceptible individuals in the community after the latent period. The recovered individuals who were isolated and have been medically recovered and have immunity return to the community. Thus, the infected individuals contact both the susceptible individuals and the recovered individuals after the recovery period is ended. The model including both the effect of the isolated/recovered individuals in the community and the infection occurring during the latent period shows remarkably different results from those simulated by the SIR model for the number of infected individuals, for the infection duration and for others.
Contact rate between infected and susceptible in the community mixed with infected, susceptible and recovered
The SIR model created by Kermack and McKendrick [1,2] is a representative compartment model for infectious diseases and is now commonly used even for COVID-19 [3-13]. The model consists of three compartments of ‘Susceptible’, ‘Infected’ and ‘Removed’ and is expressed by the following differential equations, which have not changed since Kermack and McKendrick [1].
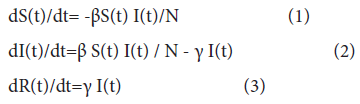
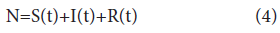
Where S(t) is the number of susceptible individuals who are not infected but could become infected, I(t) is the number of infected individuals who have been infected and are capable of infecting susceptible individuals, and R(t) is the number of removed individuals who have been removed from the community after they have been recovered from the disease after the infectious period (the recovery period) is ended or who have died. The coefficient β is the contact/ infection rate, and γ is the removal rate (1/γ represents the average recovery period (infectious period)). N is the population of the community and
Eq. (2), dI(t)/dt, indicates the rate of change in the number of infected individuals, that is, the increment in the number of infected individuals per unit time. At the same time, Eq. (2) indicates that the removed individuals are removed not only from the disease but also practically from the community, as is the death. Since the community excluding the removed individuals is composed of the susceptible individuals and the infected ones, the infected individuals inevitably contact only the susceptible individuals, as mentioned by Kermack and McKendrick [1] as “the chance of an infection is proportional to the number of infected on the one hand, and to the number not yet infected on the other”.
Most of the removed individuals, however, are medically recovered and in fact return to the community, though they are isolated until the recovery period is ended. From a physical point of view, in such a community mixed with infected, susceptible and recovered individuals, the contact of the infected individuals with the recovered ones must reduce the contact rate between the infected individuals and the susceptible ones when the number of recovered individuals has been increased. The contact rate of Eq. (2) is given by S(t)/N. Accounting for the reduction effect of the recovered individuals on the contact rate, the term S(t)/N can be transformed to the following equation:

Where cr(n) is the contact rate, n is the date starting from 1 when the infection begins, N(n) is the population excluding the individuals kept in isolation and the dead in the community, and R(n) is the number of recovered individuals who have returned to the community. The term ‘-δ(R(n)/N(n))’ is the reduction effect of the recovered individuals on the contact rate between the infected individuals and the susceptible ones, and the term (1-δ(R(n)/N(n)) is the ‘reduction rate’ of the contact rate. The reduction effect increases with decreasing value of (1-δ(R(n)/N(n)). ‘δ’ is a coefficient expressing the activity level of the recovered individuals in the community. When the value of δ is given by 1, the activity is the same level as the susceptible individuals, and when the value of δ is given by 0, the recovered individuals are not active, meaning the same condition as they are kept in isolation from the community; thus, the contact rate of Eq. (5), cr(n), is practically equal to S(t)/N of the SIR model.
The reduction effect is caused not only by the recovered individuals but also by the vaccinated individuals who have been vaccinated, have immunity and are working in the community. Not only for adequate evaluation of vaccination but also to correctly evaluate the change in the number of infected individuals, should the reduction effect of vaccination be taken into account. The new model should contain the reduction effect of both the recovered individuals and the vaccinated individuals.
Calculation for the case of infection during the latent period for COVID-19
For the SIR model, the infected individuals are capable of infecting the susceptible individuals through the recovery period. Concerning the latent period, the SEIR model, which is an extended model of the SIR, has been used for the simulation of COVID-19 [14-21]. It consists of four compartments of ‘Susceptible’, ‘Exposed who is infected but not infectious during the latent period’, ‘Infectious who is infectious after the latent period until the recovery period is ended’ and ‘Recovered’. The SEIR mode has a condition in which the infectious individuals are able to infect susceptible individuals after the latent period until the recovery period is ended, and after the recovery period is ended, they are removed from the community for the purpose of calculation. For COVID-19, however, individuals who are symptomatic after the latent period should be isolated from the community, and therefore, they do not infect susceptible individuals in the community after the latent period, even during the recovery period. Nevertheless, sustained community spread of COVID-19 has been occurring in the community. Namely, even during the latent period, the infection occurs as actually seen in the world.
Before the start of the following explanation, it should be confirmed that the number of infected individuals, P(n), is not equal to the number of individuals infected each day, AP(n) (=ΔP(n)). The former is the number of individuals being infected and infectious, which is the sum of the number of individuals infected during the latent period and/ or the recovery period, whereas the latter is the number of individuals newly infected for one day, equivalent to dI(t)/dt of Eq. (2).
For the model proposed here, many of the infected individuals become symptomatic after the latent period is ended and should be isolated from the community. They are capable of infecting susceptible individuals until they are isolated, meaning that they are capable of infecting during the latent period. After the isolation period (the recovery period) is ended, they return to the community. Some infected individuals, however, are asymptomatic through the recovery period, including the latent period. They are infectious but not isolated, staying in the community and continuing to infect susceptible individuals during the recovery period. They become secretly the recovered individuals in the community after the recovery period is ended.
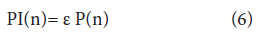
The number of symptomatic individuals, PI (n), is given by
and the number of asymptomatic infected individuals, AS(n), is given by

Where P(n) is the number of infected individuals, equivalent to I(t) of Eqs. (1), (2), (3) and (4), and the coefficient ε is the symptomatic rate on the date next to the end of the latent period. When ε is 1, all the infected individuals are symptomatic and isolated after the latent period is ended.
Consequently, the rate of change in the number of infected individuals, that is, the increment and/or decrement in the number of infected individuals a day, ΔP(n) (=AP(n)), can be given by the following difference equation:

where n’ indicates the date ‘the recovery period’ before date n and P(n’) is the number of infected individuals who have been newly infected on date n’ and become recovered individuals on date n. When δ is set to 0, ε is set to 1.0, and the latent period is set equal to the recovery period, Eq. (8) is equivalent to Eq. (2) of the SIR model.
Methodology
Framework of the model proposed here
The model proposed here consists of six categories of ‘Susceptible: RM’; ‘Vaccinated: V’; ‘Recovered: RI, RT, RAS’; ‘Infected (‘Infectious’, Patient’): P’; ‘Isolated: I, PI’; and ‘Death: DAS, DTI, DT’, as shown in Figure 1. A compartment on the left side, containing ‘Susceptible’, ‘Vaccinated’, ‘Recovered’, ‘Infected’ and ‘Death’, is a ‘real community’. Its population, N(n), is changed by subtracting the number of isolated individuals (I, PI) and death (DAS) and by adding the number of recovered individuals (RI and RT). Another compartment on the right side contains ‘Isolated’ and ‘Death’. The large compartment consisting of the two compartments mentioned above is the ‘whole community’, of which the population is expressed by TN(n). TN(n) includes the number of individuals living in the two compartments and the toll of death occurring at the fatality rate in the two compartments. TN(n) and N(n) are changed due to the number of ‘Susceptible (NAP(n))’ and/or ‘Infected (UP(n))’ coming in and/or going out of the community.

Figure 1: Flow of ‘Susceptible; RM, NAP’, ‘Vaccinated; V’, ‘Recovered; RI, RT, RAS’, ‘Infected; P(I, PI, AS), UP’, ‘Isolated; I, PI’ and ‘Death; DAS, DTI, DT’.
The infected individuals in the community, P(n), are separated into three groups of those (I(n)) who are confirmed to be infected due to being test positive, those (PI(n)) who are symptomatic after the latent period and those (AS(n)) who are asymptomatic through the recovery period. The isolated individuals are composed of two groups of those (I(n)) who are confirmed to be infected due to being test positive and then isolated and those (PI(n)) who are symptomatic in the community and then isolated. Each of them needs to be calculated in a different manner according to the coefficients of the test positive rate and the symptomatic rate.
The recovered individuals are composed of two groups. One is the group of recovered individuals in the right compartment, consisting of those (RI(n’)) who were isolated due to being test positive, (I(n)) and have been recovered and those (RT(n’)) who were isolated due to being symptomatic in the community, (PI(n)) and have been recovered. For the date (n’) of returning to the community, each of them must be calculated in a different manner according to the isolation durations that are different from each other. The total number of recovered individuals (RI(n’)+RT(n’)) is not always equal to that of infected individuals (I(n)+PI(n)) because RI(n’)+RT(n’) is the number subtracting the total number of deaths (DTI(n)+DT(n)) from (I(n)+PI(n). The other is the group of recovered individuals in the left compartment, (RAS(n’)), who are the individuals who recovered from the ‘asymptomatic’ in the community. The number of recovered individuals (RAS(n’)) is not always equal to that of asymptomatic individuals (AS(n)) because RAS(n’) is the number subtracting the number of deaths (DAS(n) from AS(n)).
The ‘death’ individuals are also composed of two groups of those (DAS(n)) who are asymptomatic and die of infection after the latent period in the community and those (DTI(n) and DT(n)) who die during the isolation period. Each of them needs to be calculated in a different manner according to different fatality rates. Vaccinated individuals, V (n), have immunity and live and work in the community. Vaccination decreases the number of susceptible individuals.
Data calculation process
Using an Excel file, calculation is performed based on Eq. (8), but it is practically transformed to the following equation group using the terms described below. The meaning of the individual term is as follows:
The number of infected individuals on date n is given by
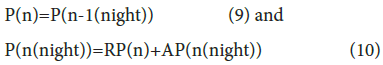
Where P(n-1(night)) is the number of infected individuals at night of the previous day, P(n) is the number of infected individuals in the community in the morning on date n, P(n(night) is the number of infected individuals at night, and RP(n) is the number of infected individuals in the morning, which is given by Eq. (12), and AP(n(night)) is the increment of infected individuals a day on date n, which is given by Eq. (14). Infection occurs during the day and evening for the purpose of calculation. Eq. (10) is practically given by Eq. (13).
RPM(n)=P(n)+UP(n)-I(n-1) (11)
Where RPM(n) is the reminder of infected individuals in the community excluding the individuals isolated due to being test positive on the previous day, I(n-1). The individuals confirmed to be infected due to being test positive should be isolated on the next day for the purpose of calculation. UP(n) is the value of increase and/or decrease in number of infected individuals due to external factors such as travelling, self- isolation and migration (immigration/emigration). As a result, RPM(n) is the total number of infected individuals in the community on date n.
RP(n)=Σ(AP(n) - PI(n-1) - DAS(n-1) - RAS(n)) (12)
RP(n) is the number of infected individuals excluding the individuals kept in isolation and the dead. At the same time, RP(n) indicates the number of infectious individuals who are practically infecting susceptible individuals in the real community and should be categorized as the ‘spreader’ to distinguish them from P(n) and P(n(night)). PI(n -1) is the number of individuals isolated due to being symptomatic in the community, DAS(n-1) is the number of death tolls in the community on the previous day and RAS(n) is the number of recovered individuals who were asymptomatic infected individuals in the community before the end of the recovery period and have become recovered individuals on date n. Using the terms explained above, P(n(night)) is given by the following equation:
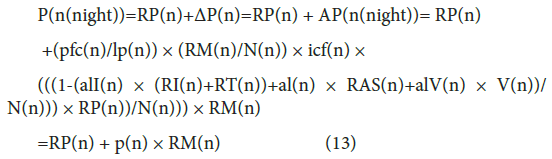
where ΔP(n)( =AP(n(night))) is the number of individuals newly infected on date n, that is, the increment in the number of infected individuals a day, and is equivalent to Eq. (8), as shown by the following equation:
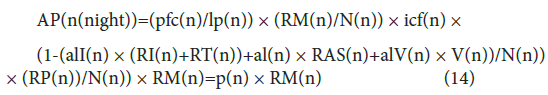
where p(n)=(pfc(n)/lp(n)) × (RM(n)/N(n)) × icf(n) × (1-AL(n)/ N(n)) ×(RP(n)/N(n)) (15) and
AL(n)=alI(n) × (RI(n)+RT(n))+al(n) × RAS(n)+alV(n) × V(n) (16)
The coefficient p(n) indicates an infectious capacity, including the contact rate changing with the number of susceptible and recovered individuals, and AL(n) is the sum of the activity levels of the recovered individuals and of the vaccinated individuals. The alI(n) is the activity level of the recovered individuals returning from the isolated category, al(n) is that of the recovered individuals recovered from the ‘asymptomatic’ in the community, and alV(n) is that of the vaccinated individuals. The term AL(n)/N(n) is equivalent to the term δ(R(n)/N(n)), and the term (1- AL(n)/N(n)) is equivalent to the term (1-δ(R(n)/N(n)) of Eqs. (5) and (8).
RM(n) is the number of susceptible individuals in the community and is given by
RM(n)= TN(n)-(CI(n)+CAP(n)+V(n)) (17)
where TN(n) is the total population of the community, that is, the number of living individuals and the toll of death in the community; CI(n) is ΣI(n), that is, the cumulative number of isolated individuals due to being test positive; CAP(n) is ΣAP(n), that is, the cumulative number of individuals who are newly infected a day, including the number of individuals who test positive but are not isolated; and V(n) is the number of vaccinated individuals who are living in the community.
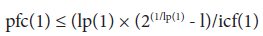
The coefficient of pfc(n) of Eqs. (13), (14) and (15) are the potential (biological) infectious capacity of coronavirus (persons/person), which is the value suggesting an approximate number of susceptible individuals infected by an infected individual during the latent period, and lp(n) is the latent period. The value of pfc(n) is not changed by interventions controlling the contact rate, such as ‘staying home’ and ‘lockdown’, although it is changeable for applying seasonal variation and others, including a new strain. The value pfc(n)/lp(n) is the infection rate (persons/person/day) and is used for calculation of the simulation. The coefficient of icf(n) is the infection reduction rate by infectious control measures preventing the spread of the virus, such as facemask, partition and disinfectant.
Results
Difference in the number of infected individuals simulated between the SIR and the model proposed here.
When the latent period is set equal to the recovery period and when the coefficient of AL(n) is set to 0, indicating that the activity of the recovered individuals is 0, equivalent to the state that the recovered individuals do not return to the community, the model proposed here is practically the same as the SIR model. For the SIR model, when the latent period and the recovery period are both 14 days, the population of the community is 1,000,000, the initial number of infected individuals is 1 and the value of the potential infectious capacity of coronavirus (pfc(n)) is 1.0, the number of infected individuals reaches 2,308 at the peak from the 974th to the 977th, and then decreases down 0 on the 2121st with the total number of infected individuals of 66,771. On the other hand, for the model proposed here, the number of infected individuals reaches 1,589 at the peak from the 928th to the 934th and then decreases to 0 on the 2012nd, with a total number of infected individuals of 45,504, indicating a marked decrease in the number of infected individuals with a shorter duration of infection (Table 1 and Figure 2).
| pfc | Infected | Σ Removed up to the peak | Total | ||||
|---|---|---|---|---|---|---|---|
| Peak | Duration | ||||||
| Date | Number | Date-Date | Susceptible | Infected | |||
| 1.00 | SIR | 974-977 | 2,308 | 34,176-34,608 | Jan-21 | 933,229 | 66,771 |
| This Model | 928-934 | 1,589 | 23,273-23,769 | Jan-12 | 954,496 | 45,504 | |
| 1.5 | SIR | 197 | 90,213 | 147,909 | 1-434 | 619,279 | 380,721 |
| This Model | 192 | 73,236 | 113,251 | 1-397 | 707,145 | 292,855 | |
| 2.00 | SIR | 126 | 202,782 | 164,015 | 1-287 | 461,011 | 538,989 |
| This Model | 125 | 179,108 | 147,516 | 1-255 | 553,688 | 446,312 | |
| 3.00 | SIR | 82 | 389,641 | 153,079 | 1-195 | 302,489 | 697,511 |
| This Model | 81 | 369,995 | 132,350 | 1-166 | 374,562 | 625,438 | |
Table 1: Differences in the number of ‘Infected’ between the SIR model and the model proposed here by different values of the potential infectious capacity of coronavirus, pfc. The recovery period was 14 days. The ‘S Removed up to the peak’ indicates the cumulative number up to the peak for the removed individuals of the SIR model and the cumulative number up to the peak for the recovered individuals who return to the community at the end of the recovery period of the model proposed here.

Figure 2: Difference in the number of infected individuals between the SIR model (dotted lines)
and the model proposed here (solid lines) when the potential infectious capacity of coronavirus, pfc, is 1.0. Note:  s model
The differences in the number of infected individuals at the peak, in the total number of infected individuals, and in the duration of infection between the SIR model and the model proposed here are shown in Table 1 and Figures 2 and 3 by different values of pfc. For any values of pfcs, the results of the model proposed here show that the dates of the peak have been brought forward and the durations of infection become short and that the numbers of infected individuals at the peak decrease and the total number of infected individuals is also smaller. Namely, when the recovered individuals who have immunity return to the community, the dates of the peak have been brought forward, the durations become markedly shorter, and the numbers of infected individuals become significantly smaller.

Figure 3: Differences in the number of infected individuals between the SIR model (dotted
lines) and the model proposed here (solid lines) by different values of the potential infectious
capacity of coronavirus, pfc. Note: s model
Since the model proposed here can have a latent period different from the recovery period, when a latent period is set different from the recovery period, and the coefficient of AL(n) is set to 0, meaning that the recovered individuals do not return to the community, the model proposed here could be called the ‘modified SIR model’. Note that the values of the infection rate (persons/person/day), pfc(n)/lp(n), of the modified SIR model are different from those of the SIR model, of which the infection rate is pfc(n)/rp(n).
The dates of the peak and the numbers of infected individuals are also different, as shown in Table 2 and Figure 4. It can also be said that when the recovered individuals who have immunity return to the community, the dates of the peak have been brought forward, the durations become shorter, and the numbers of infected individuals considerably decrease.
| Infected | Isolated | Total | |||||||
|---|---|---|---|---|---|---|---|---|---|
| Peak | Duration | Peak | Duration | ||||||
| pfc | Date | Number | Date-Date | Date | Number | Date-Date | Susceptible | Infected | |
| 1.00 | Modified SIR | 201 | 20,059 | 1-376 | 208 | 25,734 | 7-387 | 803,362 | 196,638 |
| This Model | 194 | 14,895 | 1-354 | 201 | 19,107 | 7-365 | 858,212 | 141,788 | |
| 2.00 | Modified SIR | 51 | 330,735 | Jan-90 | 58 | 409,624 | Jul-98 | 220,462 | 779,538 |
| This Model | 51 | 326,267 | Jan-83 | 58 | 403,664 | Jul-91 | 260,031 | 739,969 | |
Table 2: Differences in the number of infected individuals between the modified SIR model and the model proposed here by different values of the potential infectious capacity of coronavirus, pfc. The latent period is 5 days, and the recovery period is 14 days. The population of the community is 1,000,000, and the initial number of infected individuals is 1. The ‘modified SIR model’ means that the recovered individuals do not return to the community.

Figure 4: Differences in the number of infected individuals between the modified SIR (dotted lines),
meaning that the recovered individuals do not return to the community, and the model proposed here
(solid lines)) by different values of the potential infectious capacity of coronavirus, pfc. Note: ( ) : SIR;  : s model
Consequently, the results simulated by the model proposed here, where the recovered individuals who have immunity return to the community, show that the dates of the peak are brought forward, the duration becomes short, and the numbers of infected individuals are smaller in comparison to the results calculated by the SIR model.
The threshold of the potential infectious capacity, pfc, for limiting the spread of infection
Although ratios such as (RM(n)/N(n)) and (RP(n)/N(n)) are used in the practical calculation of the change in the number of infected individuals, as shown by Eqs. (13) and (14), the change in the number of infected individuals is explained in a simple conceptual and theoretical manner as follows:
For the model proposed here, on the first day of the simulation, the number of infected individuals increases from P(1) to P(1)+P(1) × icf(1) × pfc(1)/lp(1)). Thus, the number of infected individuals at night, P(1(night)), is expressed as:
P(1(night))=P(1)+P(1) × icf(1) × (pfc(1)/lp(1))=P(1) × (1+icf(1) × (pfc(1)/lp(1)) (18)
where icf(1) is the infection reduction rate. On the second day, in the morning, the number of infected individuals, P(2), is equal to P(1(night)), that is, P(2)=P(1(night)). The number of infected individuals at night on the second day, P(2(night)), is given by P(2(night))= P(2) × (1+ icf(2) × (pfc(2)/lp(2))
=(P(1) × (1+icf(1) × (pfc(1)/lp(1))) × (1+ icf(2) × (pfc(2)/lp(2)) (19)
Since icf(2) is equal to icf(1) and pfc(2)/lp(2) is also equal to pfc(1)/ lp(1) during the latent period,
P(2(night))= (P(1) × (1+icf(1) × (pfc(1)/lp(1)))2 (20)
During the latent period, the number of infected individuals increases in the same manner as the calculation of the ‘compound interest’, and at night on the last day of the latent period, the number of infected individuals, P(lp(night)), is given by
P(lp(night))= P(1) × (1+ icf(1) × (pfc(1)/lp(1)))lp(1) (21)
On the day after the latent period is ended, the infected individuals of P(1) × syr(lp) became symptomatic and should be isolated from the community.
Thus, when the value of the symptomatic rate (syr(lp)) is 1, meaning that all the number of P(1) become symptomatic and are isolated, the number of infected individuals having increased during the latent period, ΔP(during lp), is given by
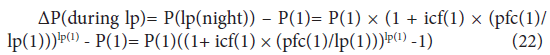
Since ΔP(during lp) is the number of infected individuals actually existing in the community and becomes the initial number of infected individuals for the next latent period, when ΔP(during lp) is equal to or less than P(1), that is, ΔP(during lp) ≤ P(1), continuous spread of infection does not occur, although the number of infected individuals increases during the latent period.
Thus, the condition for limiting the spread of infection is as follows:

Eq. (23) is rewritten as

Namely, when the following inequality is satisfied, the infection does not continuously spread:

For example, when the value of the infection reduction rate (icf(1)) is 1, meaning that the reduction effect of infectious control measures is not required to be considered, the latent period (lp(1)) is 5 days, and the condition in which infection does not spread is given by:

It is notable that the threshold of pfc is not ‘1 or less’ but ‘0.7435 or less’, indicating that even though the value of pfc is less than 1.0, the spread of infection could occur.
The results of the simulation satisfying the condition for the case where pfc(1)=0.7435 (pfc(1)/lp(1)= 0.1487), the initial number of infected individuals (P(1)) is 50, the population of the community is 1,000,000, the value of icf(n) is 1 and lp(n) is 5 are shown in Table 3 and Figure 5. The number of infected individuals increases from 50 to 115 at the peak on the 7th and then decreases to 0 on the 167th. The number of isolated individuals increases to 134 at the peak on the 15th and then decreases to 0 on the 182nd. The total number of infected individuals is 462.
| Infected | Isolated | Total | ||||||
|---|---|---|---|---|---|---|---|---|
| P(1) | Peak | Duration | Peak | Duration | ||||
| Date | Number | Date | Number | Susceptible | Infected | |||
| P(1)50 | 7 | 115 | 1-167 | 15 | 134 | 7-182 | 999,538 | 462 |
| P(1) 1 | 44,663 | 2 | Jan-47 | 44,861 | 2 | Jul-62 | 999,991 | 9 |
Table 3: Changes in the number of infected individuals and isolated individuals under the condition in which infection does not spread, where pfc(1)=0.7435 (pfc(1)/lp(1)=0.1487), the initial number of infected individuals (P(1)) is 50, the population of the community is 1,000,000, the infection reduction rate by infectious control measures preventing the spread of virus, icf(1), is 1 and the latent period, lp(1), is 5.

Figure 5: Changes in the number of infected individuals and isolated individuals for the case that continuous spread of infection does not occur. The value of pfc (1)=0.7435 (pfc(1)/ lp(1)=0.1487), and the initial number of infected individuals (P(1)) is 50.
Herd immunity threshold
When any infected individuals are not isolated without any intervention, they continue infecting susceptible individuals in the community until the recovery period is ended, and then they become recovered individuals who have immunity in the community. For such a case, the number of infected individuals increases to a peak and then decreases. This phenomenon is sometimes explained by ‘herd immunity’, which is an indirect protection against the spread of infection caused by the immunity of a large proportion of the population. The contact of the infected individuals with the recovered ones must accelerate reduction of the contact rate between the infected individuals and the susceptible ones as the number of recovered individuals increases, inducing a decrease in the number of infected individuals. This is scientific proof of the idea of herd immunity. The cumulative number of infected individuals at the peak, which is the turning point from increase to decrease, is one of the ‘herd immunity thresholds’, being a target value for vaccination.
For the model proposed here, when the symptomatic rate, syr(n), is set to 0, any infected individuals in the community are not isolated. They stay in the community and continue infecting susceptible individuals until the recovery period is ended. They then recovered after the recovery period. The results of simulation by different values of pfc are shown in Table 4 and Figure 6. When the value of pfc is 1.0, the number of individuals newly infected a day reaches 28,012 at the peak on the 77th, with a cumulative number of 383,974, and then decreases to 0 on the 155th. The number of infected individuals reaches 517,318 at the peak on the 89th, with a cumulative number of 629,455, and then decreases to 0 on the 189th, with a total number of infected individuals of 728,431. On the other hand, when the value of pfc is 2.0, the number of individuals newly infected a day reaches 59,029 at the peak on the 42nd with a cumulative number of 464,859 and then decreases to 0 on the 98th. The number of infected individuals reached 775,424 at the peak on the 56th, with a cumulative number of 829,003. After the peak, the number of infected individuals decreases to 0 on the 126th with a total number of infected individuals of 873,160.
| pfc | Infected/day | Infected | Total | |||||||||
|---|---|---|---|---|---|---|---|---|---|---|---|---|
| Duration | Peak | Σ Infected | Σ Recovered | Duration | Peak | Σ Infected | Σ Recovered | |||||
| up to the peak | up to the peak | up to the peak | up to the peak | |||||||||
| Date-Date | Date | Number | Number | Number | Date-Date | Date | Number | Number | Number | Susceptible | Infected | |
| 1.00 | 1-155 | 77 | 28,012 | 383,974 | 16,167 | 1-189 | 89 | 517,318 | 629,455 | 114,734 | 271,569 | 728,431 |
| 2.00 | 1-98 | 42 | 59,029 | 464,859 | 836 | 1-126 | 56 | 775,424 | 829,003 | 60,477 | 126,840 | 873,160 |
Table 4: The number of infected individuals by different pfcs when syr is set to 0.0. The individuals who recover and have immunity after the recovery period live and work in the community. The latent period is 5 days, the recovery period is 14 days, the population of the community is 1,000,000 and the initial number of infected individuals is 1. ‘ΣInfected’ indicates the cumulative number of infected individuals up to the peak, and ‘Σ Recovered’ indicates the cumulative number of recovered individuals up to the peak. ‘Total’ indicates the total number on the last day of the duration of the ‘infected’.

Figure 6: Changes in the number of infected individuals, the number of individuals newly infected a day, the cumulative number of infected individuals and that of susceptible individuals for different pfcs when the value of syr is 0.0. The individuals who recover and have immunity after the recovery period live and work in the community. The ‘infected/day’ indicates the number of individuals newly infected a day.
Each of the numbers 629,455 (approximately 63% of the population) and 829,003 (approximately 83% of the population) is a herd immunity threshold without any intervention. It must be called ‘potential (natural) herd immunity’ to distinguish it from the herd immunity suggested by the SIR model. Although potential herd immunity could be achieved sooner than expected, it is surely achieved only at the cost of so many infected individuals with so much death.
The effect of the vaccination on the spread of infection
The number of infected individuals at night on date n, P(n(night), is given by
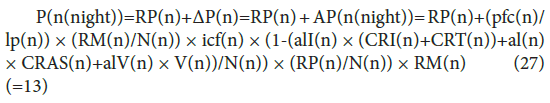
and the number of susceptible individuals in the community at night, RM(n), is expressed by
RM(n)= TN(n)-(CI(n)+CAP(n)+V(n)) (28)(= 17)
where V(n) is the number of vaccinated individuals who live and work in the community. When the number of vaccinated individuals (V(n)) increases, the number of susceptible individuals (RM(n)) decreases, as calculated by Eq. (28), Eq. (27), including term RM(n), indicates that the increase in the number of vaccinated individuals directly decreases the number of infected individuals.
The contact rate (cr(n)) between the infected and susceptible individuals is given by

where (1-δ(R(n)/N(n)) is the reduction rate, and as previously mentioned,
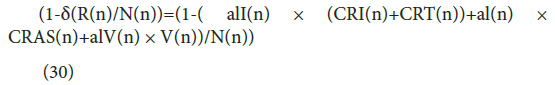
The reduction effect on the contact rate increases with a decreasing value of (1-δ(R(n)/N(n)). Namely, Eq. (29) indicates that when the number of vaccinated individuals increases, the reduction rate decreases. As a result, the contact rate is decreased. Consequently, the increase in vaccinated individuals decreases not only the number of susceptible individuals but also the value of the contact rate.
When the vaccination rate is 0, meaning that the number of vaccinated individuals is 0, and any recovered individuals do not return to the community, the number of infected individuals reaches 20,059 at the peak on the 201st and then decreases to 0 on the 376th with a total number of infected individuals of 196,638 (Table 5). However, when the recovered individuals returned to the community, the number of infected individuals reached 14,895 at the peak on the 194th and then decreased to 0 on the 354th, with a total number of infected individuals of 141,788, indicating that the return of the recovered individuals considerably decreased the number of infected individuals (Figure 7).
| v(n) | Vaccinated | Infected | Isolated | Total | ||||||||
|---|---|---|---|---|---|---|---|---|---|---|---|---|
| Duration | Peak | Duration | Peak | Duration | ||||||||
| Number | Date- | Date | Number | Date-Date | Date | Number | Date-Date | Susceptible | Infected | Vaccinated | ||
| 0.000 | Modified SIR | - | - | 201 | 20,059 | 1-376 | 208 | 25,734 | 7-387 | 803,362 | 196,638 | - |
| This model | - | - | 194 | 14,895 | 1-354 | 201 | 19,107 | 7-365 | 858,212 | 141,788 | - | |
| v(101) | Modified SIR | 100,000 | 101- | 105 | 386 | 1-677 | 113 | 492 | 7-705 | 893,529 | 6,471 | 100,000 |
| 0.1 | This model | 100,000 | 101- | 102 | 368 | 1-271 | 110 | 461 | 7-284 | 897,513 | 2,487 | 100,000 |
| v(151) | Modified SIR | 100,000 | 151- | 154 | 4,823 | 1-432 | 162 | 6,122 | 7-446 | 856,740 | 43,260 | 100,000 |
| 0.1 | This model | 100,000 | 151- | 151 | 4,516 | 1-305 | 159 | 5,625 | 7-316 | 873,094 | 26,906 | 100,000 |
Table 5: Differences in the number of infected individuals between the modified SIR model and the model proposed here by different dates of vaccination. The latent period is 5 days, and the recovery period is 14 days. The pfc is 1.0, the population of the community is 1,000,000 and the initial number of infected individuals is 1. ‘v(101)0.1’ means that the vaccination rate is set to 0.1 on the 101st, indicating that the number of vaccinated individuals is 100,000 on and after the 101st. The ‘modified SIR’ means that the recovered individuals do not return to the community.

Figure 7: Changes in the number of infected individuals showing the differences between the modified SIR model (dotted lines) and the model proposed here (solid lines) by different dates of vaccination. ‘V (101~) 0.1’ means that the vaccination rate is set to 0.1 on the 101st, indicating that the number of vaccinated individuals is 100,000 on and after the 101st. The ‘modified SIR’ means that the recovered individuals do not return to the community.
On the other hand, when the vaccination rate is set to 0.1 (10% of the population) on the 101st, meaning that the number of vaccinated individuals is 100,000 on and after the 101st, the number of infected individuals reaches 368 at the peak on the 102nd and then decreases to 0 on the 271st with a total number of infected individuals of 2,487. Even for the modified SIR model, meaning that the recovered individuals do not return to the community, the number of infected individuals reaches 386 at the peak on the 105th and then decreases to 0 on the 677th, with a total number of infected individuals of 6,471 (Table 5 and Figure 7). For both cases above, the number of infected individuals was markedly smaller than that of the case without any vaccinated individuals.
In addition, when the vaccination rate is set to 0.1 on the 151st, meaning that the number of vaccinated individuals is 100,000 on and after the 151st, for the model proposed here, the number of infected individuals reaches 4,516 at the peak on the 151st and then decreases to 0 at the 305th with a total number of infected individuals of 26,906. For the modified SIR model, the number of infected individuals reaches 4,823 at the peak on the 154th and then decreases to 0 on the 432nd, with a total number of infected individuals of 43,260. Although the number of infected individuals was markedly smaller than that in the case without any vaccinated individuals, it was markedly larger than that in the case in which vaccination was carried out on the 101st. Although the simple cases of simulation are shown here, it can be said that the earlier the vaccination is carried out, the larger the effect decreases the number of infected individuals. It can also be said that the continuous increase in the number of vaccinated individuals should quickly decrease the number of infected individuals.
The effect of breakthrough infection on the spread of infection
As examined above, when the vaccination rate is set to 0.1 on the 101st, the number of infected individuals reaches 368 at the peak on the 102nd and then decreases to 61 on the 150th. The subtotal number of infected individuals up to the 150th is 2,297, the number of susceptible individuals is 897,703 and the number of vaccinated individuals is 100,000 (Table 6). When breakthrough infection of which rate (b (151) is 0.5 occurs on the 151st, the number of susceptible individuals rises to 947,696, including 50,000 of the vaccinated individuals who have turned to ‘may get infected’ and are reset to be the susceptible individuals, the subtotal number of infected individuals becomes 2,304, and the number of vaccinated individuals who maintain immunity has decreased to 50,000 (Table 6 and Figure 8).
| Duration | Vaccinated | Breakthrough | Infected | Isolated | Total | |||||||
|---|---|---|---|---|---|---|---|---|---|---|---|---|
| infection | Peak | Peak | Duration | Susceptible | Infected | Vaccinated | ||||||
| Date-Date | v(n) | Number | b(n) | Number | Date | Number | Date | Number | Date-Date | |||
| 1-101 | 0 | 0 | 0 | 0 | 101 | 365 | 101 | 326 | 1-101 | 998,887 | 1,113 | 0 |
| 101-150 | 0.1 | 100,000 | 0 | 0 | 102-103 | 368 | 110 | 461 | 1-150 | 897,703 | 2,297 | 100,000 |
| 150 | 0.1 | 100,000 | 0 | 0 | 150 | 61 | 150 | 104 | 1-150 | 897,703 | 2,297 | 100,000 |
| 151 | 0.1 | 100,000 | 0.5 | 50,000 | 151 | 59 | 151 | 100 | 1-151 | 947,696 | 2,304 | 50,000 |
| 151-1,498 | 0.1 | 100,000 | 0.5 | 50,000 | 494-514 | 206 | 506-516 | 265 | 1-1,498 | 932,836 | 17,164 | 50,000 |
Table 6: Changes in the number of infected individuals and isolated individuals for the case that the vaccination rate is set to 0.1 on the 101st, but the breakthrough infection whose rate is 0.5 occurs on the 151st. The pfc is 1.0, the latent period is 5 days, and the recovery period is 14 days. The population of the community is 1,000,000, and the initial number of infected individuals is 1. v(n) is the vaccination rate, and b(n) is the breakthrough rate. ‘Breakthrough infection: Number’ indicates the number of vaccinated individuals who have turned to ‘may get infected’ and are reset to be susceptible individuals. The number of isolated individuals becomes 0 on the 1,539th, though the number of infected individuals becomes 0 on the 1,498th.

Figure 8: Changes in the number of infected individuals and isolated individuals for the case that the vaccination rate is 0.1 on the 101st, but the breakthrough infection whose rate is 0.5 occurs on the 151st.
The number of infected individuals once decreases from 59 on the 151st to 56 on the 154th and then increases up to 206 at the second peak from the 494th to the 514th. After the second peak, the spread of infection slowly subsided, showing a tendency to continue for a long time. The number of infected individuals becomes 0 on the 1,498th, with a total number of infected individuals of 17,164, whereas when the breakthrough infection does not occur, the infection duration is 271 days, with a total number of infected individuals of 2,487 (Table 5). Thus, it can be said that the occurrence of breakthrough infection induces a long duration of infection, with a large number of individuals infected by breakthrough infection.
When some of the vaccinated individuals are initially not able to be immune, they are reset to be susceptible individuals on the date of vaccination adjusted by changing the vaccination rate v(n). When the quantity of antibody in vaccinated individuals decreases below a threshold, breakthrough infection also occurs. This phenomenon must continuously occur throughout the infection duration. Though the example examined here the breakthrough infection rate is kept as a constant value, when the breakthrough rate increases, the duration of the infection should last a longer time and the total number of infected individuals seriously increases.
The importance of the PCR test and/or antibody test for preventing the spread of infection
T(n) is the number of individuals having a PCR test or antibody test. It should be set on the day when the test is performed. The incidence rate for the test would be biased to be higher than that in the community, ir(n), because those having PCR tests are mainly close contacts. Namely, the incidence rate for the test, tir(n), is given by
tir(n)=bp(n) × ir(n) (31)
where ir(n) is the incidence rate in the community and bp(n) is the magnification with respect to ir(n). Thus, the number of infected individuals confirmed by the test, CP(n), is calculated by
CP(n)=T(n) × tir(n) = T(n) × bp(n) × ir(n) (32)
As a result, the value of tir(n) means the positive rate for the test because
tir(n)=CP(n)/T(n) (33)
The individuals who are confirmed to be infected due to being test positive are isolated and return to the community after the isolation period (the recovery period). However, all confirmed infected individuals are not always isolated. The number of isolated individuals, I(n), is given by
I(n)= CP(n) × i(n) (34)
where i(n) is the isolation rate for the individuals who are confirmed to be infected due to being test positive. The value of i(n) indicates the ratio of the number of isolated individuals to the total number of infected individuals confirmed. When all the confirmed infected individuals are isolated, the value of i(n) should be set to 1. For calculation, the individuals decided to be isolated are isolated on the next day, as shown by Eq. (11).
When the test is started on the 101st under the condition that the magnification (bp(n)) is 5, the isolation rate (i(n)) is 1, meaning that all the infected individuals confirmed are isolated, the latent period is 5 days, the recovery period is 14 days, the population of the community is 1,000,000 and the initial number of infected individuals is 1, the changes in the number of infected individuals and isolated individuals are shown in Tables 7 and 8 and Figures 9 and 10. When the test with 1,000 tested individuals is started on the 101st, the number of individuals confirmed to be infected and isolated due to being test positive a day is 2 (accurately 1.8) on the 101st, and then increases to 49 at the peak from the 198th to the 200th, and then decreases down 0 on the 304th with the total number of test positive individuals of 3,817. The number of individuals infected and isolated a day due to being symptomatic in the community reaches 1,396 at the peak on the 198th, indicating the considerably large number compared to 49 of test positive individuals. The number of infected individuals then decreases to 0 on the 353rd with the total number of infected individuals in the community of 109,467.
| Infected/day(test positive) | Infected/day (in the community) | Infected | Total | |||||||||
|---|---|---|---|---|---|---|---|---|---|---|---|---|
| Peak | Duration | Peak | Duration | Peak | Duration | Susceptible | Infected | |||||
| Date | Number | Date | Number | Date | Number | Community | Test | |||||
| Modified SIR | - | - | - | 197-198 | 2,877 | 1-345 | 201 | 20,059 | 1-376 | 803,362 | 196,638 | - |
| T=0 | - | - | - | 197-198 | 2,135 | 1-326 | 194 | 14,895 | 1-354 | 858,212 | 141,788 | - |
| T(101)1,000 | 198-200 | 49 | 101-304 | 198 | 1,396 | 1-353 | 201 | 9,797 | 1-373 | 886,716 | 109,467 | 3,817 |
| T(101)10,000 | 104-107 | 20 | 101-161 | 102 | 64 | 1-172 | 103 | 406 | 1-203 | 997,537 | 2,057 | 406 |
Table 7: Differences in the number of infected individuals between the cases in which the tests were started on the 101st by different numbers of tested individuals. The pfc is 1.0, the latent period is 5 days, the recovery period is 14 days, the population of the community is 1,000,000 and the initial number of infected individuals is 1. The 'T=0' indicates that the test was not carried out. The 'T(101)=1,000' indicates that the test with the number of tested individuals of 1,000/day starts on the 101st. The ‘modified SIR’ means that the recovered (isolated) individuals do not return to the community without any test.
| Infected/day(test positive) | Infected/day (in the community) | Infected | Total | |||||||||
|---|---|---|---|---|---|---|---|---|---|---|---|---|
| Peak | Duration | Peak | Duration | Peak | Duration | Susceptible | Infected | |||||
| Date | Number | Date | Number | Date | Number | Community | Test | |||||
| Modified SIR | - | - | - | 197-198 | 2,877 | 1-345 | 201 | 20,059 | 1-376 | 803,362 | 196,638 | - |
| T=0 | - | - | - | 197-198 | 2,135 | 1-326 | 194 | 14,895 | 1-354 | 858,212 | 141,788 | - |
| T(151)1,000 | 188-196 | 55 | 151-290 | 188 | 1,571 | 1-335 | 191 | 11,029 | 1-367 | 882,015 | 114,411 | 3,574 |
| T(101)1,000 | 198-200 | 49 | 101-304 | 198 | 1,396 | 1-353 | 201 | 9,796 | 1-373 | 886,716 | 109,467 | 3,817 |
| T(151)10,000 | 151 | 226 | 151-216 | 152 | 768 | 1-221 | 153 | 4,937 | 1-242 | 972,612 | 23,460 | 3,928 |
| T(101)10,000 | 104-107 | 20 | 101-161 | 102 | 64 | 1-172 | 103 | 406 | 1-203 | 997,537 | 2,057 | 406 |
Table 8: Differences in the number of infected individuals among the cases in which the tests were started on the 101st and the 151st by different numbers of tested individuals. The pfc is 1.0, the latent period is 5 days, the recovery period is 14 days, the population of the community is 1,000,000 and the initial number of infected individuals is 1. The 'T=0' indicates that the test was not carried out. The 'T(101)=10,000' indicates that the test with the number of tested individuals of 10,000/day starts on the 101st. The ‘modified SIR’ means that the recovered (isolated) individuals do not return to the community without any test.

Figure 9: Changes in the number of individuals newly infected a day for the cases in which the tests were started on the 101st by different numbers of tested individuals. The ‘T=0’ indicates that the test was not carried out. The ‘T(101)=1,000’ indicates that the test with the number of tested individuals of 1,000/day starts on the 101st. The ‘modified SIR’ means that the recovered (isolated) individuals do not return to the community without any test.

Figure 10: Changes in the number of infected individuals for the cases in which the tests are started on the 101st and the 151st by different numbers of tested individuals. The ‘T=0’ indicates that the test was not carried out. The ‘T(101)=10,000’ indicates that the test with the number of tested individuals of 10,000/day starts on the 101st. The ‘modified SIR’ means that the recovered (isolated) individuals do not return to the community.
For both the number of individuals newly infected a day and the total number of infected individuals, it should be recognized that the numbers of individuals confirmed to be infected by testing are relatively smaller than the actual numbers in the community. However, the total number of infected individuals, 113,284 (3,817+109,467), including the test positive individuals, is 28,500 less than that for the case without any test, that is, T=0 (Table 7 and Figure 9).
On the other hand, when the test with 10,000 tested individuals is started on the 101st, the number of infected individuals, which is the sum of the test positive individuals and the symptomatic individuals in the community, is 406 at the peak on the 103rd, then decreases down 0 on the 203rd with the total number of infected individuals of 2,463 (Table 8 and Figure 10). However, when the test with 10,000 tested individuals is started late on the 151st, the number of infected individuals becomes 4,937 at the peak on the 153rd, then decreases down 0 on the 242nd with the total number of infected individuals of 27,388. It shows more than ten times in the number of infected individuals for the case of the test started on the 101st. Thus, it can be said that the earlier the start of test, the smaller the number of infected individuals.
Comparing those numbers of tested individuals and the dates of start, it can be pointed out that the larger the number of tested individuals and the earlier the start of test, the markedly smaller the number of infected individuals. In other words, it is important to confirm the early and large number of infected individuals in the community, isolate them from the community and return them to the community after the recovery period. For the test, however, the more interesting point is as follows:
Table 9 and Figure 11 show the difference in the number of infected individuals between the test and vaccination cases. When the test with the number of tested individuals of 10,000/day is started on the 101st, as mentioned above, the number of infected individuals reaches 406 at the peak on the 103rd, then rapidly decreases down to 0 on the 203rd with the total number of infected individuals of 2,463. On the other hand, when the vaccination with a rate of 0.1 is carried out on the 101st, meaning that the number of vaccinated individuals is 100,000 on and after the 101st, the number of infected individuals reaches 368 at the peak on the 102nd, and then quickly decreases down to 0 on the 271st with the total number of infected individuals of 2,487. The curves showing the changes in the number of infected individuals are similar (Figure 11), and both total numbers of infected individuals are also similar. The test started on the 151st, and the vaccination carried out also on the 151st showed similar results, indicating that both have a comparable effect on preventing the spread of infection. The PCR test and/or antibody test, which are effective and convenient for any time and for any region, should be highly evaluated.
| Number of tested/Vaccinated | Infected | Isolated | Total | |||||||
|---|---|---|---|---|---|---|---|---|---|---|
| Peak | Duration | Peak | Duration | |||||||
| Date | Number | Date | Number | Susceptible | Infected | Vaccinated | ||||
| T(101)10,000 | 10,000 | 103 | 406 | 1-203 | 113 | 682 | 7-221 | 997,537 | 2,463 | - |
| v(101)0.1 | 100,000 | 102 | 368 | 1-271 | 110 | 461 | 7-284 | 897,513 | 2,487 | 100,000 |
| T(151)10,000 | 10,000 | 153 | 4,937 | 1-242 | 162 | 8,038 | 7-256 | 972,612 | 27,388 | - |
| v(151)0.1 | 100,000 | 151 | 4,516 | 1-305 | 159 | 5,625 | 7-316 | 873,094 | 26,906 | 100,000 |
Table 9: Comparison of the numbers of infected individuals and isolated individuals among the test and the vaccination by different start/carried out dates. The pfc is 1.0, the latent period is 5 days, the recovery period is 14 days, the population of the community is 1,000,000 and the initial number of infected individuals is 1. The 'T(101)10,000' indicates that the test with the number of tested individuals of 10,000/day starts on the 101st. 'v(101)0.1' indicates that vaccination at a rate of 0.1 is carried out on the 101st, meaning that the number of vaccinated individuals is 100,000 on and after the 101st in the community.

Figure 11: Changes in the number of infected individuals for the test and the vaccination by different start/carried out dates. The ‘T(101)10,000’ indicates that the test with the number of tested individuals of 10,000/day starts on the 101st. ‘v(101)0.1’ indicates that vaccination at a rate of 0.1 is carried out on the 101st, meaning that the number of vaccinated individuals is 100,000 on and after the 101st in the community.
Potential infectious capacity of coronavirus
When the potential infectious capacity of coronavirus, pfc, is intensified, the re-spread of infection must occur. For example, under the condition that the population of the community is 1,000,000, the initial number of infected individuals is 1, the latent period is 5 and the recovery period is 14, when pfc is 1.0 during the period from the 1st to the 351st, the number of infected individuals reaches 14,895 at the peak on the 194th and then decreases to 1 on the 340th. After the 340th, the number of infected individuals remains 1 to the 350th, with a total number of infected individuals of 141,787, suggesting that the infection is almost ended.
However, when the pfc (351) is intensified to be 2.0 on and after the 351st, even though the total number of infected individuals already reached 141,787, the number of infected individuals increases again, slowly at first and rapidly reaches 73,262 at the second peak on the 457th, and then decreases to 0 on the 522nd with the total number of infected individuals of 446,280, which includes the individuals infected during the first period (Table 10 and Figure 12). During the second period of infection after the 351st, the subtotal number of infected individuals increases by 304,493, two times as many as the subtotal number of infected individuals during the first period from the 1st to the 350th, indicating that the main period of infection is the second period after the pfc is intensified.
| pfc | Infected | Isolated | Total | ||||||||
|---|---|---|---|---|---|---|---|---|---|---|---|
| Duration | Peak | Duration | Peak | ||||||||