A Predictive Approach to Simulate Possible Impacts of Climate Change on the Agricultural Sector
Received: 20-Aug-2014 / Accepted Date: 28-Oct-2014 / Published Date: 10-Nov-2014 DOI: 10.4172/2157-7617.1000231
Abstract
The aim of this paper is to investigate the possible implications of climate change of maize and beans crop in the country of Belize. The approach utilized PRECIS and observed input data in combination with the Food and Agriculture Organization (FAO) CROPWAT program. Six scenarios were predicted looking at Maximum Temperature (Tmax), Minimum Temperature (Tmin) and Rainfall for the years 2050-2055 along with observed data of similar climatic variables for the year 1998. The approach was use for three sites namely Towerhill which is located to the north of the country, Central Farm which is located at the center of the country and Toledo Research and Development Project Site (TRDP) which is located at the southernmost part of the country. The results showed that there was an increase in both maximum and minimum temperature at two of the three sites with the exception of the Towerhill site and there was a reduction in rainfall in all predicted scenario with the exception of Towerhill site in 2051 which exhibited a 4.28 % increase over the baseline scenario. The reference evapotranspiration ETo value illustrated more precisely the possible impact of climate change as there was an increase in of all ETo values at the three observation sites. In regards to yield percent reduction the scenarios determine that climate change would have an impact on crop yield. Where yield percent reduction was as high as 80.1% at the Central Farm site. The results determined that climate change will affect these crops, by validating this, more suitable strategies and mitigating programs can developed and established to assist Belize in the prevention of a future food crisis.
Keywords: Climate change; Developing countries; Yield reduction; Reference evapotranspiration; Agriculture; Adaptation
8340Introduction
Climate change is projected to increase global annual mean temperatures in the range of 1.8-4ºC; increase the variability in rainfall; enhance frequency of extreme weather events such as heat waves, cold waves, droughts and floods [1]. Therefore there is concern about the impacts of climate change and its variability on agricultural production worldwide [2]. Two reasons were highlighted for this concern: Firstly food security which is notably on the list of human activities and ecosystem services under threat of dangerous anthropogenic interference on earth’s climate and secondly each country is naturally concerned with the potential damages and benefits that may arise over the coming decades from climate change impacts on its territory as well as globally, since these will affect domestic and international policies, trading patterns, resource use, regional planning, and the welfare of its people.
Studies have shown that while there is a positive response of crops to and increased level of carbon dioxide in the absence of climate change [2-5] the associated impacts of high temperatures [6,7], altered patterns of precipitation, and possibly increased frequency of extreme events [8], such as drought and floods, will likely combine to depress yields and increase production risks in many world regions [2]. Of these regions the regions which are more vulnerable to the impact of climate change are developing countries. Due to the importance of agriculture to their economies, scarcity of capital for adaptation [9-12], their warmer baseline climates [1,3] and their heightened exposure to extreme events [13]. According to United Nations Food and Agriculture Organization [14], 870 million people of the 7.1 billion people in the world were suffering from chronic undernourishment in 2010-2012. Almost all of the 852 million hungry people live in developing countries. Developing countries which rely heavily on farming not only as a source of income at a national and local but more importantly these countries rely on farming as a food source for its growing population.
Understanding the impacts of climate change will help Belize determine, where, when and how adaptation should be undertaken. There are four sources of information about the sensitivity of farms to climate [1,15,16]. 1) Agronomists have conducted controlled experiments in greenhouses with different temperatures. 2) Agronomic crop simulations model key grains such as maize, wheat, soybeans, and rice. 3) Cross sectional studies of yields of specific grains have been conducted across different climate zones. 4) Cross sectional economic models have been estimated using land values and farm net revenues across climate zones. These studies revealed that crops are sensitive to changes in temperature [1,15,16] and precipitation [17,18]. The consistency of these findings suggests that there is high confidence that crops are potentially vulnerable to climate change [15].
Gohari et al. [8] stated temperature increases affect most plants leading the crop yield reduction and some complex growth responses. Nevertheless, the impact of increasing can vary widely between crops and regions. Acknowledging this the overall objective of this paper is to assess the impact of climate change on rain fed agriculture in Belize. It observes percent yield reduction in two staple crops (beans and maize) as a result of observed and future scenarios derived from Providing Regional Climates for Impact Studies (PRECIS) in combination with FAO’s CROPWAT model.
The specific objectives are the following:
• to generate future scenarios as input data for CROPWAT using PRECIS
• to compare both observed and modeled climatic parameters and resulting reference evapotranspiration
• to analyze model results in reference to percent yield reduction as a result of both simulated and observed climatic parameters.
Materials and Methods
Sites and cropping considerations
The crops chosen for the simulation were Dry Beans (Phaseoulus vulgaris) and Maize (Zea mays), primarily because of their importance as staple grains in Belize. Beans are grown in a very wide range of latitudes and the mean air temperature varies between 14ºC and 35ºC with an optimal range of 29-35ºC. The temperature of the air and the root determining, seed germination, root growth, taproot formation and flowering [19,20]. Extreme temperatures, that are lower than 10ºC and higher than 40ºC can result in poor germination rate which subsequently disrupt the plant growth cycle [21]. The water requirements for maximum production of a 60-120 day crop vary between 300-500 mm depending on the climate [22]. Red Kidney beans was the variety of choice but the crop coefficient for R. K. beans was not available, therefore the reference crop coefficient value for dry beans was utilized which is similar to that of R. K. beans. Maize crop performed best when grown under an optimal air temperature of 20- 22ºC. For maximum production a medium maturity crop requires 500- 800 mm of water. Both crops would suffer from low productivity/yield if the adequate growing conditions are not available.
Three sites were selected for the simulation, namely: Central Farm (Cayo District), Towerhill (Orange Walk District) and the Toledo Research and Development Project site (TRDP) near Blue Creek village. The main agronomic parameters considered in the simulation were soils: primarily light sandy, medium loam and heavy clay. The cropping system was assumed to be rainfed mechanized, and in the case of Maize, the simulation was run for early planting (one month before the normal planting period in June), normal and late (one month after the normal planting period in June). The normal planting period in December was use for the simulation for Dry Beans. The simulation was run for each year from 2050 to 2055.
Crop simulation
The crop model simulations for this study were conducted with CROPWAT 8.0 [23] for Windows computer program. The main functions of this model are: to calculate reference evapotranspiration; develop irrigation schedules under various management conditions and water supply schemes and to evaluate the efficiency of irrigation practices [24]. The model requires input data such as climatic (monthly rainfall data, monthly means of minimum temperature Tmiv (ºC), maximum temperature Tmax (ºC), air relative humidity (%), sunshine duration (h), wind speed at 2 m high (m/s) and potential evapotranspiration ETo), crop (planting date, crop coefficient (Kc), crop description and percent covered by the plant) and soil data (intial soil moisture condition, maximum root infiltration rate and maximum rooting depth).
CROPWAT is essential for this study being that it utilizes the Food and Agriculture Penman Monteith Method (FAO-PM) to determine reference evapotranspiration by the given equation [22]:
where ETo is the reference evapotranspiration (mm day−1), RN is the net radiation at the crop surface (MJ m−2 day−1), G is the soil heat flux density (MJ m−2 day−1), T is the air temperature at 2 m height (°C), u2 is the wind speed at 2 m height (m s−1), ?s is the saturation vapor pressure (kPa), ea is the actual vapor pressure (kPa), γ is the psychometric constant (kPa °C−1) and is the slope of the saturation vapor pressure– temperature curve (kPa °C−1).
The FAO PM is the standard method for estimating ETo [22], it is physically based and explicitly incorporates both physiological and aerodynamics [25] as seen in equation. Its ability to apply missing data approach was vital in the case of the areas under evaluation due to poor data availability.
Climate change scenario
Quantification of changes in climate variation such as temperature and precipitation is the first step in climate change impact assessment [8]. With the global climate models (GCMs) being known as the most credible tools for the projection of future global climate change. GCMs simulate the physics of the atmosphere and various climate scenarios (SRES) [1,3]. The input climate data for CROPWAT as seen in Figure 1 was taken from observed data and from modeled data. Modeled data being taken from the Regional Climate Model (RCM), Providing Regional climates for impact studies (PRECIS). PRECIS is an atmospheric and land surface model of limited are locatable over any part of the world with spatial resolution of 0.44º×0.44º [6]. Jones et al. [26] claimed that it accounts for meteorologic dynamic flow atmospheric sulfur cycle, formation of clouds and precipitation, radiative processes, land surface vegetation, incoming radiation, heat fluxes, soil temperature and lateral boundary conditions, and is more suitable for high resolution impact assessments. The future climate projection for the period 2050-2055 was derived from the output of the Caribbean Community Climate Change Center (CCCCC) PRECISEcham5 A2 (25 km resolution) experiment conducted for the western Caribbean. The PRECIS-Echam5 A2 describes a heterogenous world with strong population growth, slow economic development and slow technological change [1]. Whereas the baseline climatic data used in this study for the year 1998 was acquired from Belize’s National Meteorological Service.
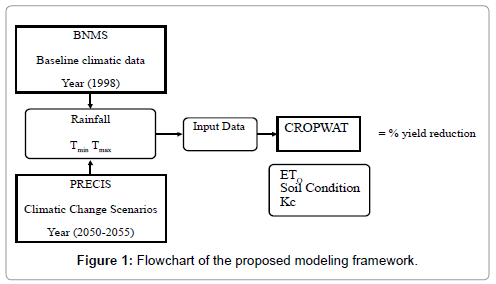
Figure 1: Flowchart of the proposed modeling framework.
Model performance evaluation
A single statistical measure was used to compare the ETo generated from the baseline or observed data with that generated from PRECIS. For each of the locations the statistical criteria of Percentage Error of Estimate (PE) was used to evaluate if there would be change in ETo in the year 1998 and in the future scenarios of the years 2050-2055. If there is a change what would be the extent at which the ETo values as a result climate change would differ from the baseline ETo values. The PE is defined as:
Where  and
and  are averages of Pi and Oi which are the ith predicted data using PRECIS input data to generate future ETo values and observed input data to generate baseline ETo values respectively.
Results And Discussion
Climate change scenarios
Six predicted monthly trends in Tmax, Tmiv and precipitation were compared in three different sites in the southern part of the Belize the second in the central part of the country and the third in the northern part of the country. At these locations as seen in Figure 2 the model value of Tmax and Tmiv are fairly higher than the observed values. The highest Tmax value was in 2050 at Central Farm with a high of 38.4ºC in the month of August and likewise the lowest Tmiv value was at the same site in 2053 with a low of 18.3ºC. In Figures 2a-1, 2a-2 and 2b-1 a clear distinction is possible between the observed and the modeled temperature values. Also Figures 2b-2 can be considered as having a clear distinction since only in the month of May and June in the year 2052 does the Tmiv value exceed or overlap the observed Tmiv value. The Towerhill site however showed a different result in comparison to the previous sites whereby Figures 2a-3 and 2b-3 showed observed Tmax similar to modeled Tmax temperature, which is similar to findings made by [27] and observed Tmiv values higher than modeled Tmiv values. The observation between validates the effect of climate change on temperature.
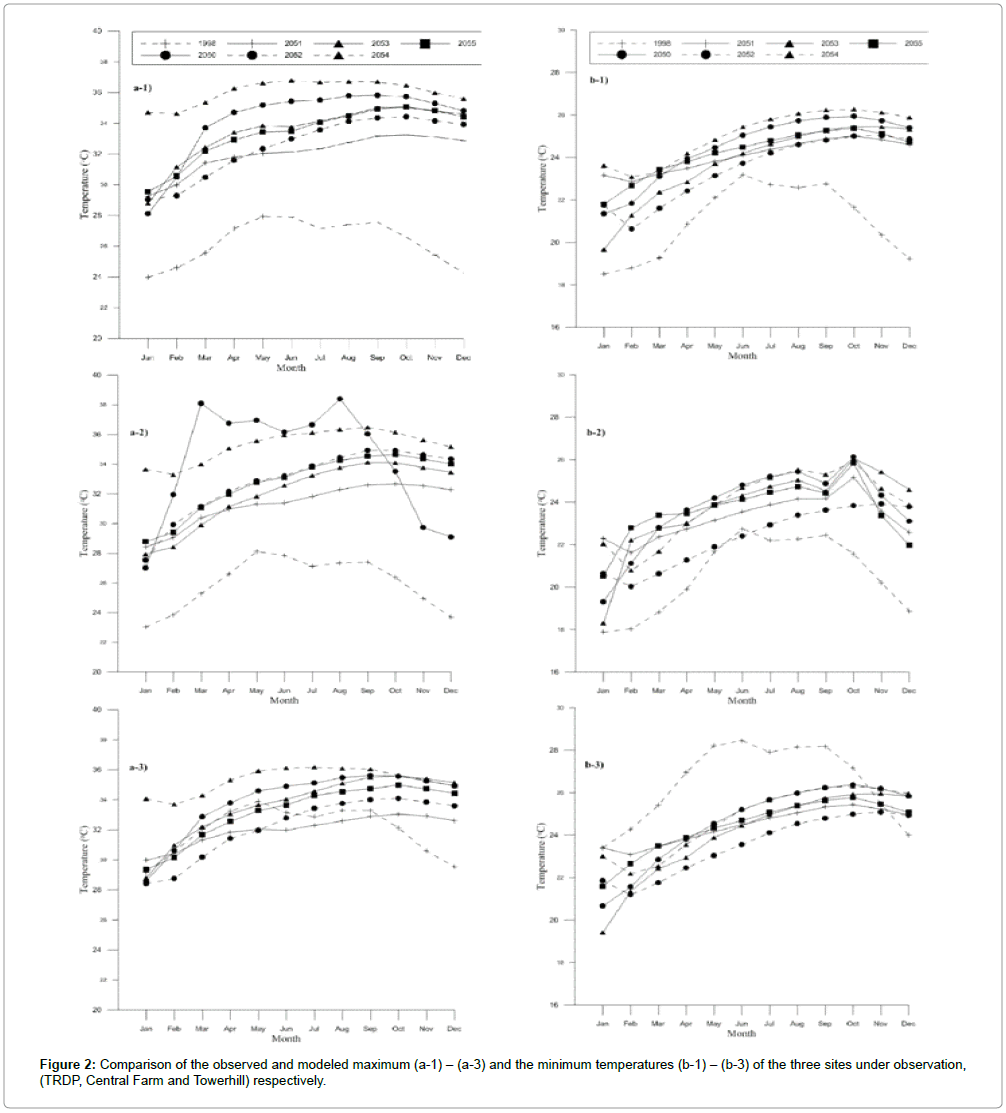
Figure 2: Comparison of the observed and modeled maximum (a-1) – (a-3) and the minimum temperatures (b-1) – (b-3) of the three sites under observation, (TRDP, Central Farm and Towerhill) respectively.
Precipitation scenario
The rainfall for the sites were compared using the observed data for the year 1998 and the predicted data for the years 2050 thru 2055 as illustrated in Figure 3. Where it can be observed that the site with the highest precipitation is TRDP and the site with the lowest precipitation is Towerhill. Figure 3 shows that with the exception of Towerhill in the year 2051 the remaining two sites are in general agreement with [27,28] whom in their studies documented that climate change will not only bring about variation in rainfall but the more common occurrence would be a reduction from the present volume falling on the earth’s surface. This was observed in this study where in the future scenarios during the 2050 to 2055 where significantly lower in comparison the observed precipitation value as seen in Table 1.
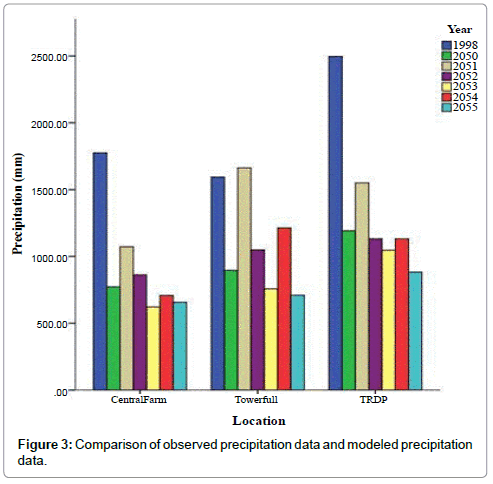
Figure 3: Comparison of observed precipitation data and modeled precipitation data.
Where the reduction range from a low of 37.89% in 2051 to a high of 64.63% in 2055 at the TRDP site, a low of 39.57 % in 2051 to a high of 64.93% at the Central Farm site and a low of 23.87% in 2054 and a high of 55.45% at the Towerhill site. As stated by [28] and furthe documented by [29] there is an overall trend in regards to precipitation when observing climate change which is the general decrease however there exist the possibility that in a given year rather than a reduction an increase of precipitation can occur. This was observed in the year 2051 at the Towerhill site where rather than a reduction in precipitation the value was 4.28 % greater than the observed value of 1998.r
Scenario comparison
The results of the model performance evaluation are seen below in Table 1, where it can be observed that in the year 2051 the least amount of increase or decrease with respect to ETo, Rainfall, Tmax and Tmiv will occur. The maximum increase and maximum decrease however is not confined to a single modeled year. The maximum increase in ETo amongst the three sites occurred in 2054 at TRDP, the maximum decrease in precipitation was at Central Farm in 2053, the maximum increase in Tmax and Tmiv was at TRDP in 2054.
| Variable | Location | Year | |||||
|---|---|---|---|---|---|---|---|
| 2050 | 2051 | 2052 | 2053 | 2054 | 2055 | ||
| Trdp | 59.77 | 38.03 | 48.25 | 55.69 | 74.56 | 51.39 | |
| ETo | Central Farm | 64.51 | 35.37 | 57.8 | 39.69 | 72.64 | 47.37 |
| Towerhill | 33.28 | 15.4 | 23.42 | 33.64 | 43.91 | 27.15 | |
| Trdp | -52.22 | -37.89 | -54.6 | -58.08 | -54.63 | -64.63 | |
| Rainfall | Central Farm | -56.42 | -39.57 | -51.41 | -64.93 | -60.09 | -62.98 |
| Towerhill | -43.82 | 4.28 | -34.17 | -52.49 | -23.87 | -55.45 | |
| Trdp | 30.14 | 21.75 | 23.7 | 27.25 | 37.09 | 26.76 | |
| Tmax | Central Farm | 31.66 | 20.57 | 26.43 | 23.28 | 35.85 | 26.04 |
| Towerhill | 6.15 | 0.04 | 0.65 | 5.27 | 10.36 | 3.81 | |
| Trdp | 16.6 | 14.69 | 11.84 | 13.17 | 19.38 | 15.38 | |
| Tmin | Central Farm | 15.56 | 13.22 | 8.82 | 15.5 | 16.17 | 14.74 |
| Towerhill | -7.15 | -7.68 | -11.11 | -9.24 | -6.41 | -7.74 | |
(+) Shows an increase and (-) a decrease with respect to the value of the variable
Table 1: Difference of future scenarios (2050-2055) to that of observed conditions (1998) (PE).
The overall results of Table 1 are in agreement with several studies [2,6,15,16,18,23,24,29-33] which highlight there will be changes made to the various climatic variables listed which in turn will increase the vulnerability of agricultural production [7] especially crop production [10,17,27].
Reference evapotranspiration (ETo)
The ETo values generated from CROPWAT are presented in Figure 4 where it can be seen that firstly all ETo values in the future scenarios are higher than that of the observed ETo values at all three sites under observation and secondly the increase in ETo values from the months of February to late May early June coincides with the country’s dry season which peaks in the month of May. In Figure 4b which is representative of the Central Farm site both the highest and the lowest ETo values were calculated. The highest was 6.08 mm/day in the month of August which also coincides with the highest Tmax value of the same year and the lowest ETo value was 2.65 mm/day for January of the same year.
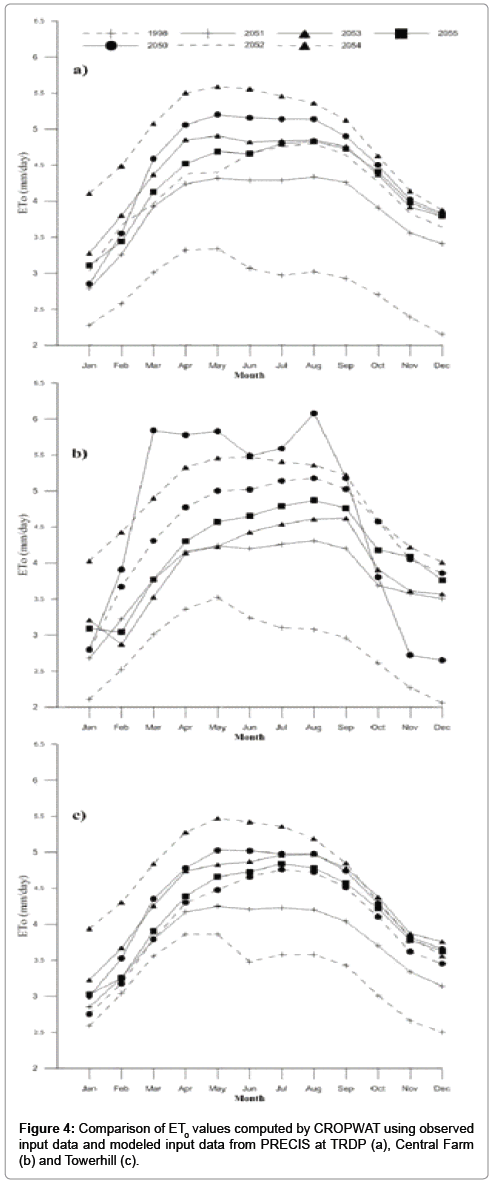
Figure 4: Comparison of ETo values computed by CROPWAT using observed input data and modeled input data from PRECIS at TRDP (a), Central Farm (b) and Towerhill (c).
Any change in ETo as seen in the results will likely have a profound effect on agriculture more specifically crop production. The effect of which according to [34] can impact agriculture mainly in two ways increasing crop water needs (water demand) and modifying crop patterns and growing seasons. To understand how an increase in ETo influence water demand the procedure used to determine crop water requirement (ETc) needs to be taken into consideration. ETc refers to the crop water requirement and reflects the maximum crop water demand in a given growing period [22,35]. It can be simply estimated by multiplying the reference evapotranspiration by crop coefficient or crop factor [22-24,31]. Therefore a shift in meterological variables as seen in Figure 2 and presented in Table 1 resulted in changes in ETo which would subsequently change the ETc and if the resulting values in Figure 3 are unable to meet the crop demand it would result reduction in crop productivity.
Simulated yield reduction results
Figure 5 presents the comparison of percent yield reduction as computed by the CROPWAT model for TRDP, Central Farm and Towerhill. The simulation was done for two crops namely beans and maize which are known as staple crops for Belize. The simulation consider three default soil types (light, medium and heavy) and to evaluate another possible adaptation strategy the planting date simulated for maize was both early and late in addition to the crops normal planting date.
The results show that the soil which would result in the highest yield reduction percentage for both crops at all the sites evaluated would be the light soil. The highest value being 80.1% yield reduction in Central Farm when maize was planted a month earlier in 2052. The site least affected by climate change with respect to yield reduction was TRDP. A reason would be that although there was an increase in ETo and a reduction in precipitation (Table 1). The rainfall was sufficient and met the crop water requirements and thus not impacting the yield. The rainfall based on the results was not sufficient in 2053 where it impacted yields at most of the sites. The response was explained by [36] whom mentioned the major factor which influence the yield of rain fed crops is rainfall therefore the yield would naturally vary according to rainfall level. Their study along with research conducted by other scholars [6,17,37,38] validated the yield reduction in response to climate change. Whereby some results which included sorghum, groundnut [37], onion, wheat [36,37] and maize [35,37-39] all showed a reduction in yield of in a rain fed system due to climate change scenarios.
The site impacted the most due to the climate change scenarios was Central Farm where the percent yield reduction was generated for both beans and corn in all three soil types and even by planting the crop earlier or later a reduction in yield still occurred. Shifting of cropping periods for maize was conducted to determine if the approach could be used as an adaptive strategy to mitigate the effect of climate change of this staple crop in Belize as in a previous study [28]. As shown in Figure 5 shifting cropping period can be utilized as a mitigating strategy. As it is more clearly depicted in at the Central Farm site (Figures 5e, 5h and 5k) where later planting season resulted in a lower percentage of yield reduction of the maize crop planted.
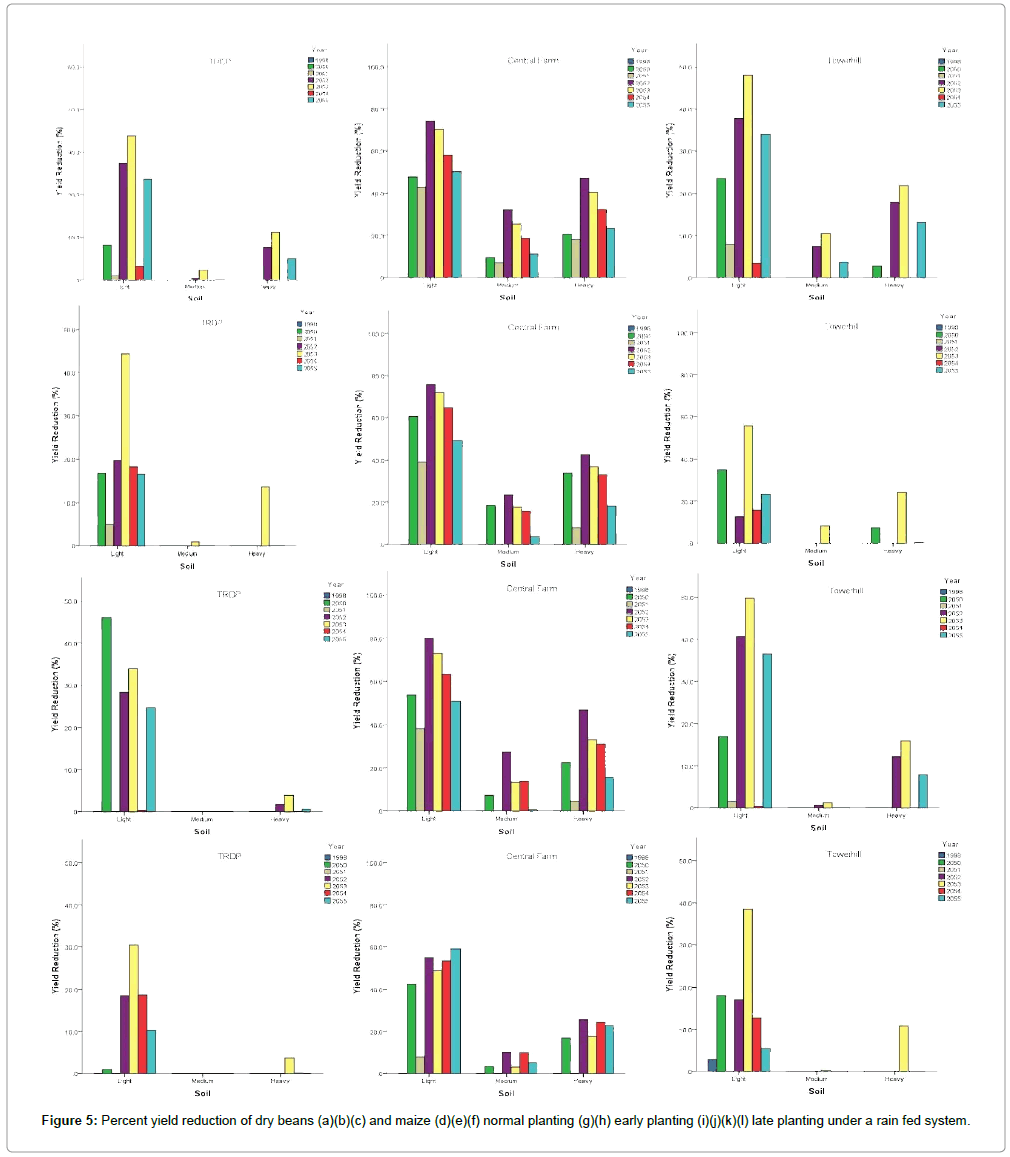
Figure 5: Percent yield reduction of dry beans (a)(b)(c) and maize (d)(e)(f) normal planting (g)(h) early planting (i)(j)(k)(l) late planting under a rain fed system.
Conclusions
There is a need for a fundamental shift in water and land policy in Belize to avert a food crisis in the future due to climate change. This study investigated the use of PRECIS in combination with CROPWAT to determine the possible implications of climate change on two staple crops in the country of Belize. The approach is simple method to predict the effect of climate change and thus providing the stakeholders and agricultural practitioners with the data required to formulate adaptation and mitigation programs for water and land use on an annual basis. More the former since water availability is known to be the most striking consequences of climate change for the agricultural sector. Furthermore since it is the mandate of the country to enhance agriculture production currently and in the future additional research is needed to encompass more crops. Before doing so as a recommendation, due to data unavailability at certain meteorological sites the first step would require a sensitivity analysis to observe the various climatic variables on ETo and the variation of ETo across the country. With the objective being to improve the input data since climatic variables vary not only between regions but locally as well. Therefore the impact to the sector as seen in the study will also vary. Although some limitations with data availability were encountered the approach was able to reveal possible impact of climate change.
References
- IPCC (2007) Climate change 2007: Impacts, adaptation, and vulnerability vol 1032. New York.
- Tubiello FN, Fischer G (2007) Reducing climate change impacts on agriculture: Global and regional effects of mitigation, 2000–2080. Technol Forecasting Social Change 74: 1030-1056.
- IPCC (2001) Climate Change 2001: IPCC Third Assessment Report - The Scientific Basis. World Meteorological Organization, Switzerland.
- Kaminski KP, Kørup K, Nielsen KL, Liu F, Topbjerg HB, et al. (2014) Gas-exchange, water use efficiency and yield responses of elite potato (Solanumtuberosum L.) cultivars to changes in atmospheric carbon dioxide concentration, temperature and relative humidity. Agr Forest Meteorol 187: 36-45.
- Singh KP, Ghoshal N, Singh S (2009) Soil carbon dioxide flux, carbon sequestration and crop productivity in a tropical drylandagroecosystem: Influence of organic inputs of varying resource quality. Appl Soil Ecol 42: 243-253.
- Kumar SN, Aggarwal PK (2013) Climate change and coconut plantations in India: Impacts and potential adaptation gains. Agr Sys 117: 45-54.
- Mestre-SanchÃs F, Feijóo-Bello ML (2009) Climate change and its marginalizing effect on agriculture.Ecol Econ 68: 896-904.
- Gohari A, Eslamian S, Abedi-Koupaei J, Bavani AM, Wang D, et al. (2013) Climate change impacts on crop production in Iran's Zayandeh-Rud River Basin. Sci Total Environ 442: 405-419.
- Agyenim JB, Gupta J (2012) IWRM and developing countries: Implementation challenges in Ghana. PhysChem Earth, Parts A/B/C 47-48: 46-57.
- Calzadilla A, Zhu T, Rehdanz K, Tol RSJ, Ringler C (2014) Climate change and agriculture: Impacts and adaptation options in South Africa. Water Resour Econ 5: 24-48.
- Ludwig F, SlobbeEv, Cofino W (2013) Climate change adaptation and Integrated Water Resource Management in the water sector. J Hydrol (In Press).
- Molle F (2008) Nirvana Concepts, Narratives and Policy Models: Insights from the Water Sector. Water Alternatives 1: 131-156.
- Parry ML, Rosenzweig C, Iglesias A, Fischer G (2001) Millions at risk: defining critical climate change threats and targets. Global Environ Change 11: 181-183.
- FAO, WFP, IFAD (2012) The State of Food Insecurity in the World. Food and Agriculture Organization of the United Nations, Rome.
- Mendelsohn R (2014) The Impact of Climate Change on Agriculture in Asia. J IntegrAgr 13: 660-665.
- Mendelsohn R, Dinar A (2009) Climate Change and Agriculture: An Economic Analysis of Global Impacts, Adaptation, and Distributional Effects. Edward Elgar Publishing, England.
- Hanjra MA, Qureshi ME (2010) Global water crisis and future food security in an era of climate change. Food Policy 35: 365-377.
- Rosenzweig C, Strzepek KM, Major DC, Iglesias A, Yates DN, et al. (2004) Water resources for agriculture in a changing climate: international case studies. Global Environ Change 14: 345-360.
- Pessarakli M (2001) Handbook of Plant and Crop Physiology. Role of Physiology in Improving Crop Adaptation to Abiotic Stresses in the Tropics: The Case of Common Bean and Tropical Forages, vol 29, Second Edition (edn). Marcel Dekker Inc., New York.
- White JW, Montes-RC (1993) The influence of temperature on seed germination in cultivars of common bean. J Exp Botany 44: 1795-1800.
- Gross Y, Kigel J (1994) Differential sensitivity to high temperature of stages in the reproductive development of common bean (Phaseolus vulgaris L.). Field Crop Res 36: 201-212.
- Allen RG, Pereira LS, Raes D, Smith M (1998) Crop evapotranspiration: guidelines for computing crop water requirements –FAO Irrigation and drainage paper 56, Rome.
- Smith M (1992) CROPWAT, A Computer Program for Irrigation Planning and Management vol 46. Rome
- Stancalie G, Marica A, Toulios L (2010) Using earth observation data and CROPWAT model to estimate the actual crop evapotranspiration. PhysChem Earth, Parts A/B/C 35: 25-30.
- Sentelhas PC, Gillespie TJ, Santos EA (2010) Evaluation of FAO Penman–Monteith and alternative methods for estimating reference evapotranspiration with missing data in Southern Ontario, Canada. Agr Water Manage 97: 635-644.
- Jones RG, Noguer M, Hassel DC, Hudson D, Wilson SS, et al. (2004) Generating High Resolution Climate Change Scenarios using PRECIS. Met Office Hadley Centre, Exeter, UK.
- Jalota SK, Kaur H, Kaur S, Vashisht BB (2013) Impact of climate change scenarios on yield, water and nitrogen-balance and -use efficiency of rice-wheat cropping system. Agr Water Manage 116: 29-38.
- Chowdhury S, Al-Zahrani M, Abbas A (2013) Implications of climate change on crop water requirements in arid region: An example of Al-Jouf, Saudi Arabia. J King Saud U - EngSci (In Press).
- Rao KK, Patwardhan SK, Kulkarni A, Kamala K, Sabade SS, et al. (2014) Projected changes in mean and extreme precipitation indices over India using PRECIS. Global Planet Change 113: 77-90.
- Mendelsohn R (2008) The Impact of Climate Change on Agriculture in Developing Countries. J Nat Resour Policy Res 1: 5-19.
- Smith M (2000) The application of climatic data for planning and management of sustainable rainfed and irrigated crop production. Agr Forest Meteorol 103: 99-108.
- Vermeulen SJ, Aggarwal PK, Ainslie A, Angelone C, Campbell BM, et al. (2012) Options for support to agriculture and food security under climate change. Environ Sci Policy15: 136-144.
- Zhang X, Xu Y-P, Fu G (2014) Uncertainties in SWAT extreme flow simulation under climate change. J Hydrol 515: 205-222.
- Croitoru A-E, Piticar A, Dragota CS, Burada DC (2013) Recent changes in reference evapotranspiration in Romania. Global Planet Change 111:127-136.
- Yang X, Gao W, Shi Q, Chen F, Chu Q (2013) Impact of climate change on the water requirement of summer maize in the Huang-Huai-Hai farming region Agr Water Manage 124:20-27.
- Lathat KVA, Gopinath M, Bhat ARS (2012) Impact of Climate Change on Rainfed Agriculture in India: A Case Study of Dharwad. Int J Environ Sci Develop 3: 368-371.
- Kang Y, Khan S, Ma X (2009) Climate change impacts on crop yield and food security - A review. Prog Nat Sci 19: 1665-1674.
- Mubvuma MT (2013) Climate Change: Matching Growing Season Length with Maize Crop Varietal Life Cycles in Semi-Arid with Maize Crop Varietal Life Cycles in Semi-Arid Regions of Zimbabwe. Greener J AgrSci 3: 809-816.
- Nkomozepi T, Chung S-O (2012) Assessing the trends and uncertainty of maize net irrigation water requirement estimated from climate change projections for Zimbabwe.Agr Water Mana ge 111: 60-67.
Citation: Gladden LA (2014) A Predictive Approach to Simulate Possible Impacts of Climate Change on the Agricultural Sector. J Earth Sci Clim Change 5: 231. DOI: 10.4172/2157-7617.1000231
Copyright: ©2014 Gladden LA. This is an open-access article distributed under the terms of the Creative Commons Attribution License, which permits unrestricted use, distribution, and reproduction in any medium, provided the original author and source are credited.
Select your language of interest to view the total content in your interested language
Share This Article
Recommended Journals
Open Access Journals
Article Tools
Article Usage
- Total views: 14953
- [From(publication date): 11-2014 - Jul 09, 2025]
- Breakdown by view type
- HTML page views: 10347
- PDF downloads: 4606